

Pi Network (PI) started August with a sharp decline, recording a new all-time low of $0.32.
Subsequently, the altcoin slightly recovered to $0.36, but the downward trend remains dominant. This suggests the possibility of returning to the cycle bottom within a few weeks or falling deeper below this level.
Pi rises 4%... Negative Divergence Momentum Threatens
Pi's price recorded a significant increase today, ignoring the market's slight decline. Over the past 24 hours, the Token's price rose 4% to reach $0.36. While this short-term price increase may provide some hope for PI holders, technical indicators suggest that caution is still important.
First, the decrease in trading Volume during the past 24 hours while PI's price increased is a cause for concern. Over the past day, PI's Volume has decreased by almost 30%, currently reaching approximately $112 million.
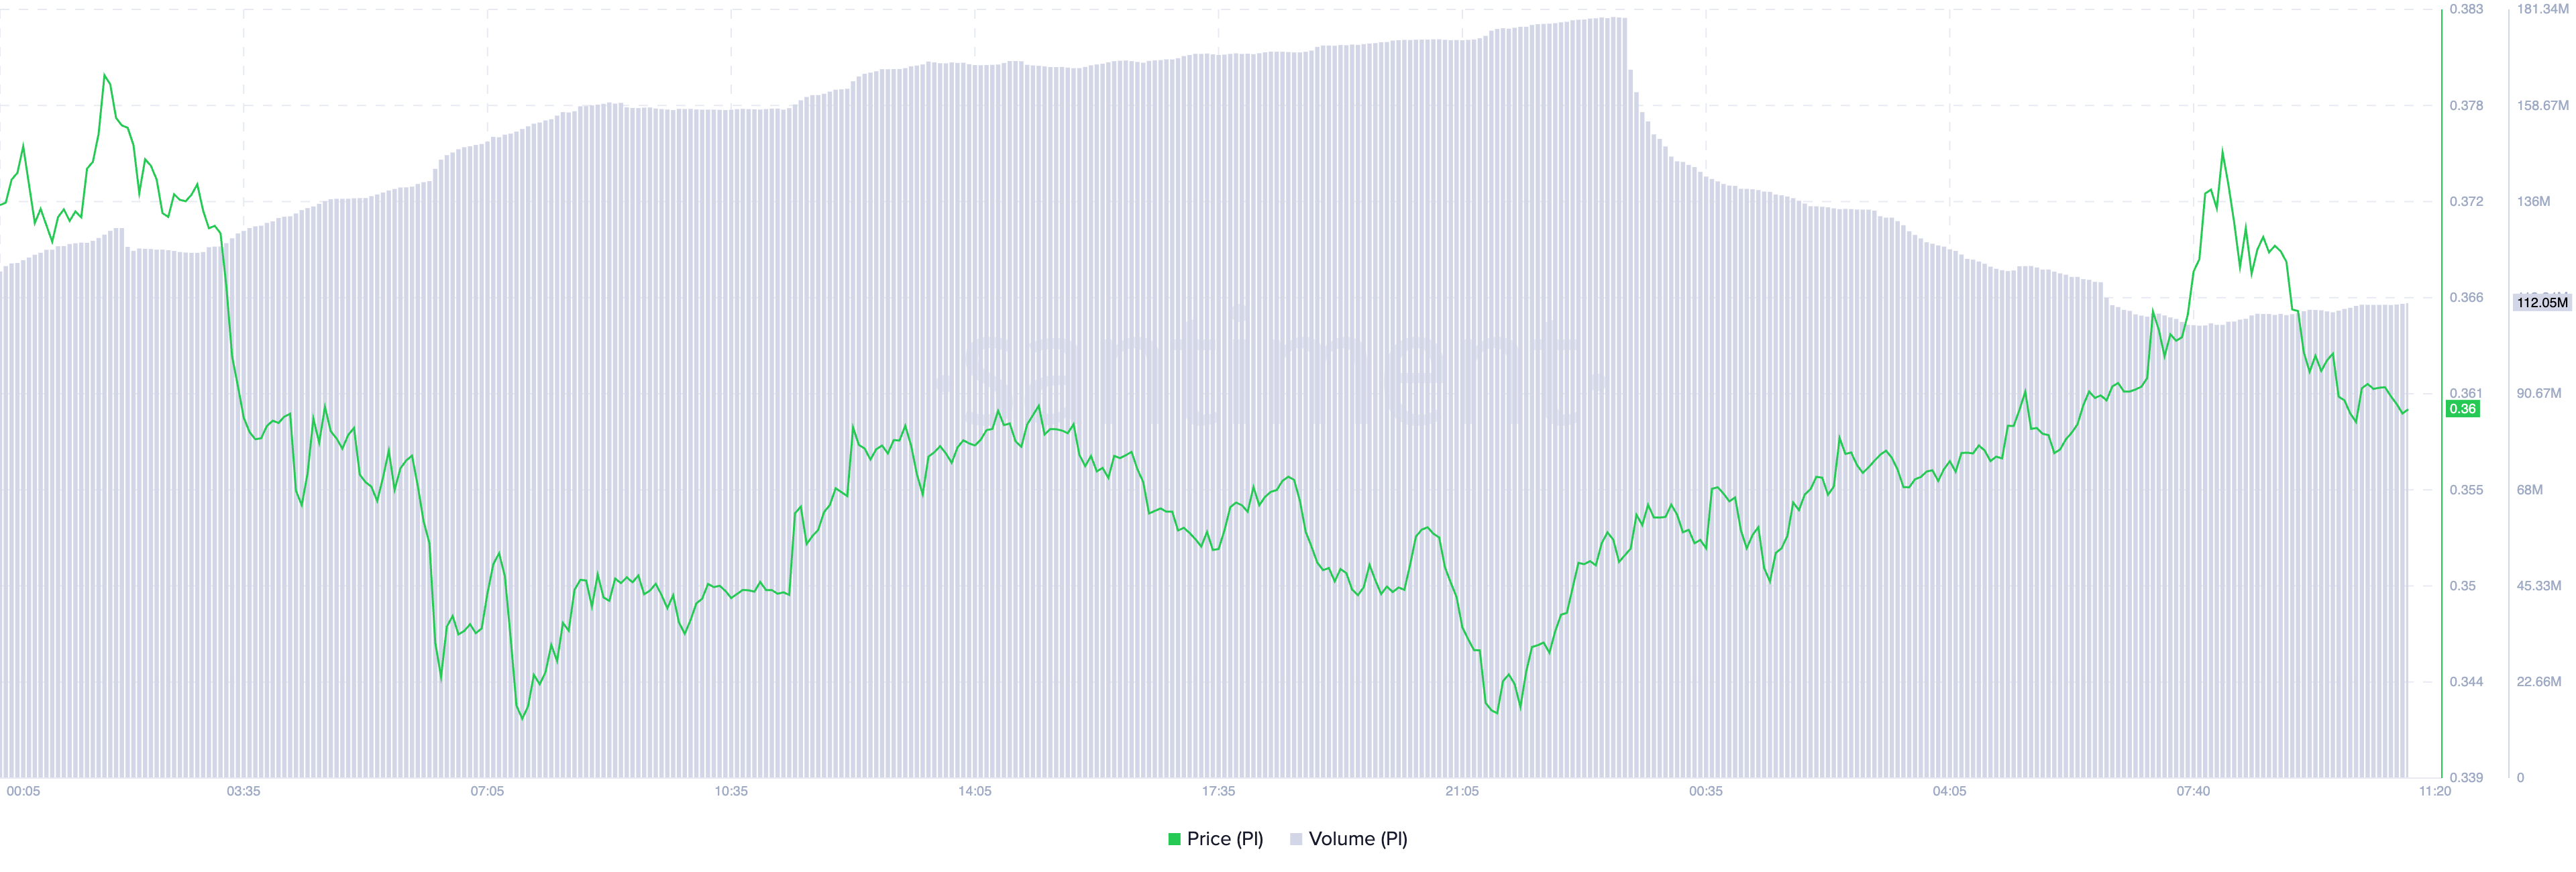
The decrease in trading Volume alongside price increase creates a negative divergence, indicating that PI's upward momentum is not receiving critical support.
Moreover, the Parabolic Stop and Reverse (SAR) indicator for PI confirms this downward outlook. At the time of writing, the points constituting the indicator are positioned above the Token's price, providing dynamic resistance at $0.47.
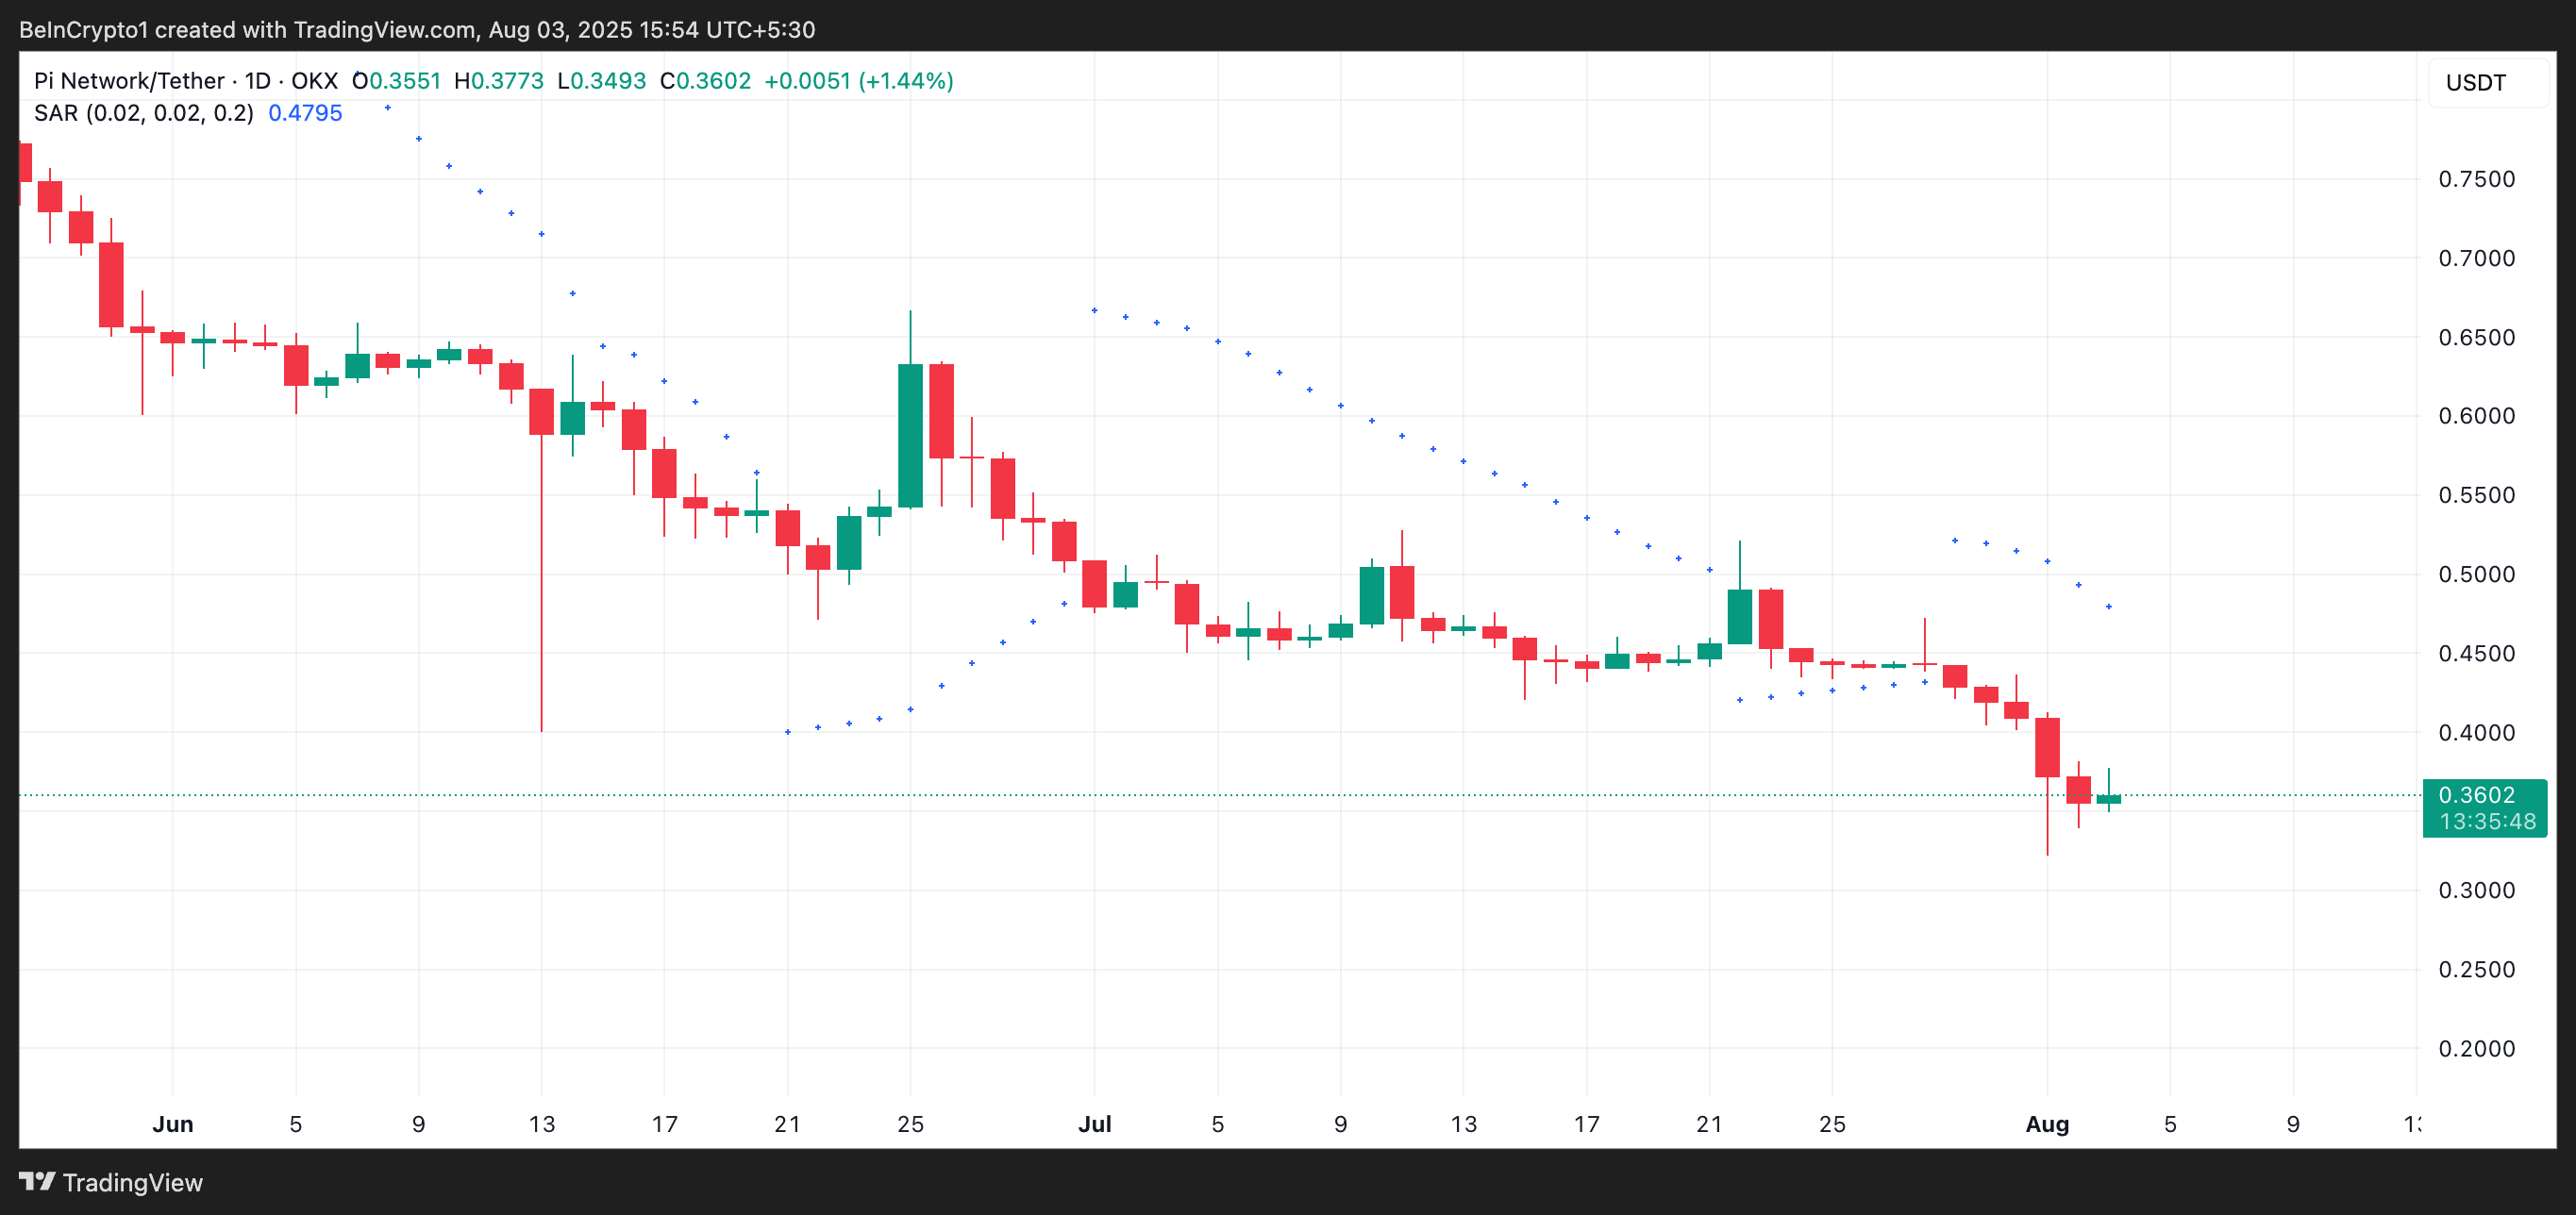
The asset's Parabolic SAR indicator identifies potential trend direction and reversal. When points are located below the asset's price, the market is in an uptrend. This indicates the asset is experiencing bullish momentum and prices can continue rising if buying persists.
Conversely, when the price is positioned below these points, it indicates the market is in a downtrend. This suggests bearish momentum and the possibility of PI price further declining, unless a bullish reversal occurs.
Bears Near PI's All-Time Low... Only New Demand Can Save It
On the daily chart, PI oscillates between a support line formed at the new all-time low of $0.32 and a resistance line at $0.40. With bears still dominating, PI may resume its decline and recover its all-time low or fall below it.
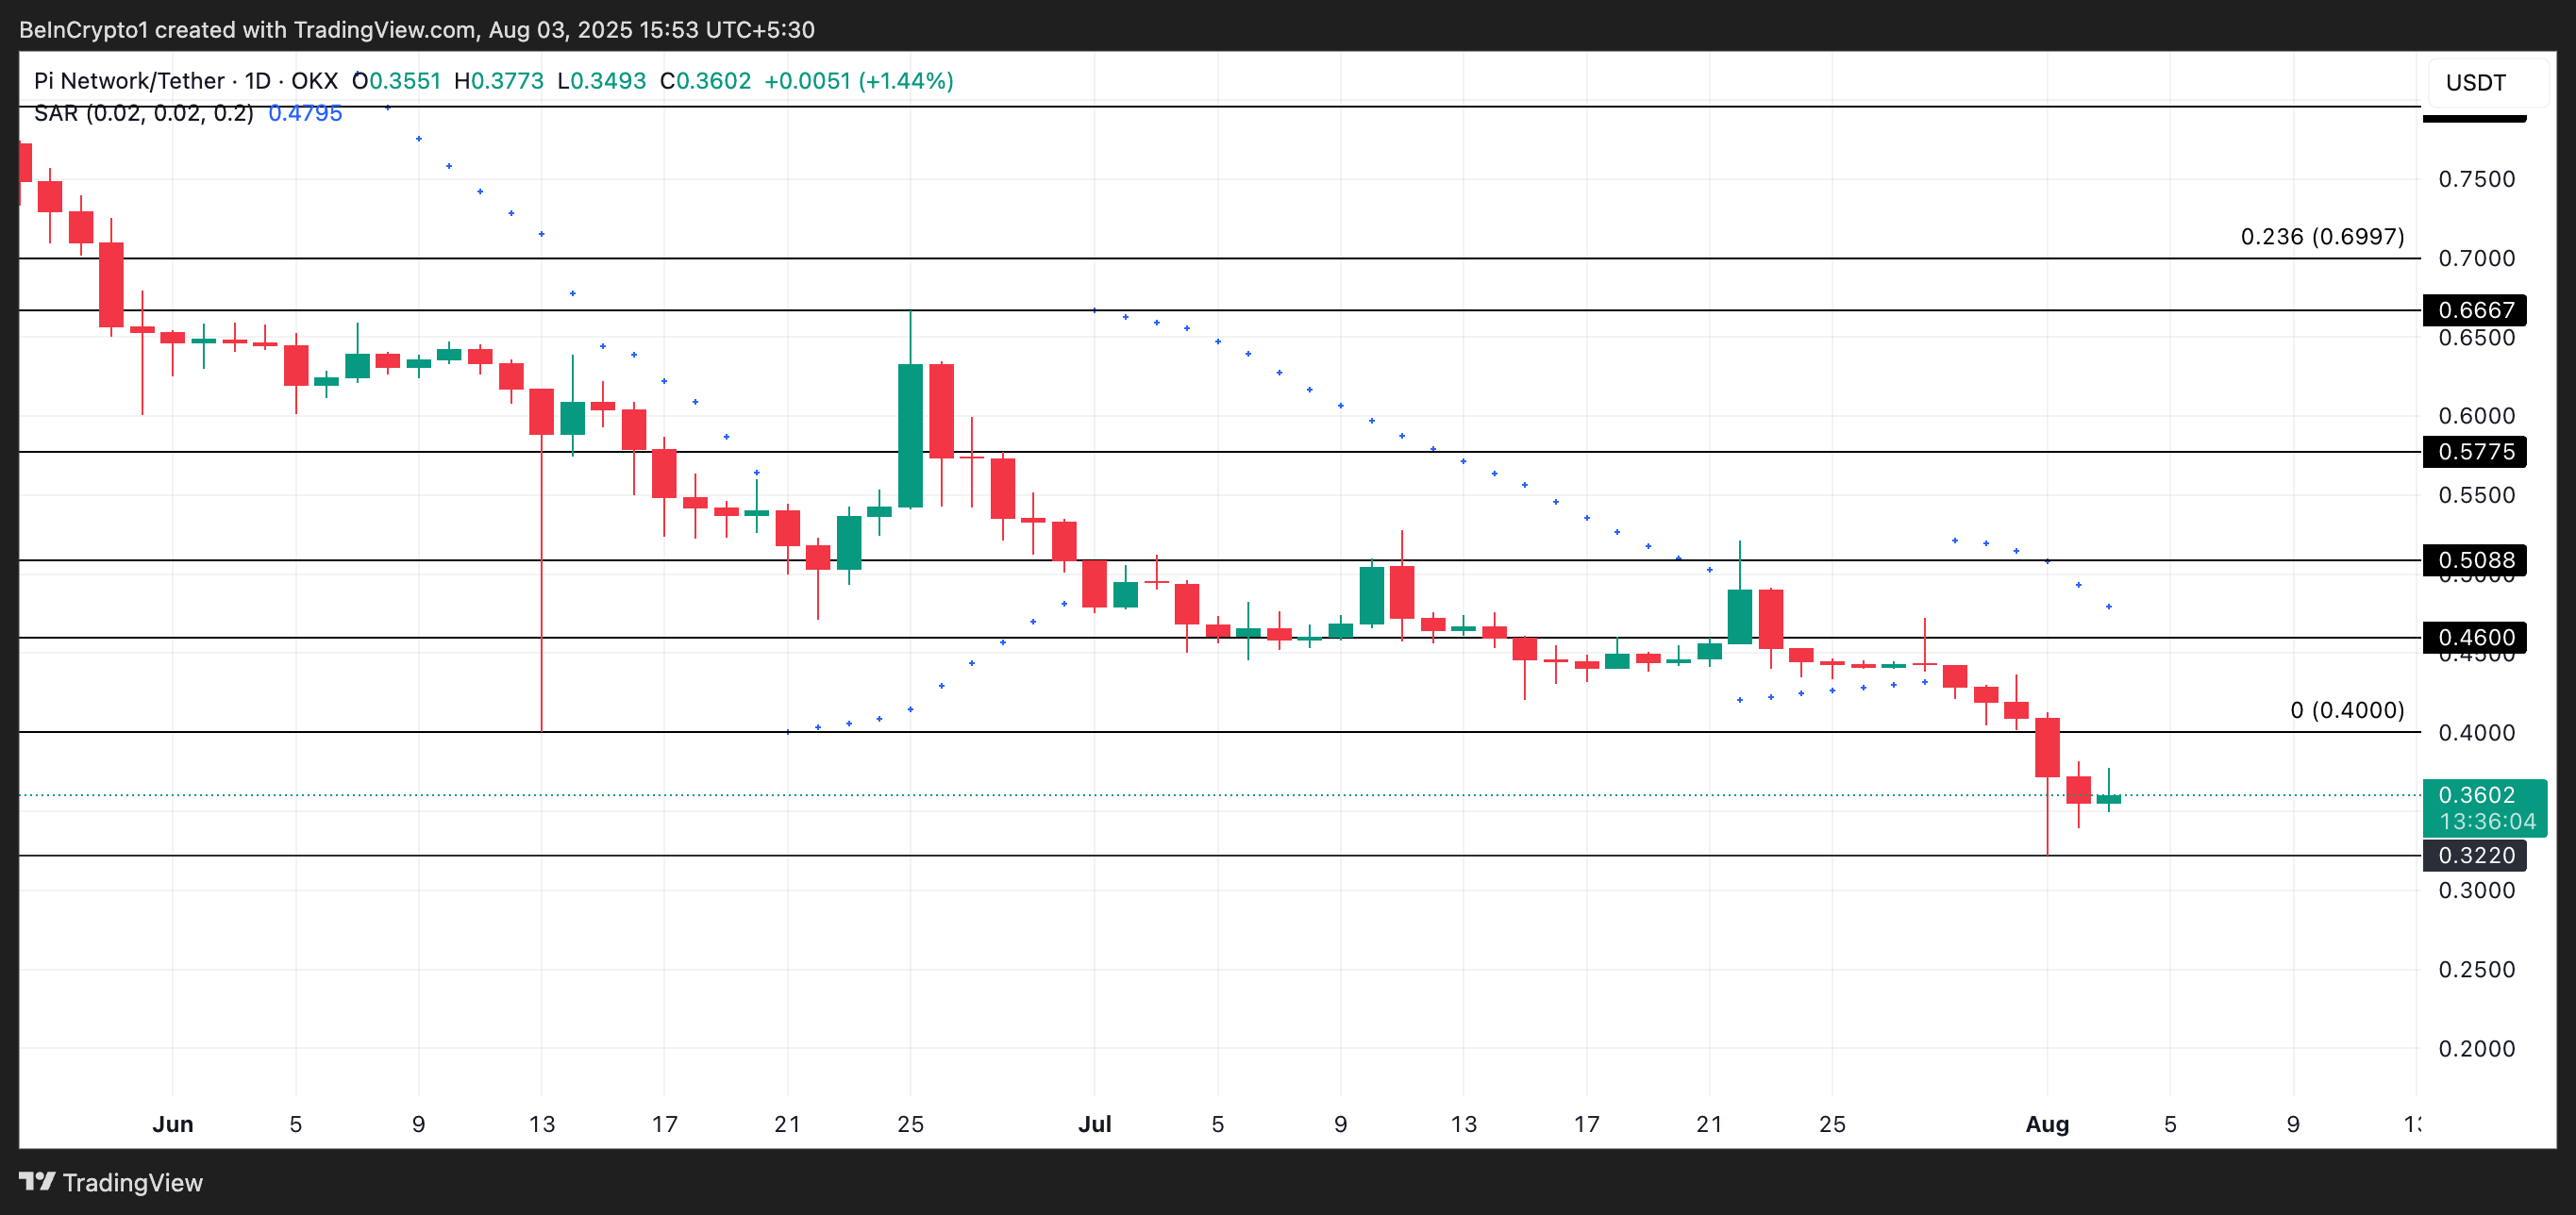
However, if new demand emerges, PI's price could rise above $0.40 to $0.46.


