

Solana's price has fluctuated over the past three months, providing a modest 7.9% increase. On a monthly scale, the price only rose by 2.3%, which is hardly convincing for optimism. However, behind this flat trajectory are strong and sudden surges; brief but powerful rallies have kept SOL in traders' sights.
Currently, after dropping 5.29% in the past 24 hours, Solana has slipped to $180, once again following the broader cryptocurrency market correction. But while sentiment weakens, on-chain setup is beginning to resemble previous conditions that led to quick reversals. Two important indicators are quietly building a setup based on this price increase.
Large Holders Are Not Participating in the Dump
On 17/08/2025, Solana's Coin Days Destroyed (CDD) index dropped to 161.79 million, the second-lowest daily value this month. Just a day earlier, on 16/08/2025, CDD peaked at 1.16 billion. This represents an 86% decline in coin days destroyed in one day.
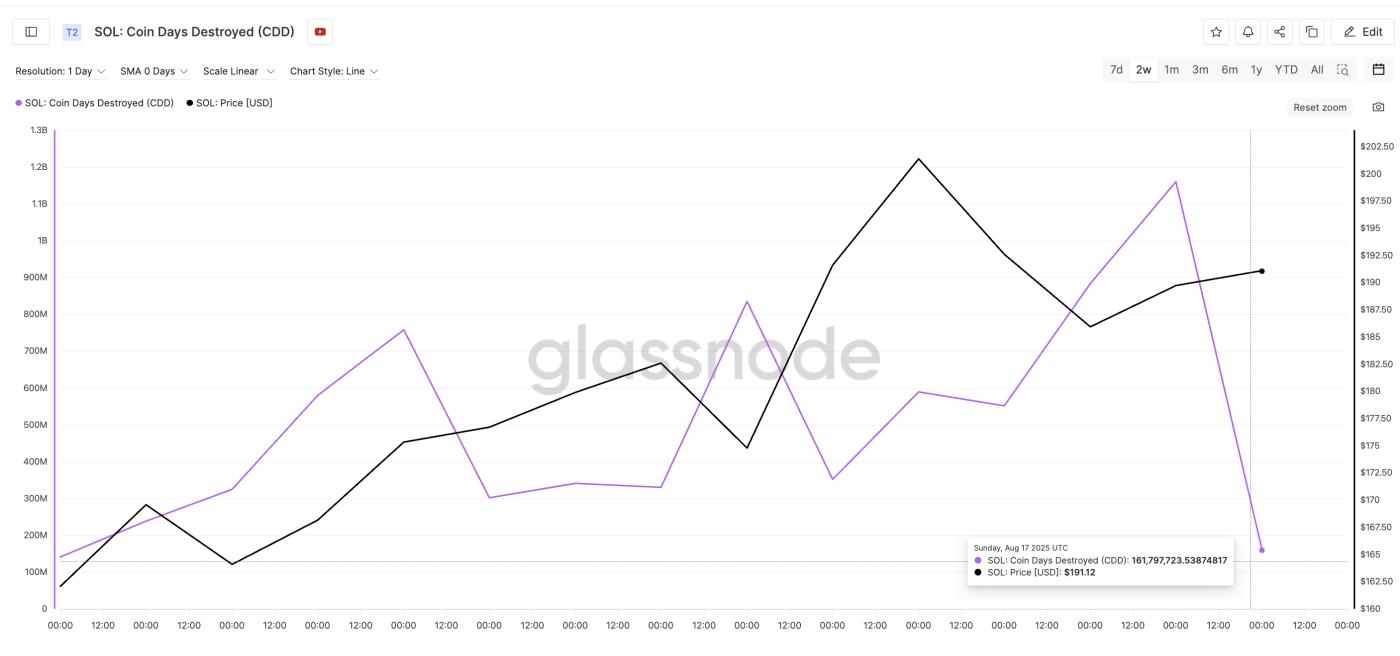 Solana Price and Coin Days Destroyed: Glassnode
This type of movement typically occurs when coins held for a long time are not sold. If SOL holders who have been silent for weeks or months suddenly dump, this number would increase significantly. This happened from 12/08/2025 to 16/08/2025.
The CDD decrease from 16/08/2025 to 17/08/2025 indicates that most moved coins are short-term or recently purchased, and most inactive supply remains unaffected. However, the optimism of this indicator will be better confirmed if CDD remains low or does not spike suddenly. This means long-term holders have completed profit-taking or selling.
Looking back to early 08/2025, similar CDD drops coincided with Solana price consolidation periods before quick recoveries.
Coin Days Destroyed (CDD) measures coin lifespan lost when tokens are spent. The longer coins are held, the more "coin days" accumulate. When moved, these coin days are "destroyed". Higher values indicate old coins moving; lower values suggest recent spending or minimal spending.
Supply Continues Moving Outward
Combined with exchange balances, the setup becomes clearer. From 14/08/2025 to 16/08/2025, total SOL across all exchanges decreased from 32.35 million to 31.23 million. That's over 1.12 million SOL withdrawn — a reduction of approximately 3.46% in just 48 hours, during a price drop from $192 to $185.
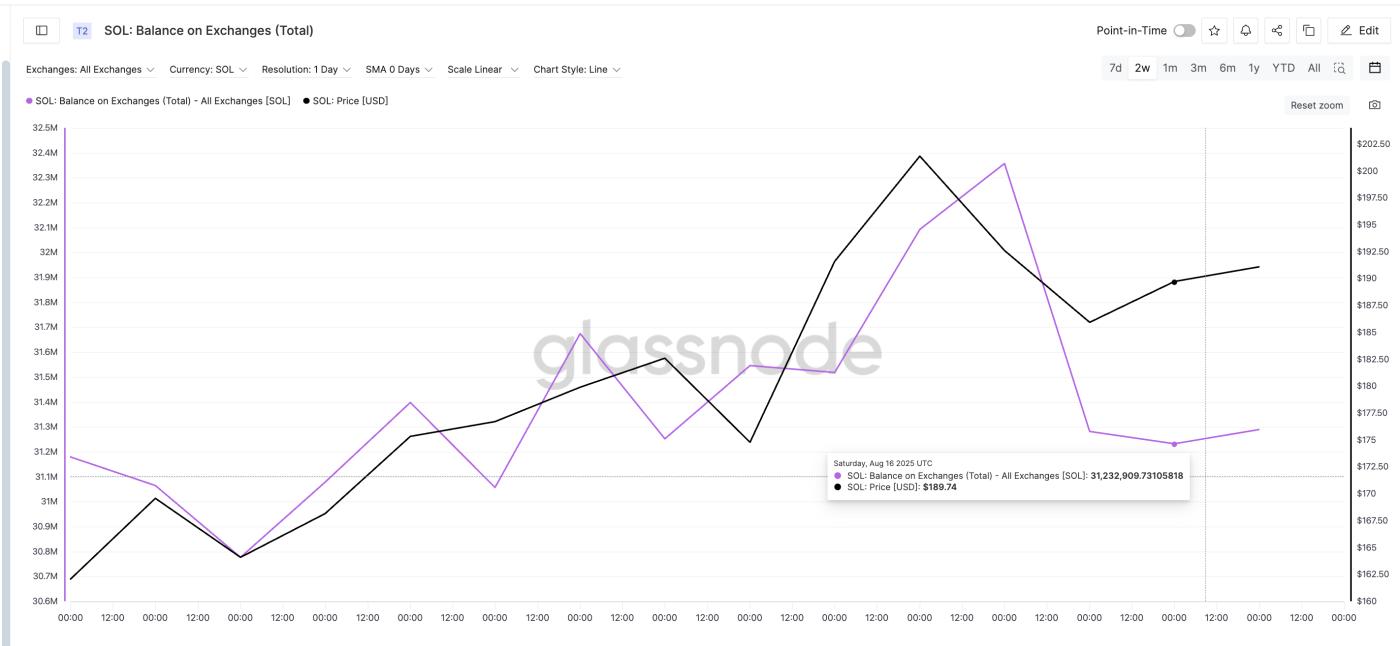 SOL Balance on Exchanges Continues Declining: Glassnode
This is noteworthy. In a typical correction, one would expect balances to increase as traders rush to exit. But the opposite is happening here. Supply is leaving exchanges, not entering, suggesting accumulation (buying during price drops) or at least no panic selling.
Both indicators tell a story of supply quietly tightening while Solana price corrects. Note that exchange balances have slightly increased at the time of writing. However, it remains near recent lows.
For TA and token market updates: Want more detailed information about tokens like this? Subscribe to the Daily Crypto Newsletter by Editor Harsh Notariya here.
Solana Price: Support Levels Hold as Structure Remains Intact
Technically, Solana price dropped to a local low of $180.89 (on 18/08/2025), rejecting the short-term resistance of $189.95. Below that, it currently sits between two zones — $178.24 and $173.46, both of which were strong reaction levels in early 08/2025.
 Solana Price Analysis: TradingView
If these levels hold, Solana could return to the $189–199 zone. This zone has been tested several times in the past month and continues to function as a medium-term resistance band. A clear breakout above $199.27 could push SOL back to the area above $209.
However, this short-term bullish hypothesis will be invalidated if Solana price breaks below $173.46.


