

Despite the weakness in the broader market, Sei blockchain's native token SEI maintains an upward trend, rising over 45% in three months and increasing by 6.3% last week.
SEI's upward momentum could expand further as major bullish patterns emerge and exchange flows indicate continuous accumulation. However, as the price continues to rise, one trading group may be at risk.
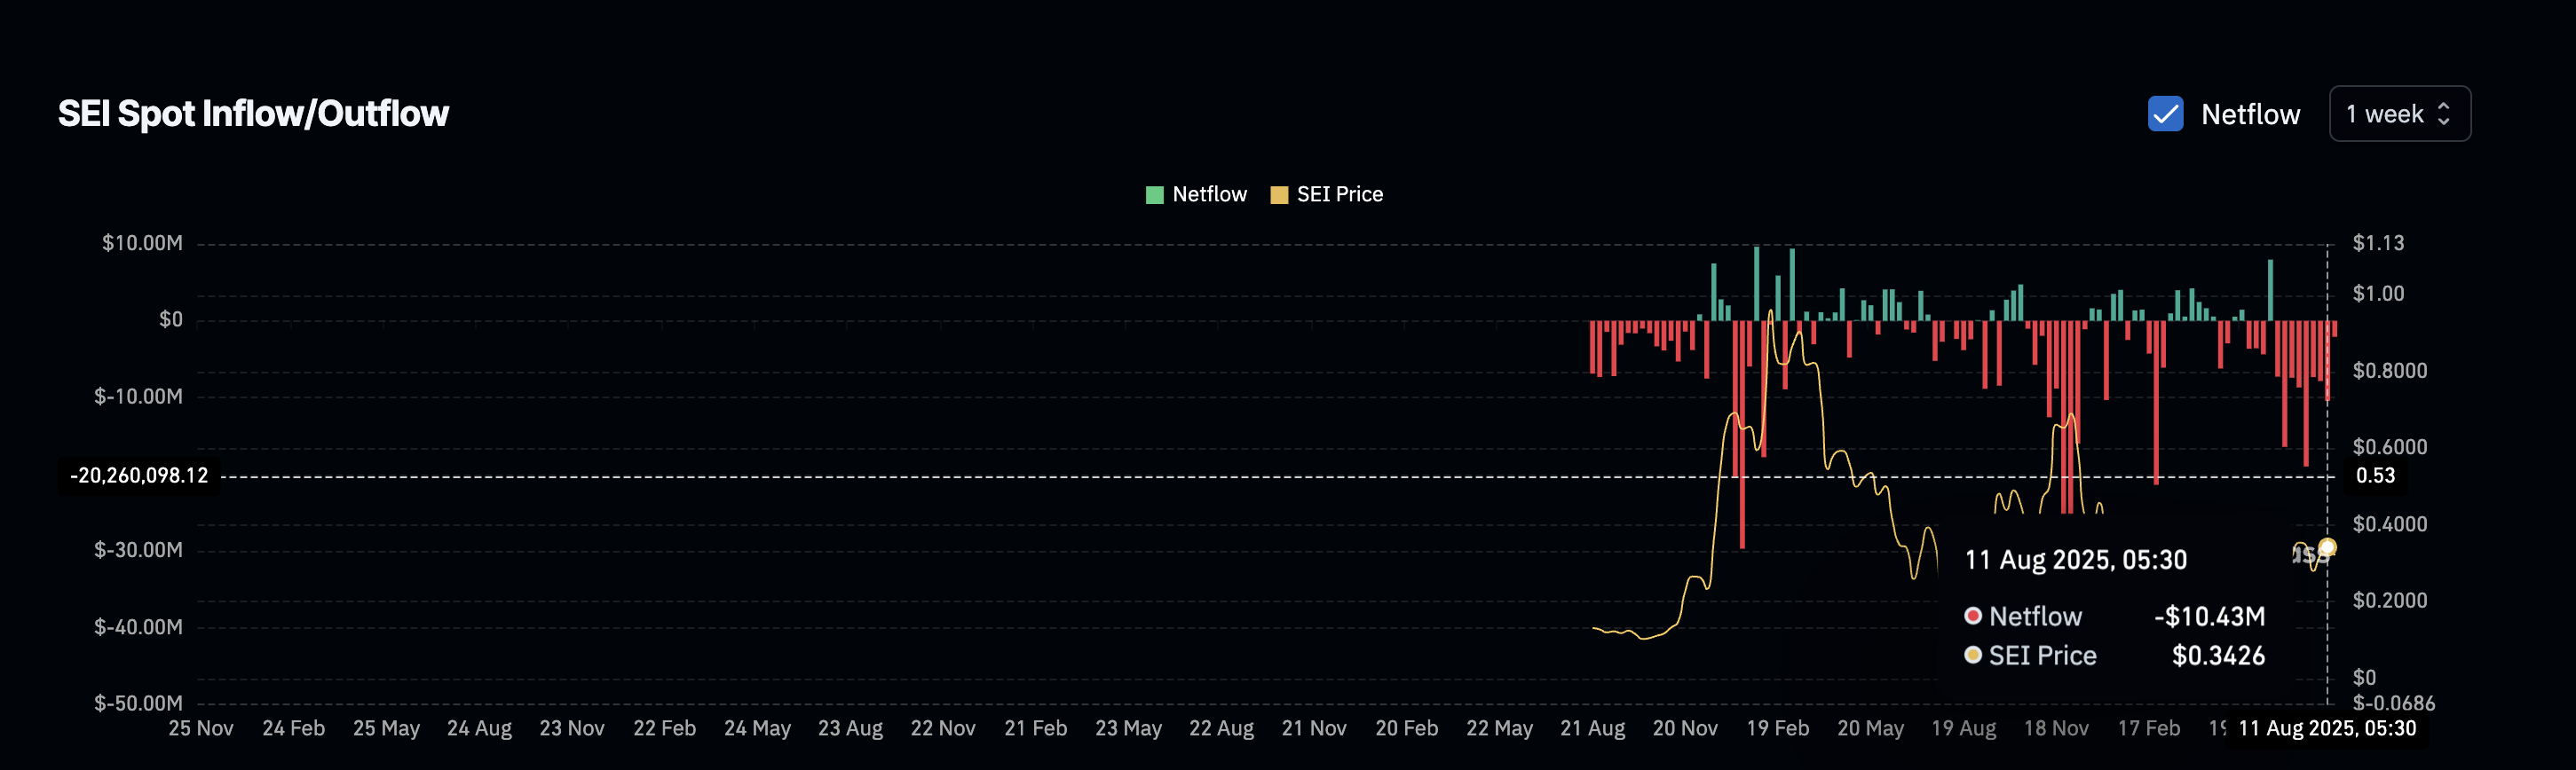
Sei Exchange Outflow Continues for 8 Consecutive Weeks
SEI has consistently flowed out of exchanges for 8 consecutive weeks. Last week alone, SEI recorded a net outflow of $10.43 million, marking the second-largest weekly total since July's peak. These continuous outflows reflect increasing buying pressure and long-term confidence.
This increased demand aligns with Sei's recent momentum. The launch of Monaco, Sei's Wall Street-grade trading layer, and CBOE's ETF application have sparked new interest among major investors.
On-chain fundamentals continue to support the price trend, with a massive increase in active addresses and total deposits approaching $626 million.
Increase in Short Positions... Bullish Crossover Forming
On the daily chart, SEI is now showing classic bullish signals. The 100-day Exponential Moving Average (EMA) is about to cross above the 200-day EMA, which is considered a medium-term buy signal. If confirmed, this crossover could accelerate the current upward trend.
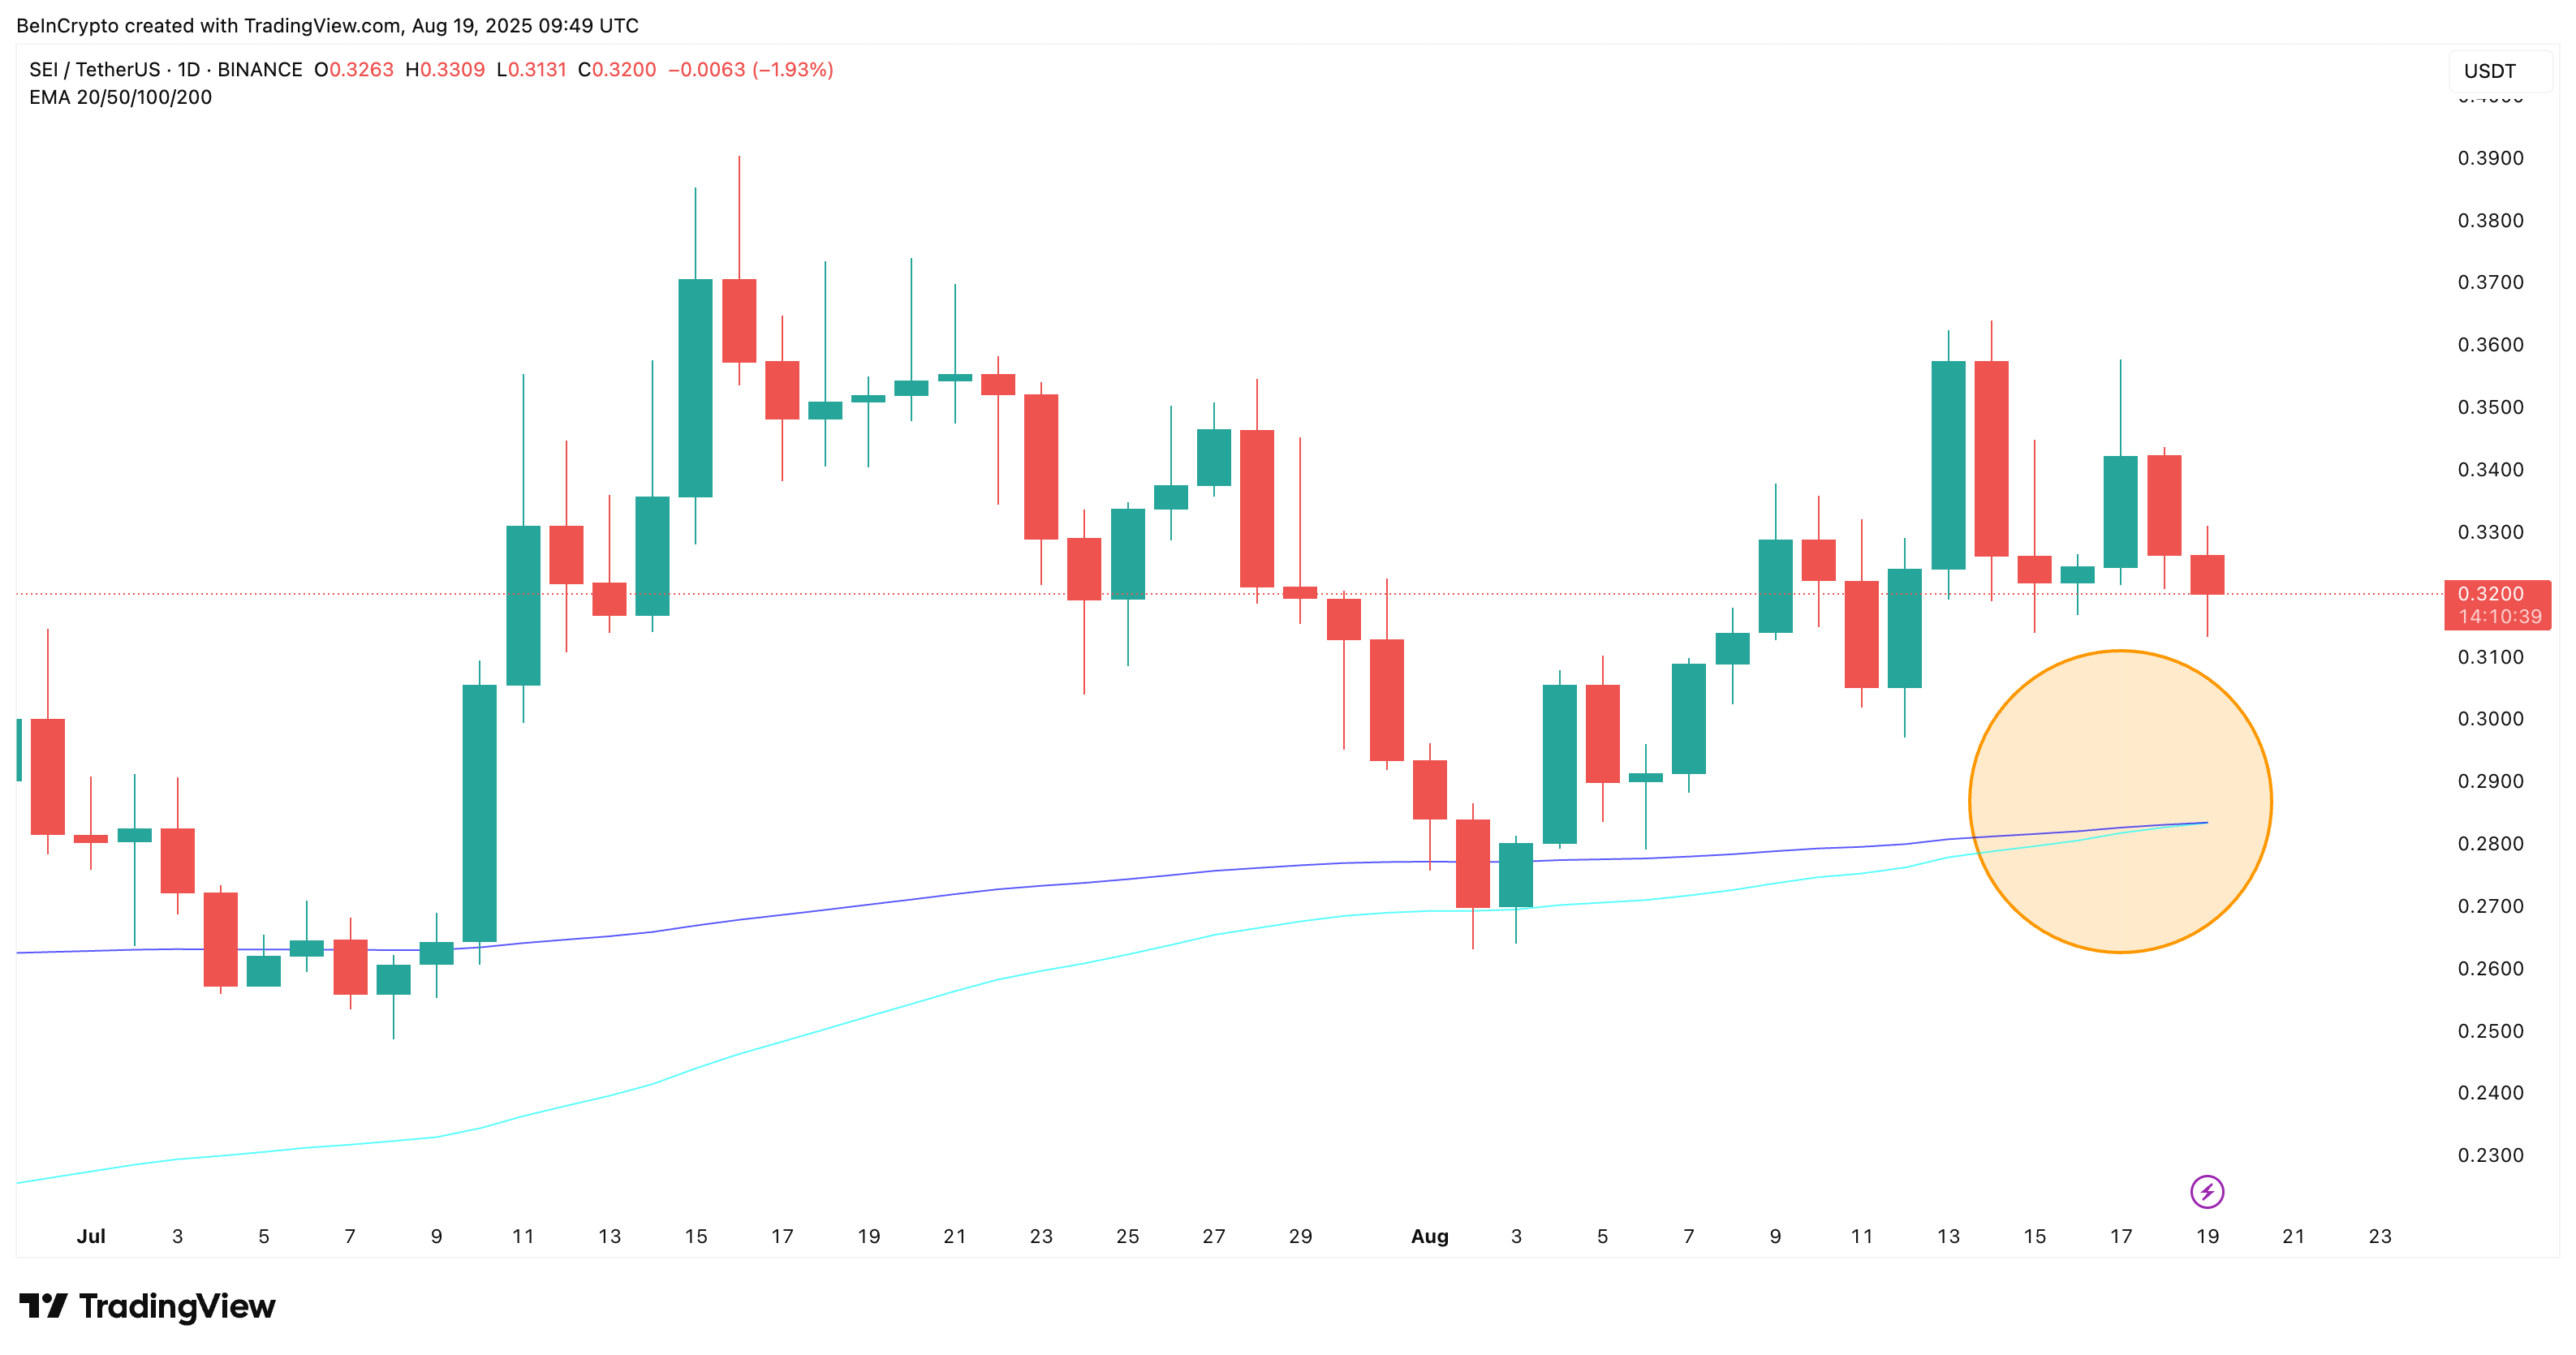
EMA is a trend-following indicator that gives more weight to recent prices. The crossover occurs when the shorter EMA (e.g., 100-day) moves above or below the longer EMA (e.g., 200-day), which can imply a change in market momentum.
Institutional investors and long-term swing traders use the 100-day/200-day crossover as a more reliable confirmation of an upward trend.
This is where risk emerges for bears. In the past 7 days, $37.34 million in short positions have accumulated on Bitget, while long positions are only $26.15 million.
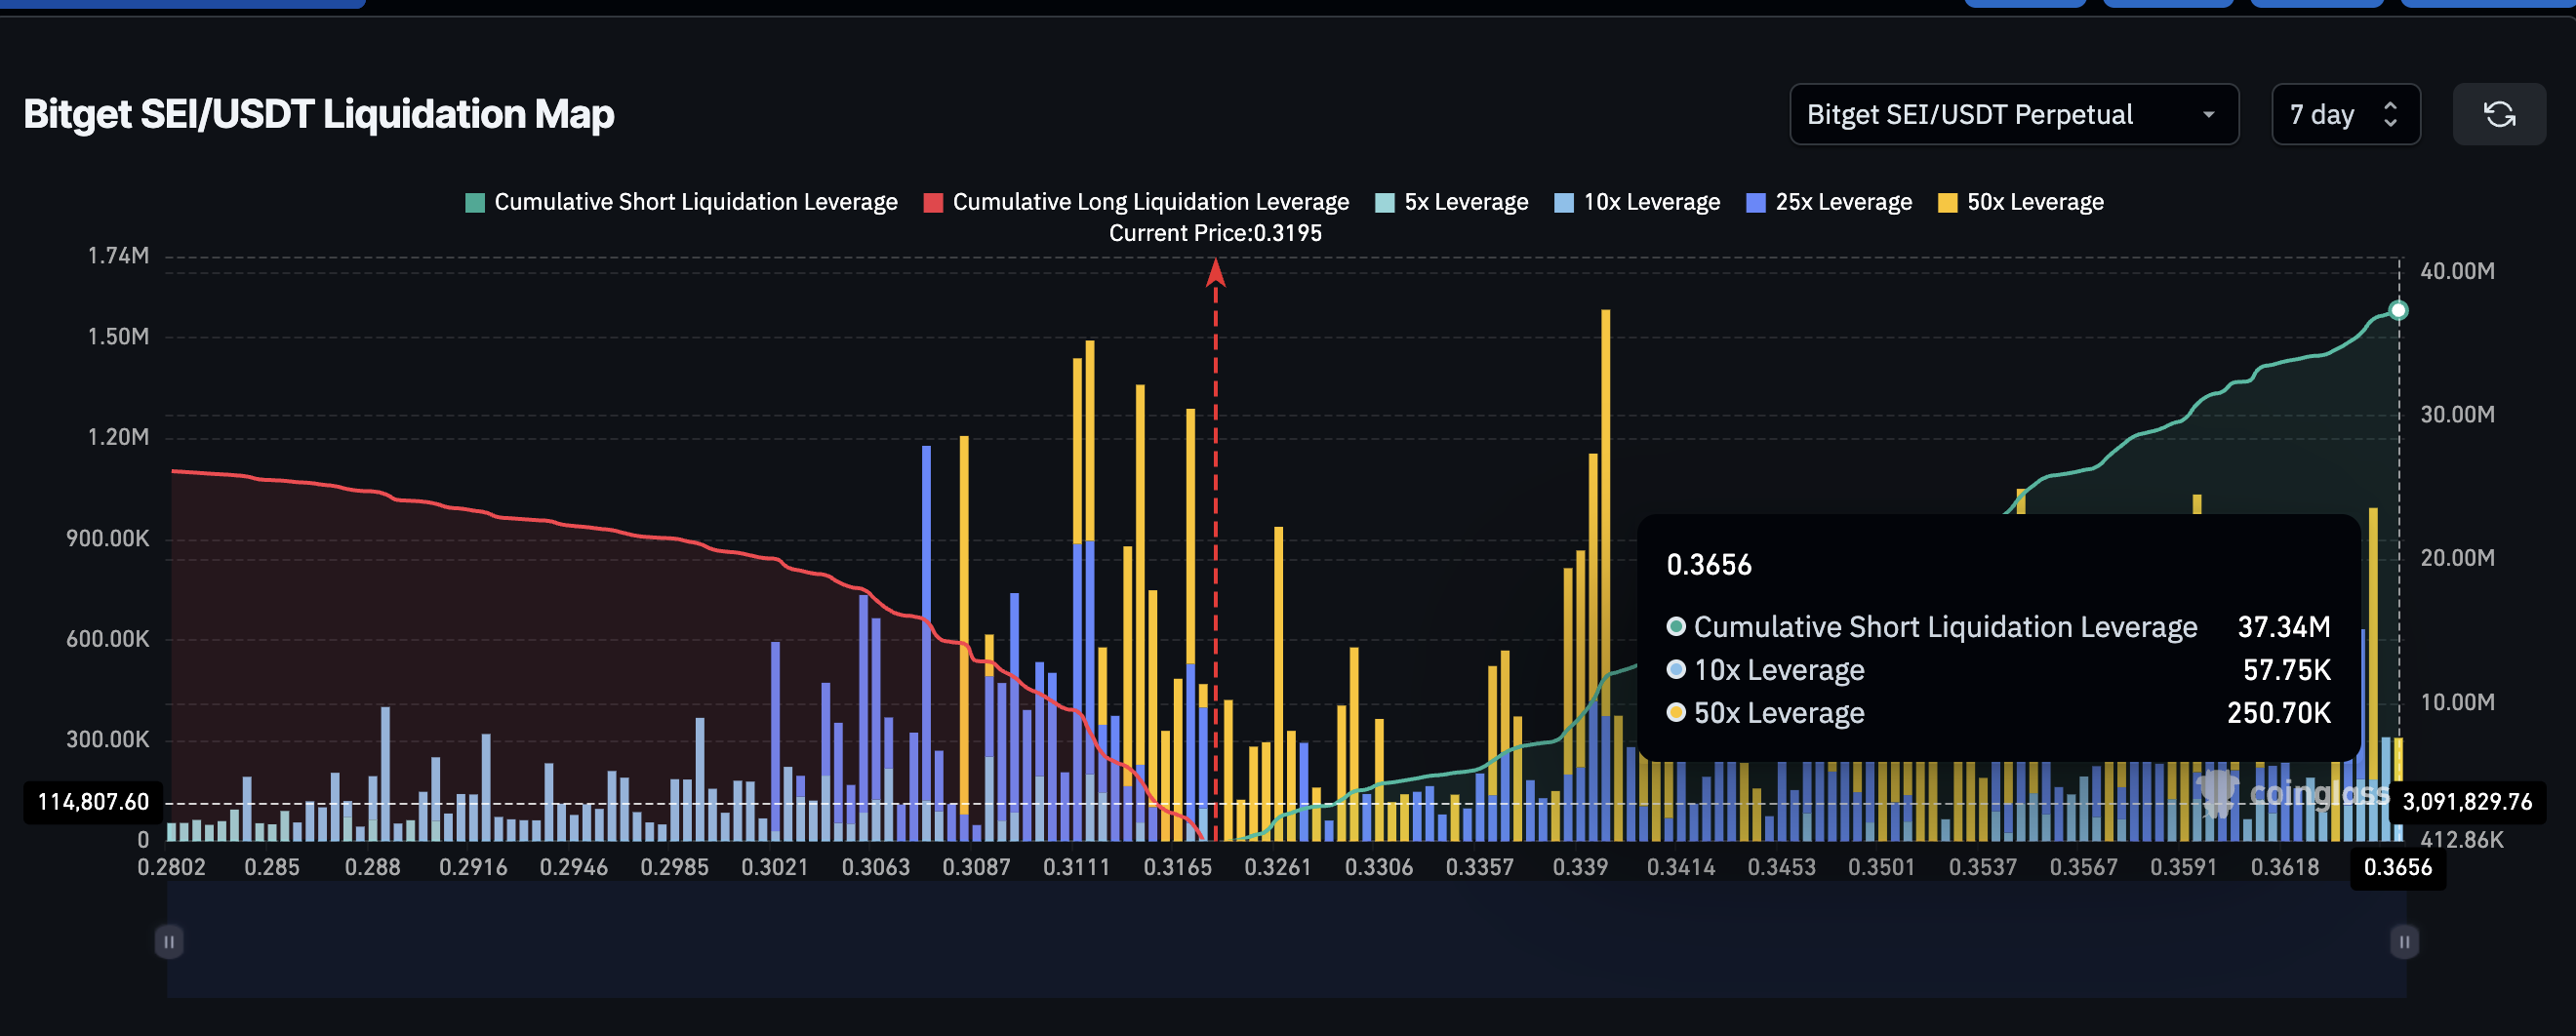
The liquidation map shows many short trades are stacked between $0.32 and $0.36. If the bullish crossover triggers a rapid price increase, these short positions could face cascading liquidations, potentially driving SEI higher in a short squeeze.
A short squeeze occurs when traders who bet against the token must buy back at higher prices, further driving up the price.
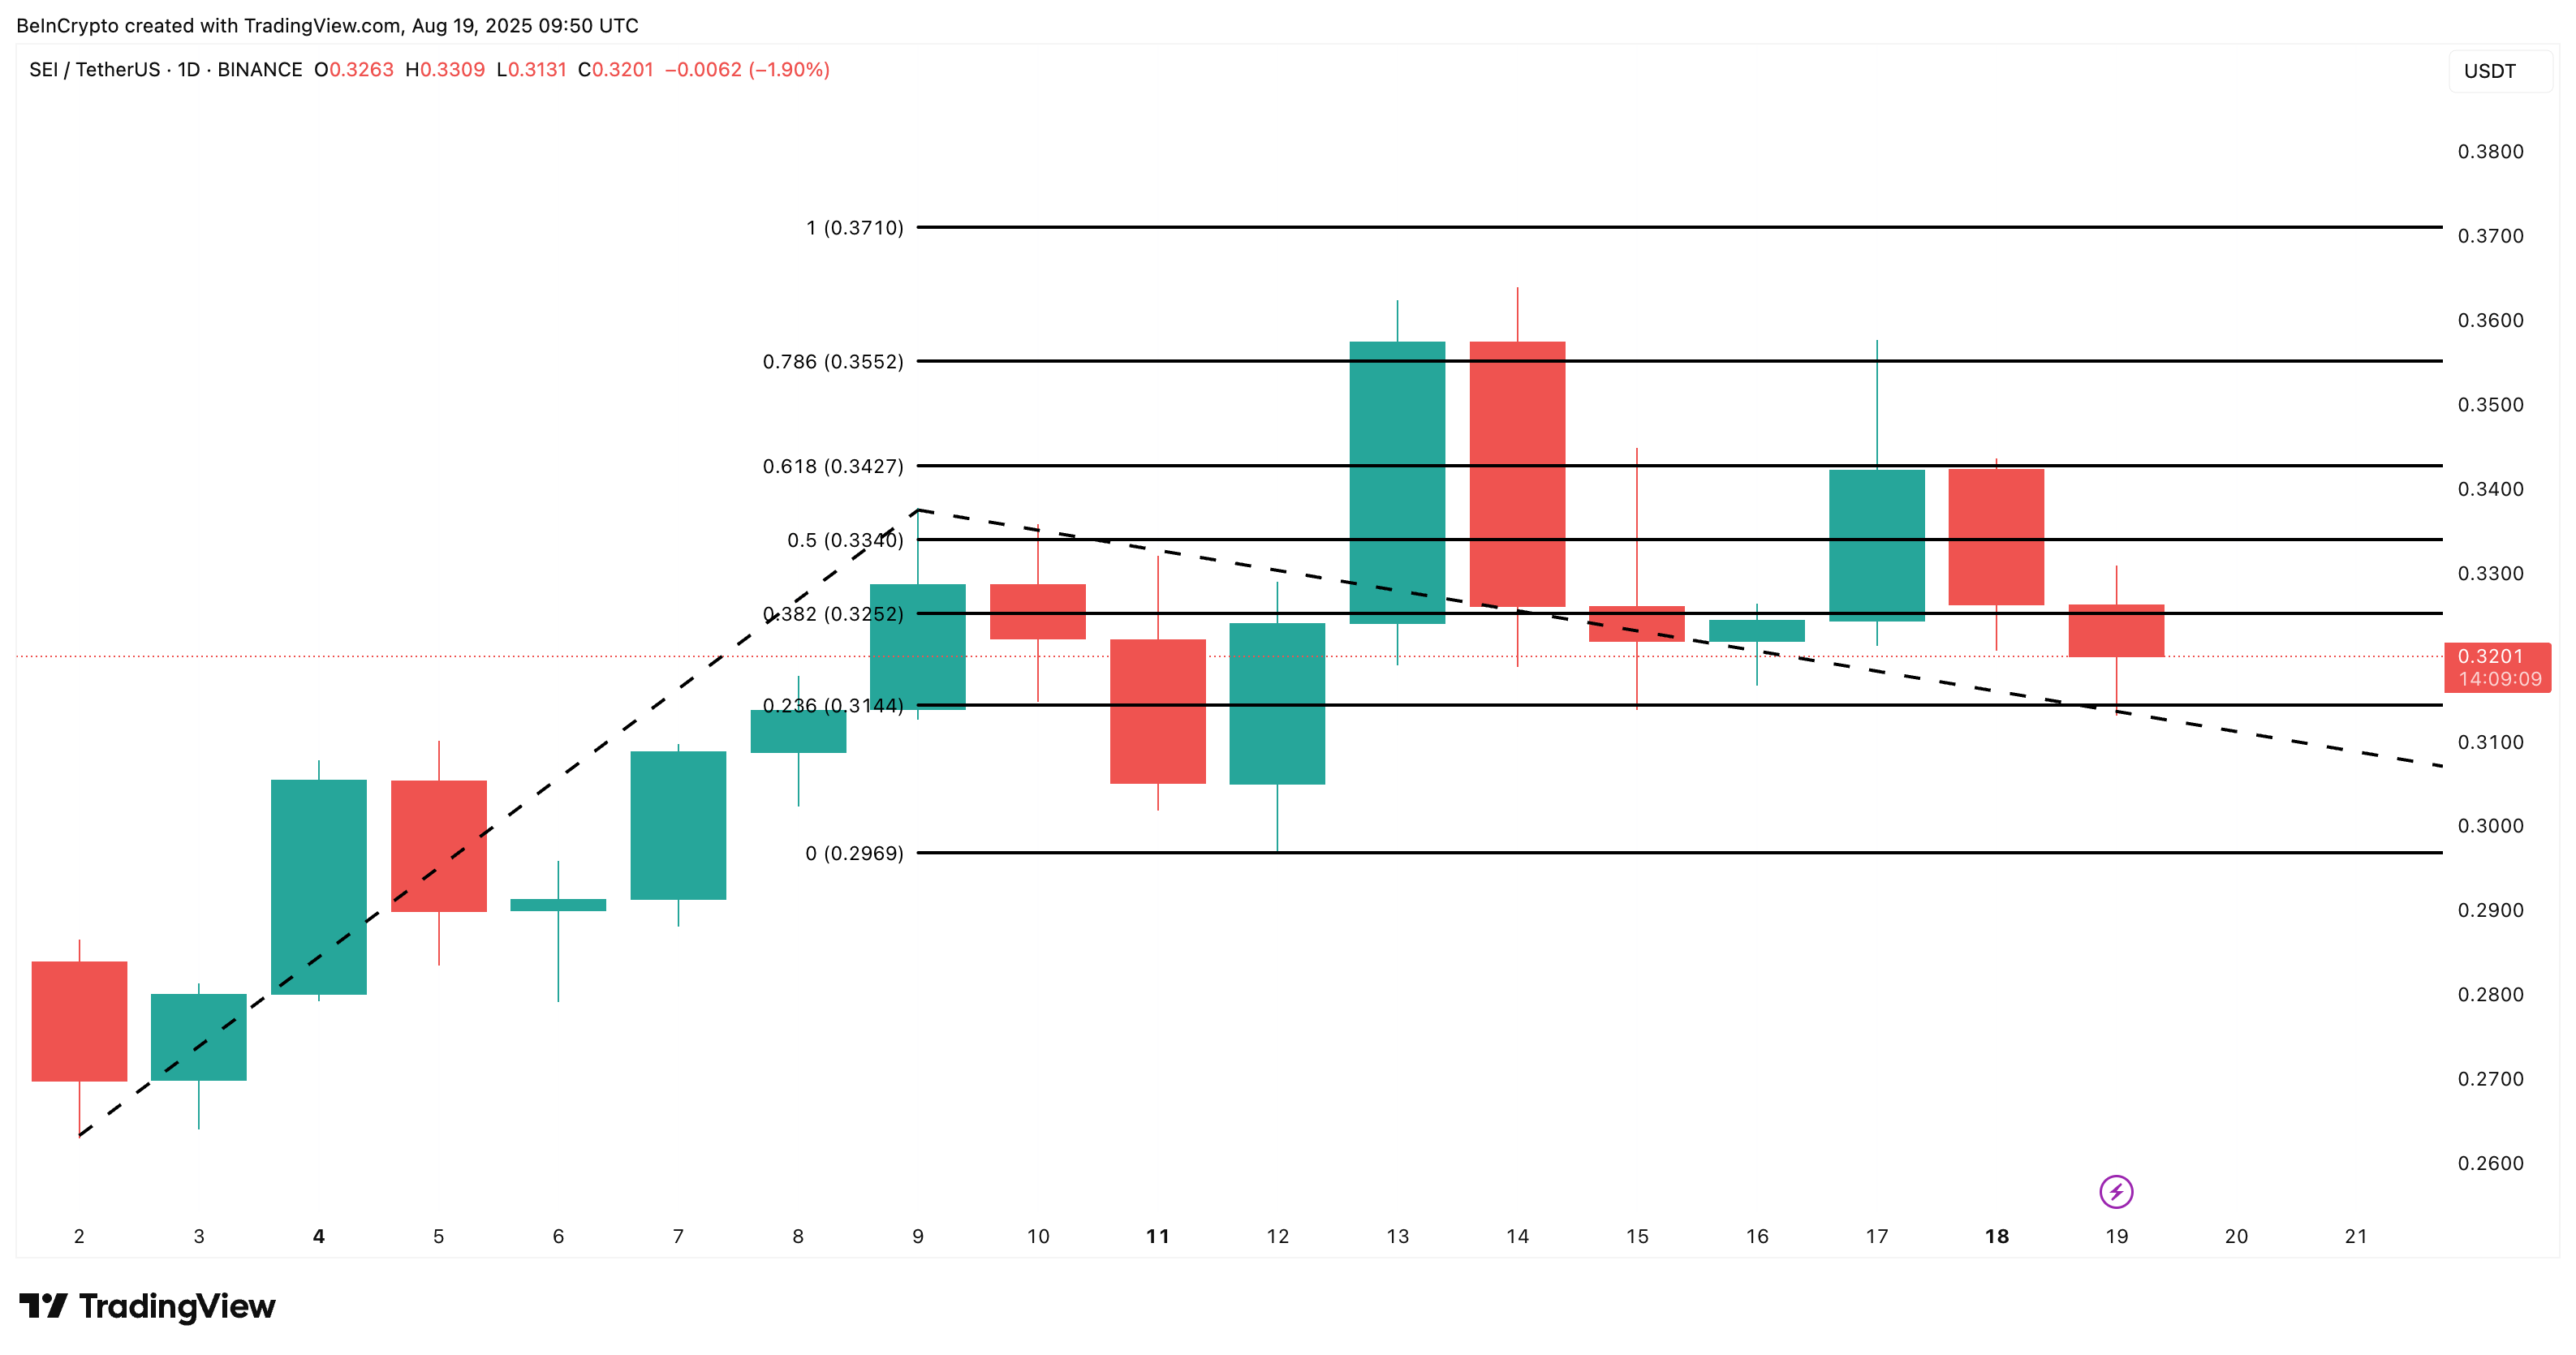
SEI Price Must Break $0.35 to Open $0.37 Potential
SEI is currently trading near $0.32, above the local support at $0.31. This range has acted as a consistent buy zone for bulls. To confirm the rally's continuation, SEI must clearly break through $0.35, which has been rejected multiple times.
If this level is overturned, $0.37 is likely to become the next resistance level.
Considering the macro momentum, bullish EMA, and consistent exchange outflows, the price structure remains tilted towards an upward trend. However, if $0.35 is not overturned, trapped short positions might temporarily catch their breath, allowing bulls to buy again.
Additionally, if SEI price drops below $0.31 and tests $0.29, the short-term bullish trend might not be maintained.


