

The price of Shiba Inu has not significantly changed over the past 24 hours. At the time of reporting, it dropped by 0.6%, which largely aligns with the overall decline in the meme coin market. However, looking at the bigger picture, the situation worsens.
SHIB has fallen by more than 17% over the past 30 days. Against this backdrop, decline signals are emerging quickly. However, there is one powerful signal that could change the mood.
Active Addresses Approaching Monthly Lows
The first warning signal comes from the network itself. The daily number of active SHIB addresses has been steadily decreasing and is now approaching monthly lows. This indicator is at 3,148, just above the monthly low of 3,130.
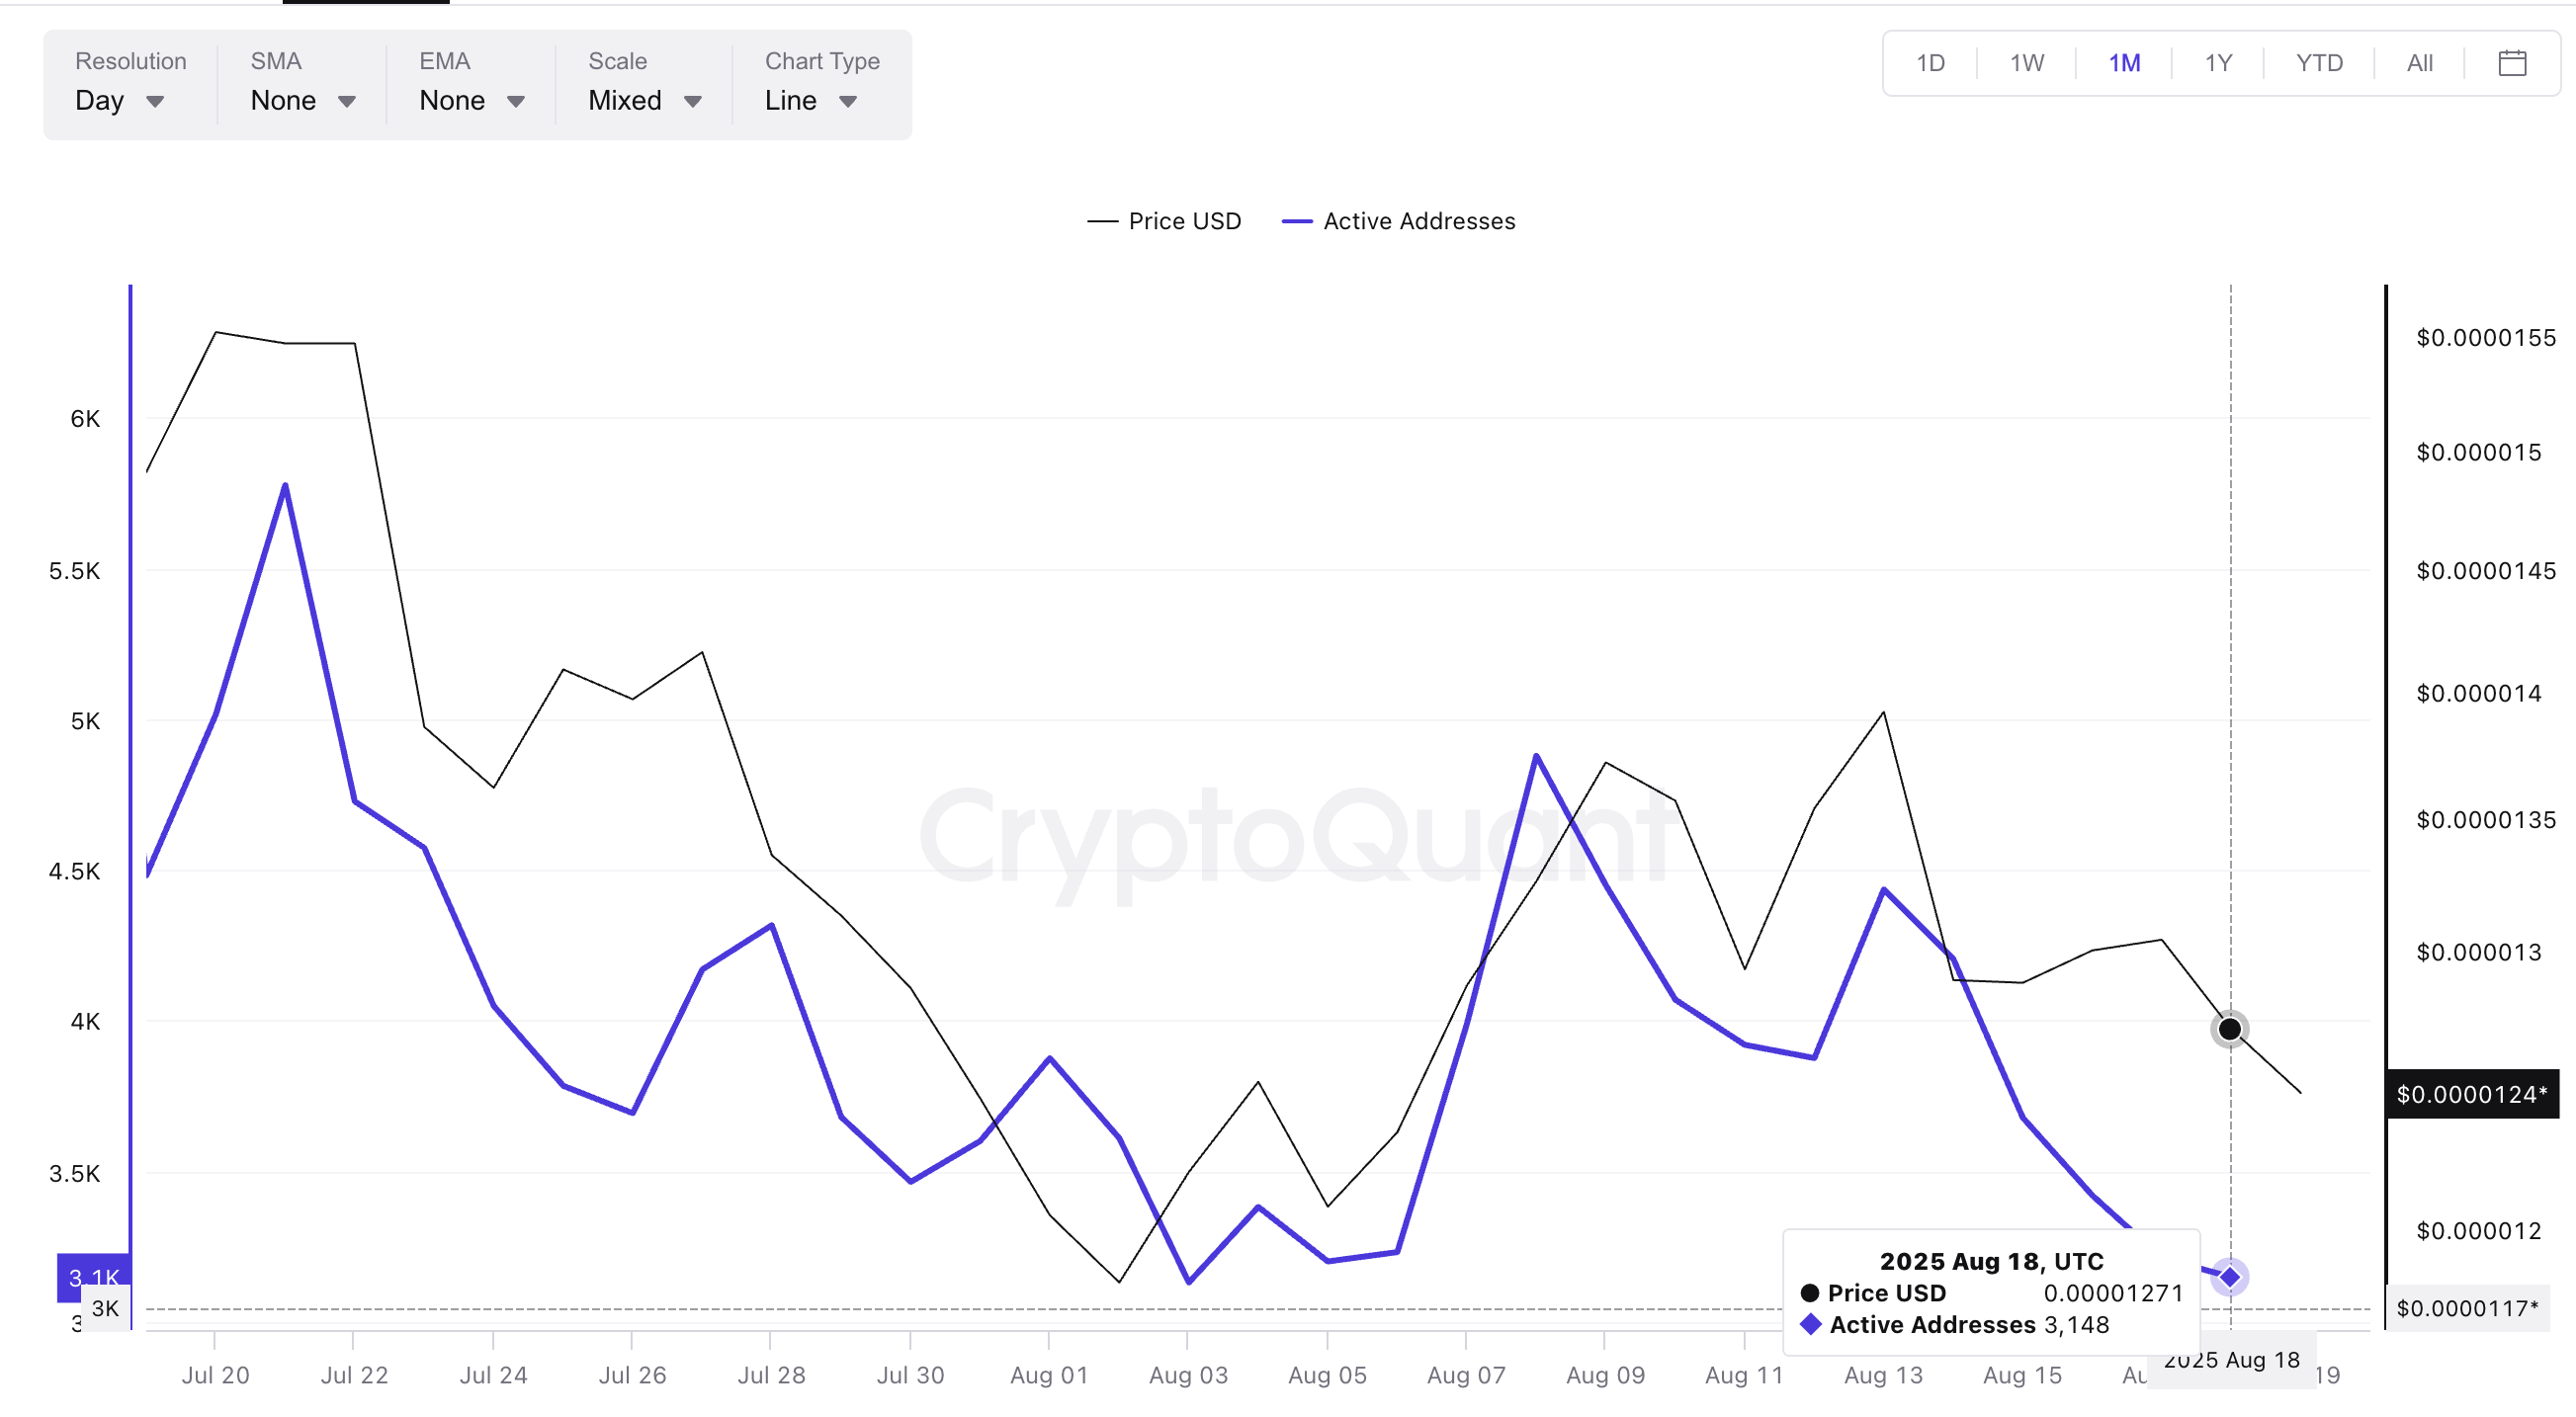
This is important because previously, price increases followed whenever the number of active addresses surged. From August 6th to 8th, the number of addresses spiked, and the SHIB price almost immediately responded.
Though minimal on paper, this activity decrease aligns with the downward trend. The Bull-Bear Power (BBP) indicator shows increasing selling pressure, indicating that bears are slowly gaining control of the Shiba Inu price momentum.
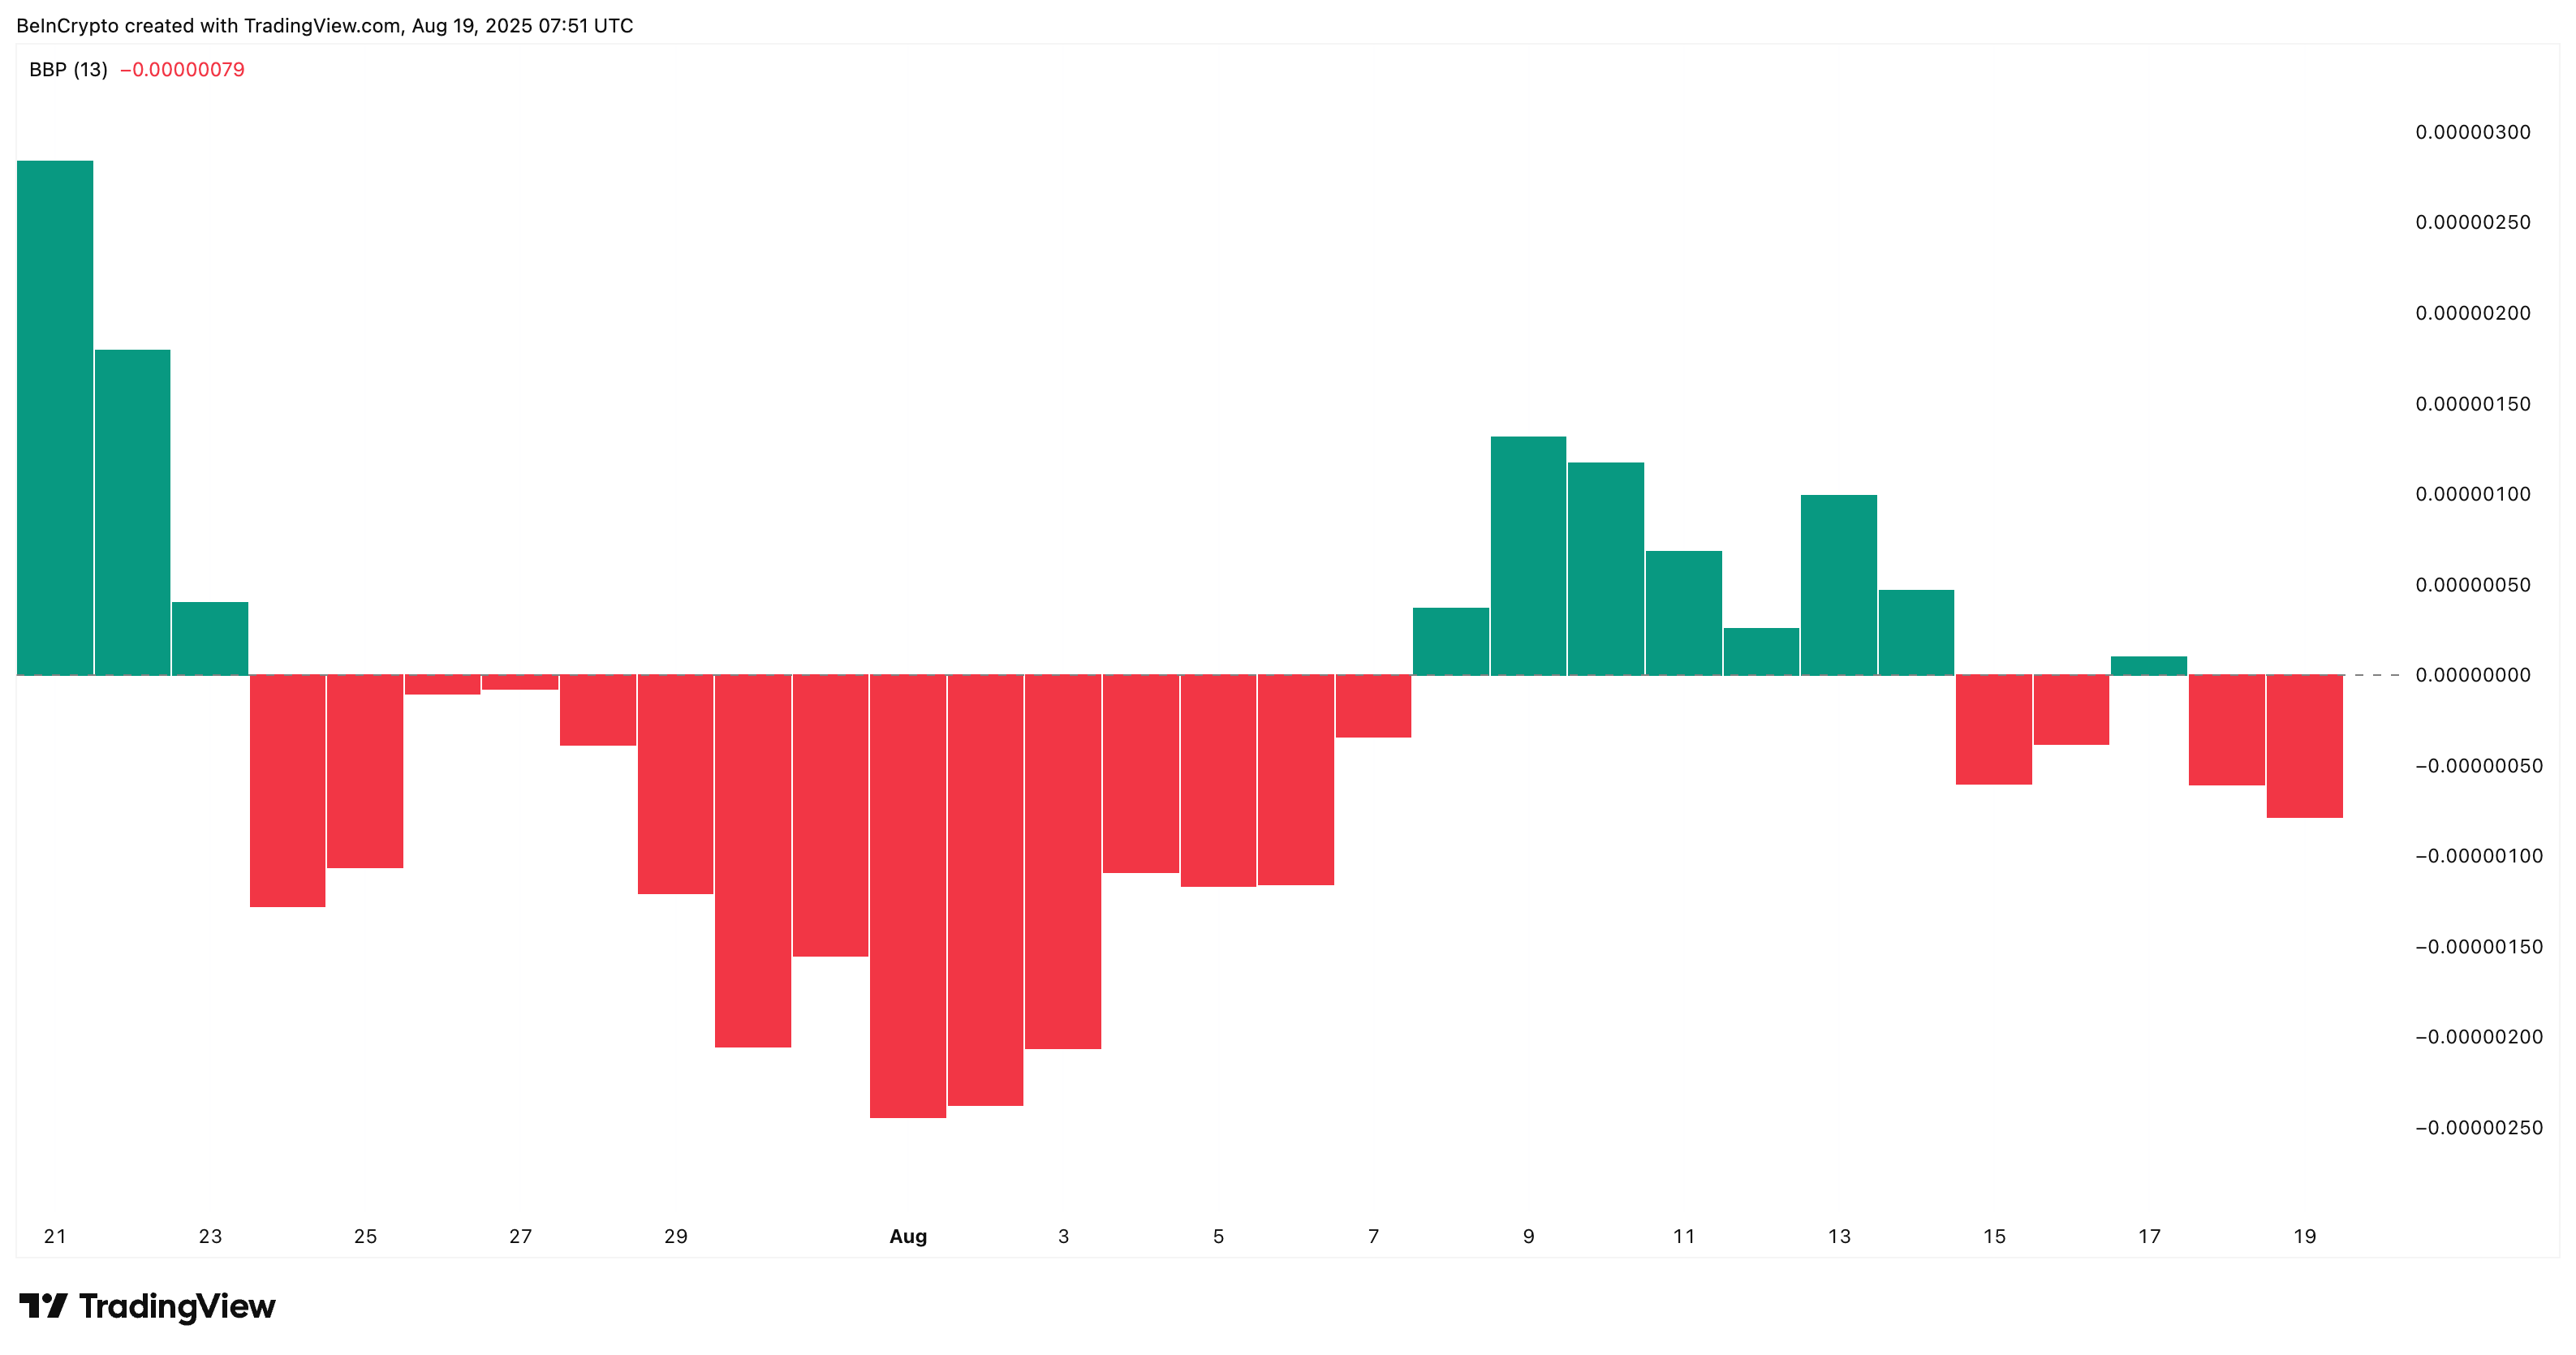
The Bull-Bear Power (BBP) indicator measures the difference between daily highs/lows and moving averages to assess who is currently controlling price movements.
Token TA and Market Update: Want more such token insights? Subscribe to editor Harsh Notariya's daily crypto newsletter here.
Major Buyers Establishing a Bottom?
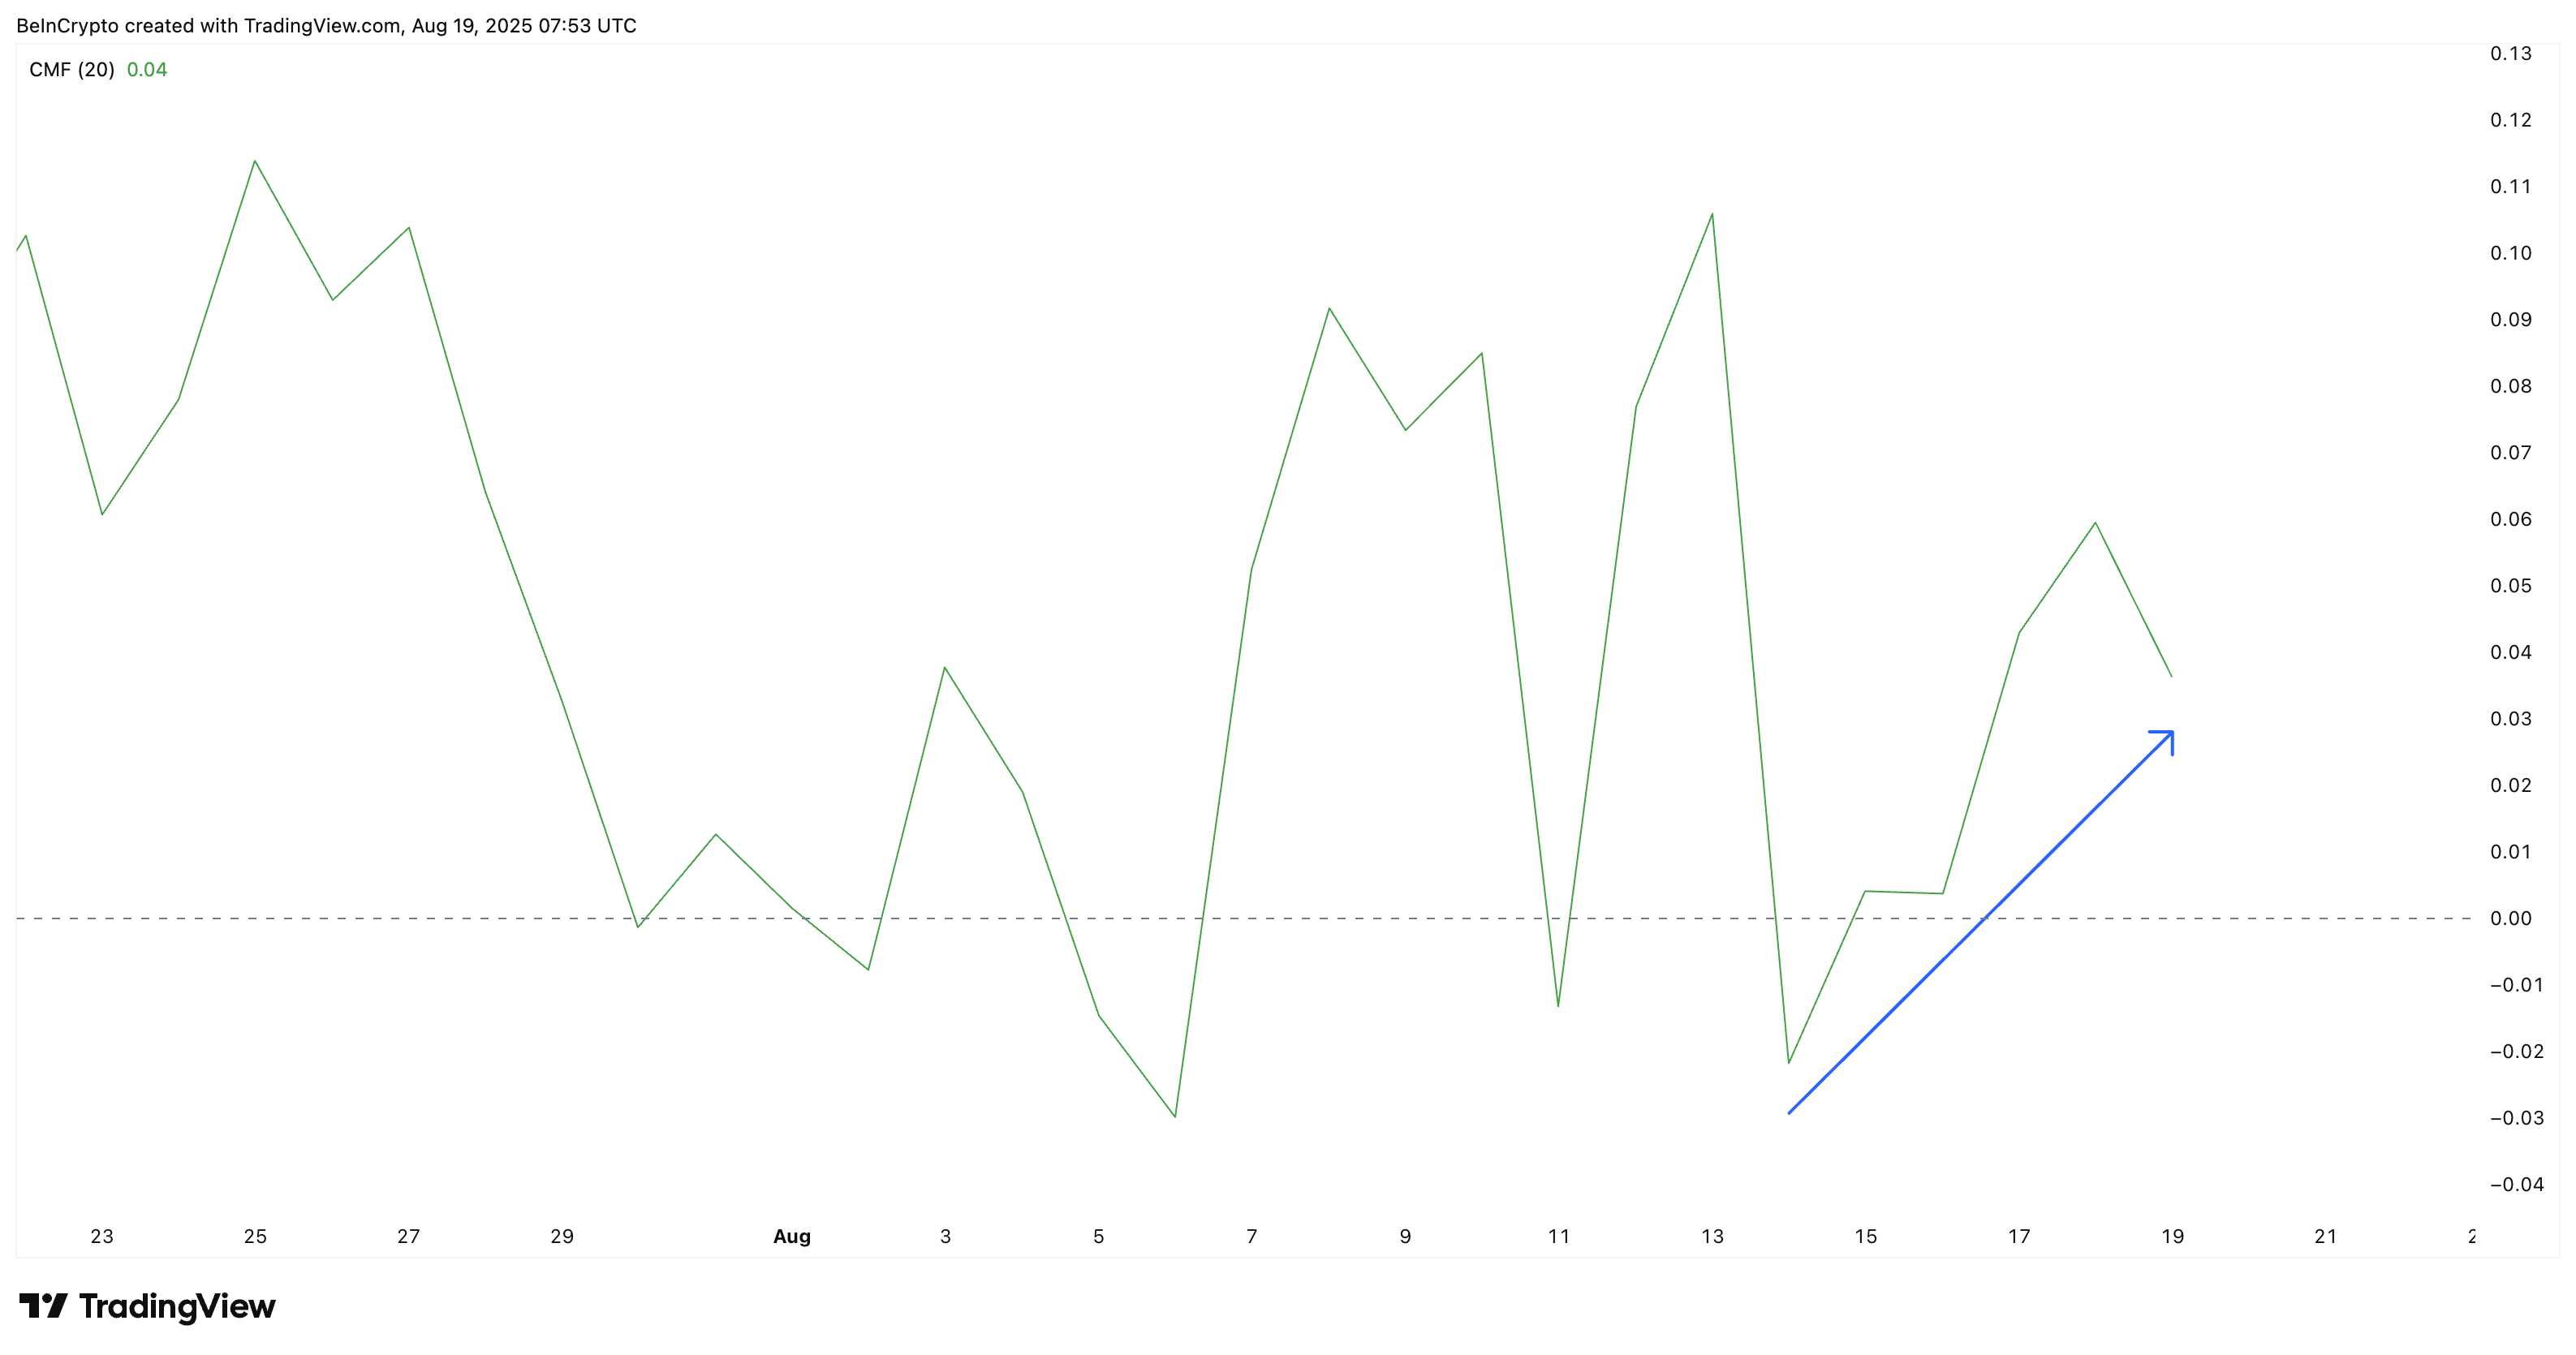
Despite weak activity and increasing downward momentum, one indicator does not align. The Chaikin Money Flow (CMF) remains above the zero line, indicating net capital inflows into SHIB. This typically occurs when major players are buying while others are leaving.
From a technical perspective, the CMF forming higher lows suggests increasing fund inflows into the asset.
Digging deeper, this aligns with the behavior of the top 100 wallets. These wallets have recently accumulated trillions of SHIB and have been holding nearly 21 trillion SHIB over 90 days.
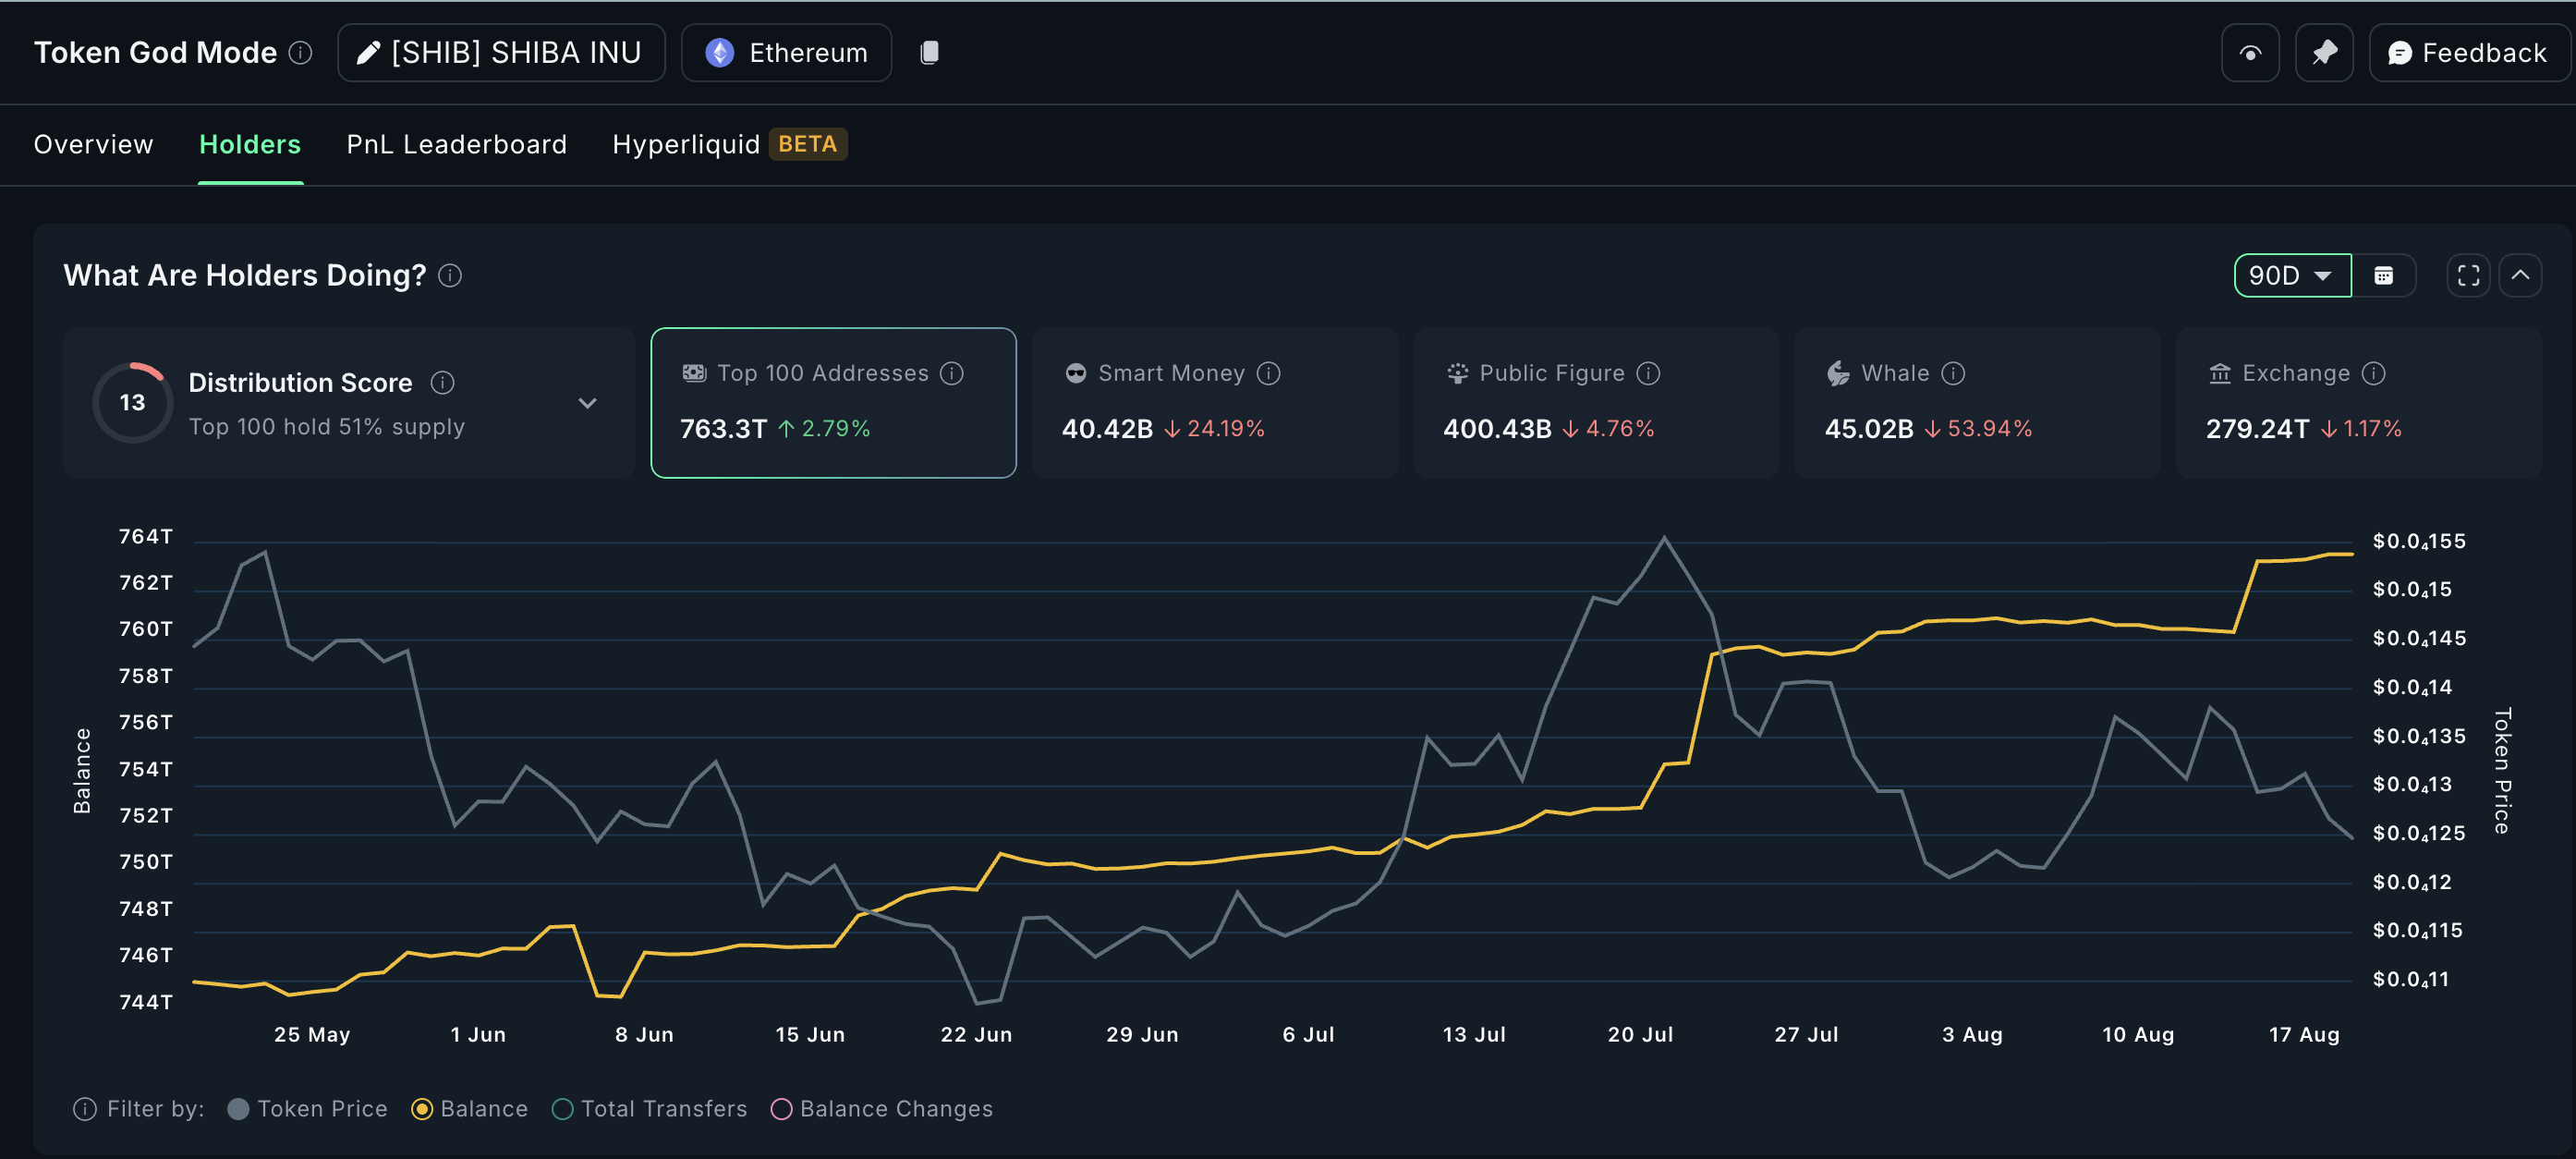
While smart money and whales have reduced positions, the top 100 addresses have added much more. The CMF's rise appears to reflect these inflows.
The CMF combines price and volume to show buying or selling pressure. Above 0 indicates accumulation, below 0 indicates distribution.
Death Cross Suggests Further Shiba Inu Price Decline
The SHIB chart displays a clear technical warning. On the daily timeframe, the 20-day EMA (exponential moving average) or red line has crossed below the 50-day EMA (orange line). Such a downward cross typically precedes a sharp correction.
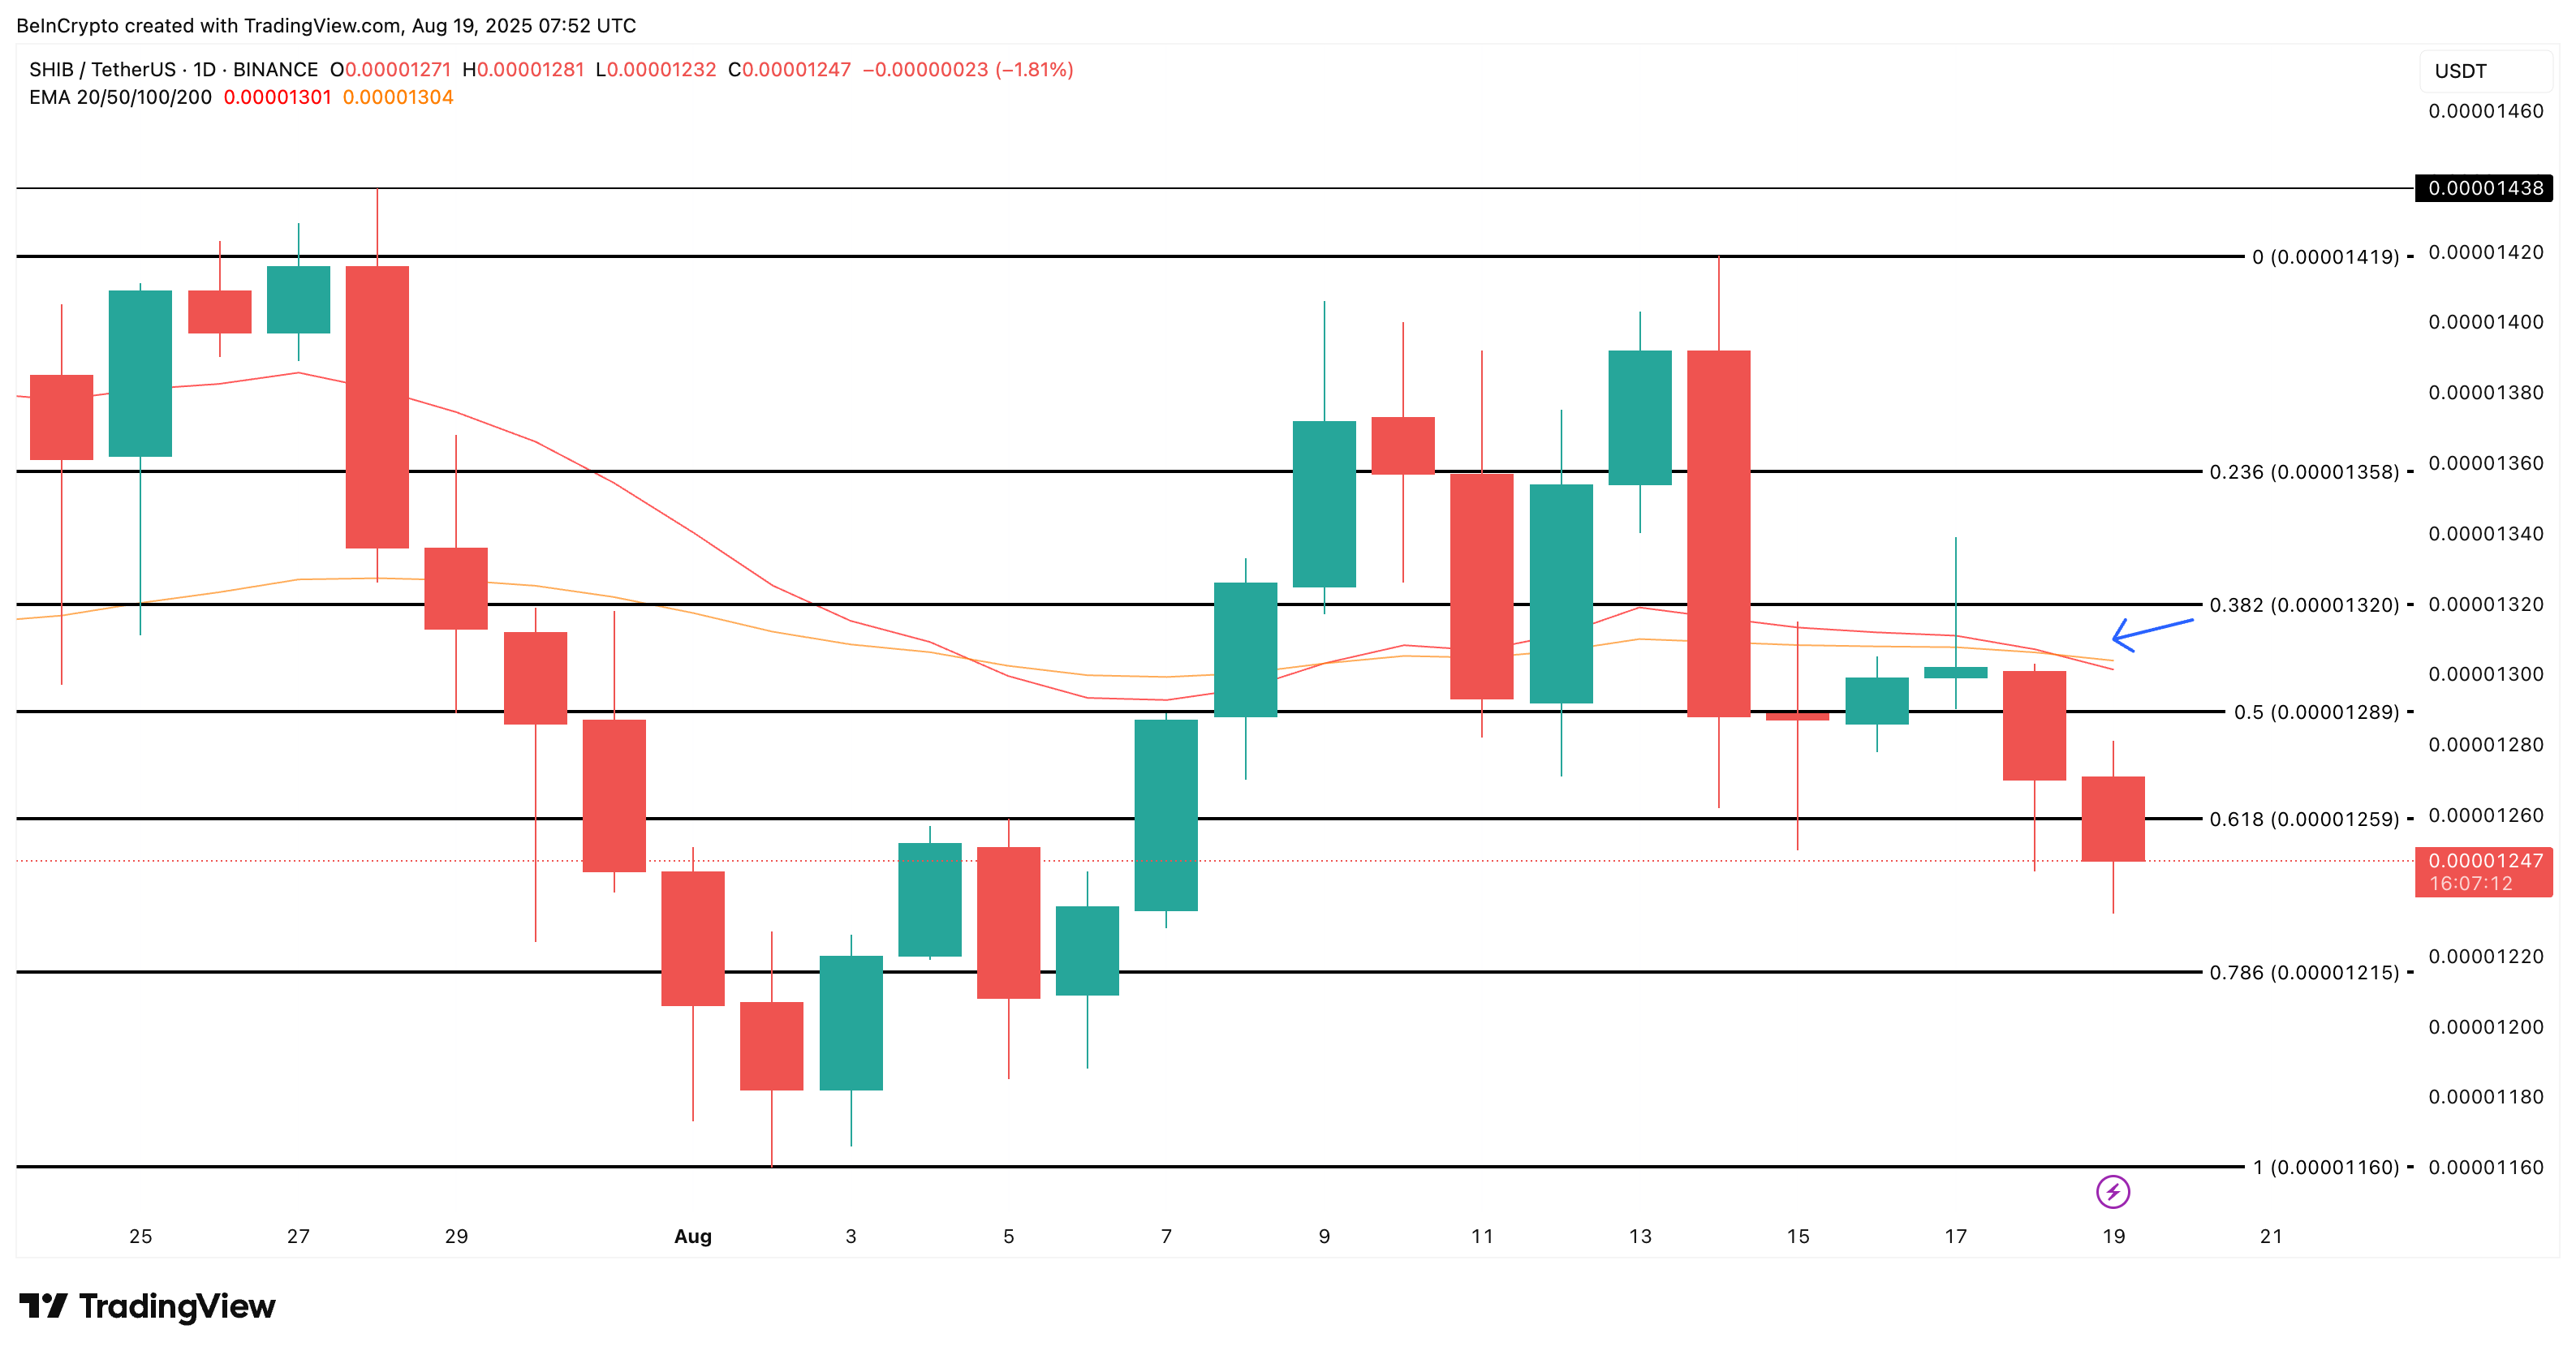
Simultaneously, the price has fallen below the $0.00001259 support line and is currently trading near $0.00001247. If selling continues, the next price floor appears to be around $0.00001215. If this level breaks, $0.00001160 becomes a likely target, potentially intensifying the 30-day correction.
This downward outlook can only be invalidated by clearly breaking through $0.00001320. This level would reverse the moving averages and restore short-term momentum. However, until then, the risk of decline remains dominant.


