API3 is a decentralized oracle solution that enables access to real-world data through blockchain APIs. Over the past 7 days, the token price has surged by almost 90%, exceeding $1.80.
However, it has dropped by nearly 10% in the last 24 hours, causing confusion among traders. Is this the beginning of a deeper correction, or a short adjustment before a larger rise?
Increase in Short Positions... Funding Rate Decline
Over the past 24 hours, API3's funding rate has significantly turned negative. On August 19, the open interest weighted funding rate was -0.47%. On August 20, it further declined to -1.10%. This means most traders are paying costs to maintain short positions, betting on price decline.
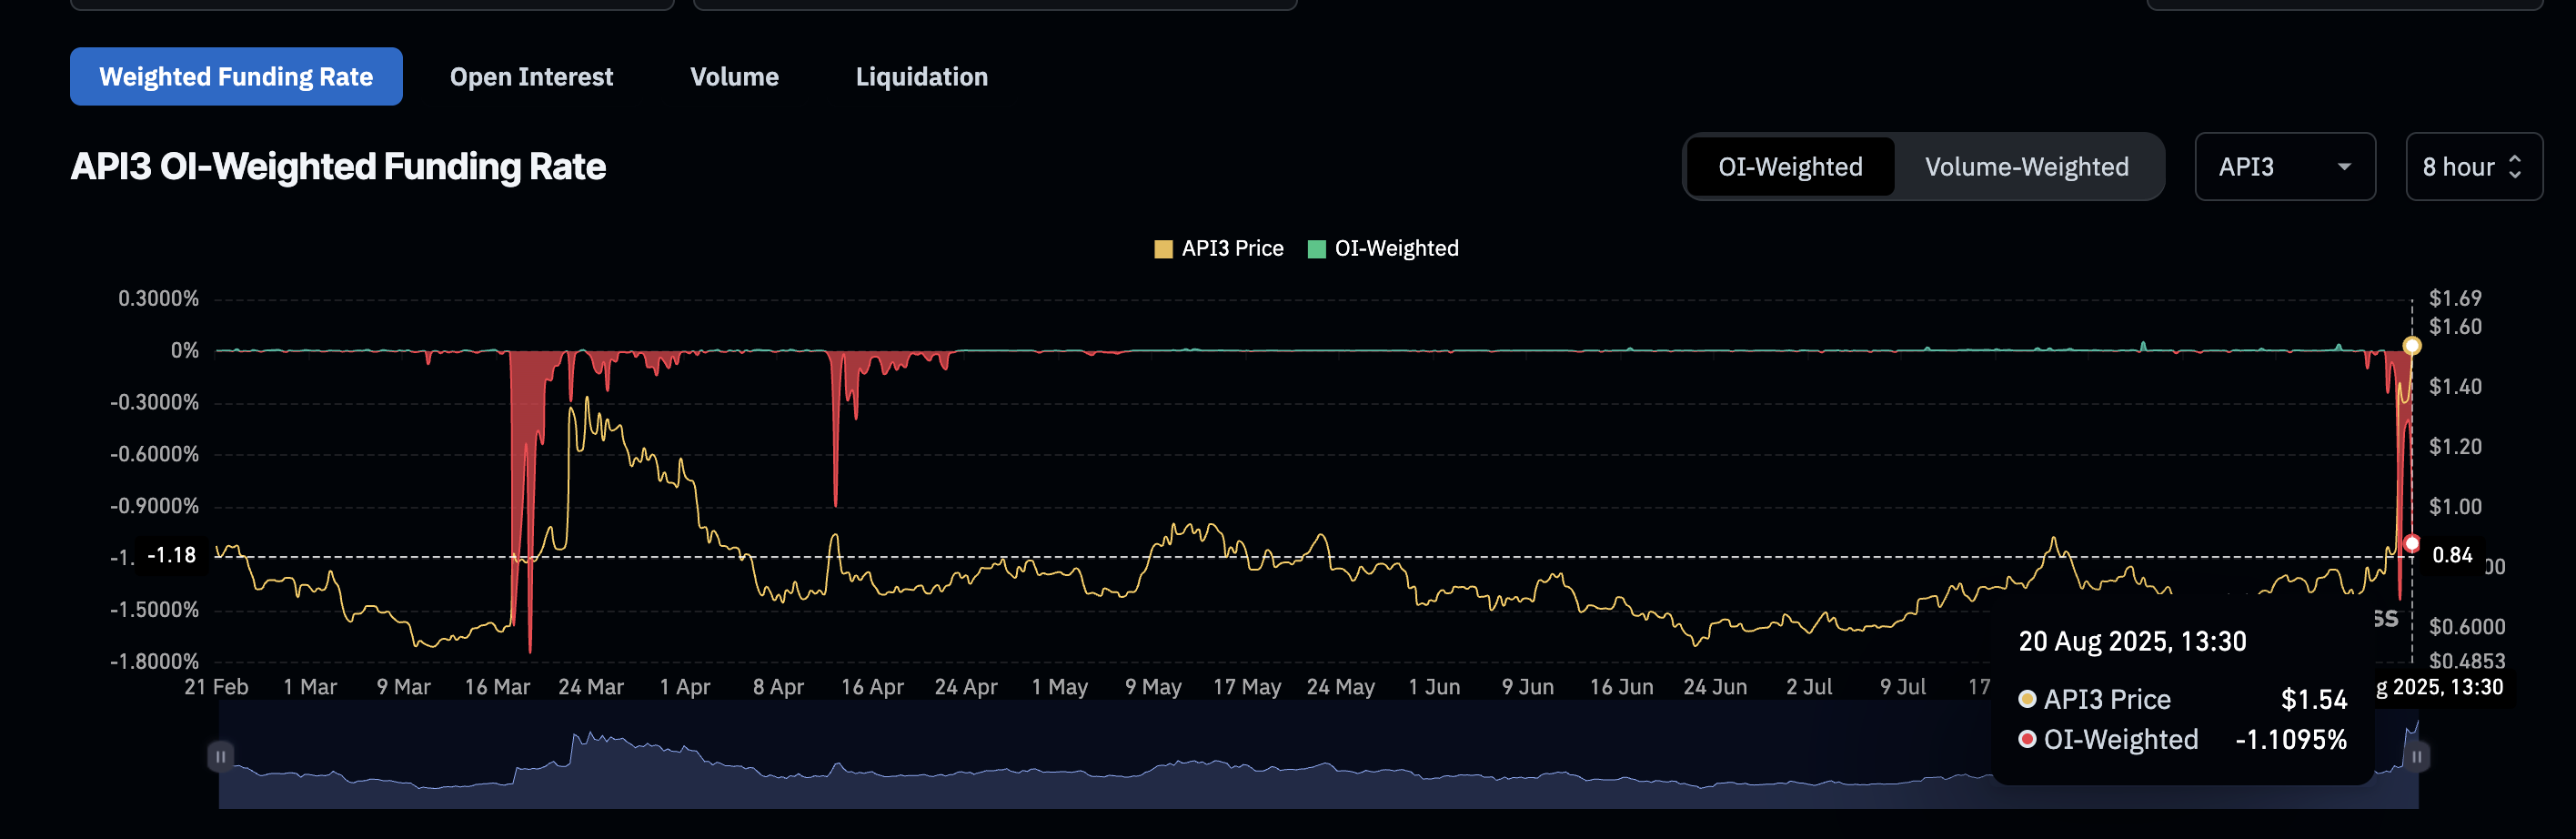
This shows an aggressive short-side sentiment. However, the API3 price has not collapsed. Slightly down from its peak, API3 buyers have not completely retreated. Therefore, while selling pressure is building, at the time of reporting, sellers have not gained control.
Token Technical Analysis and Market Update: Want more such token insights? Subscribe to editor Harsh Notariya's daily crypto newsletter here.
Smart Money Buying... CMF and Exchange Data Strength
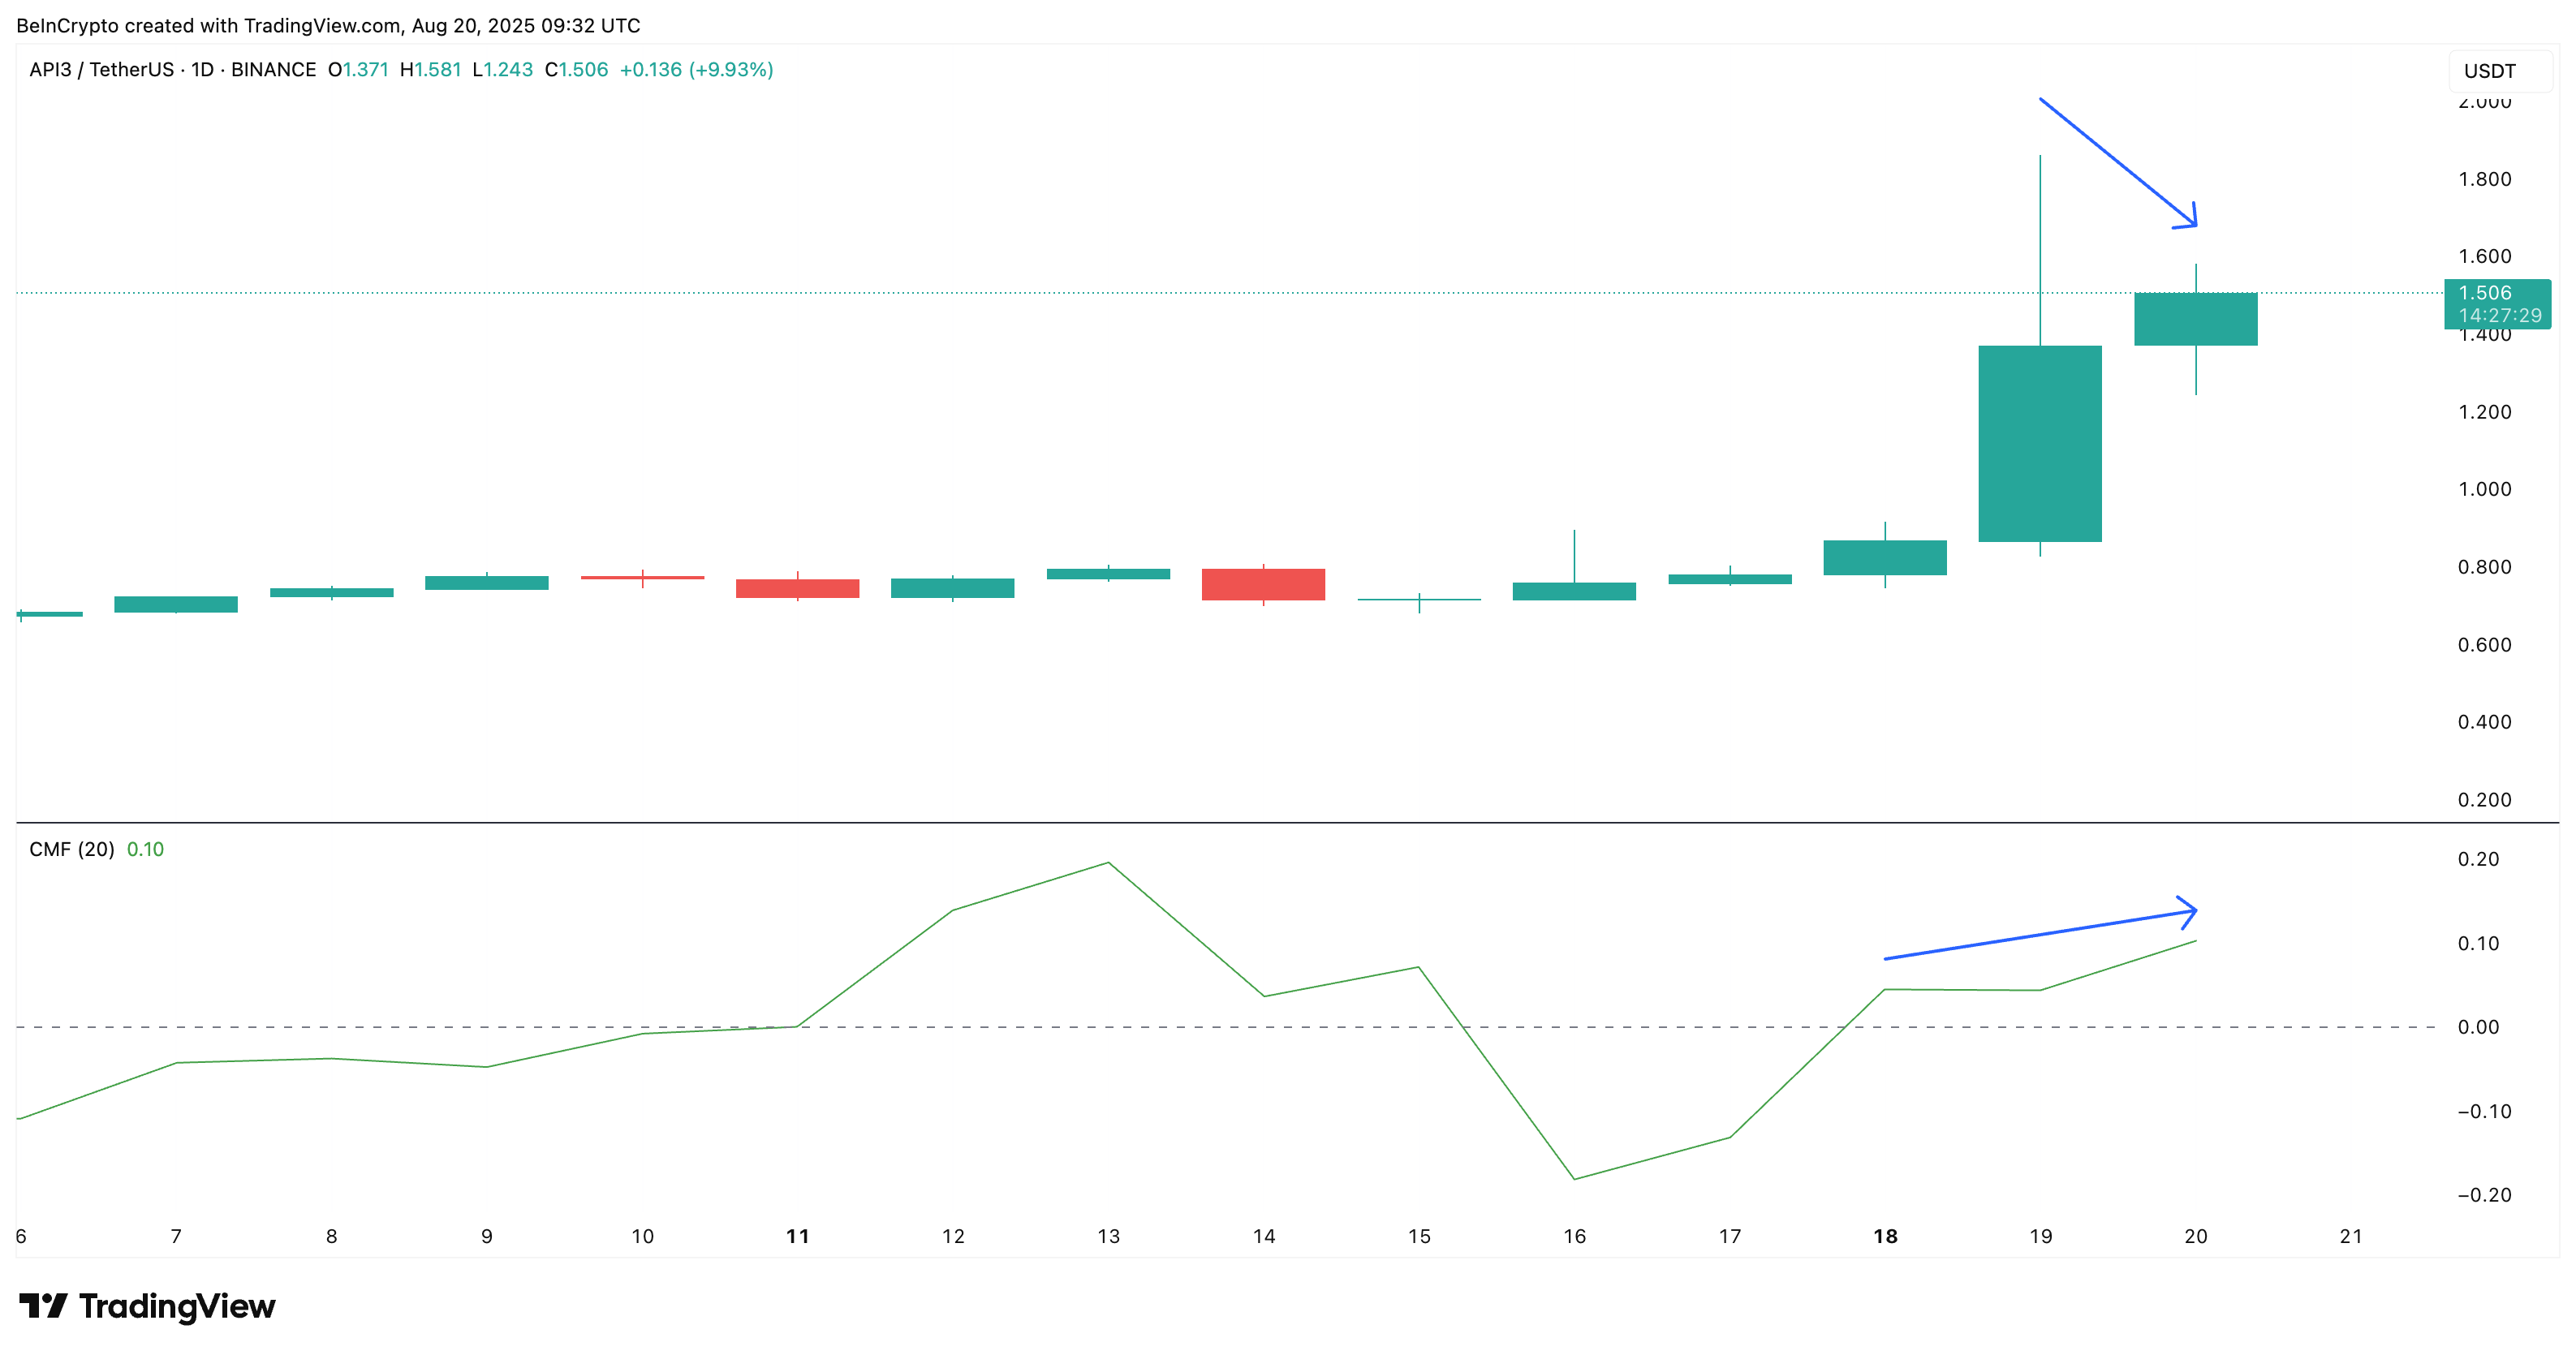
Internally, buyers are still engaged. On the daily chart, Chaikin Money Flow (CMF) has steadily risen from 0.04 to 0.10 over the past few hours. This indicates capital inflow despite a slight API3 price adjustment.
CMF is a volume-weighted indicator showing whether funds are flowing into or out of a token based on price and volume.
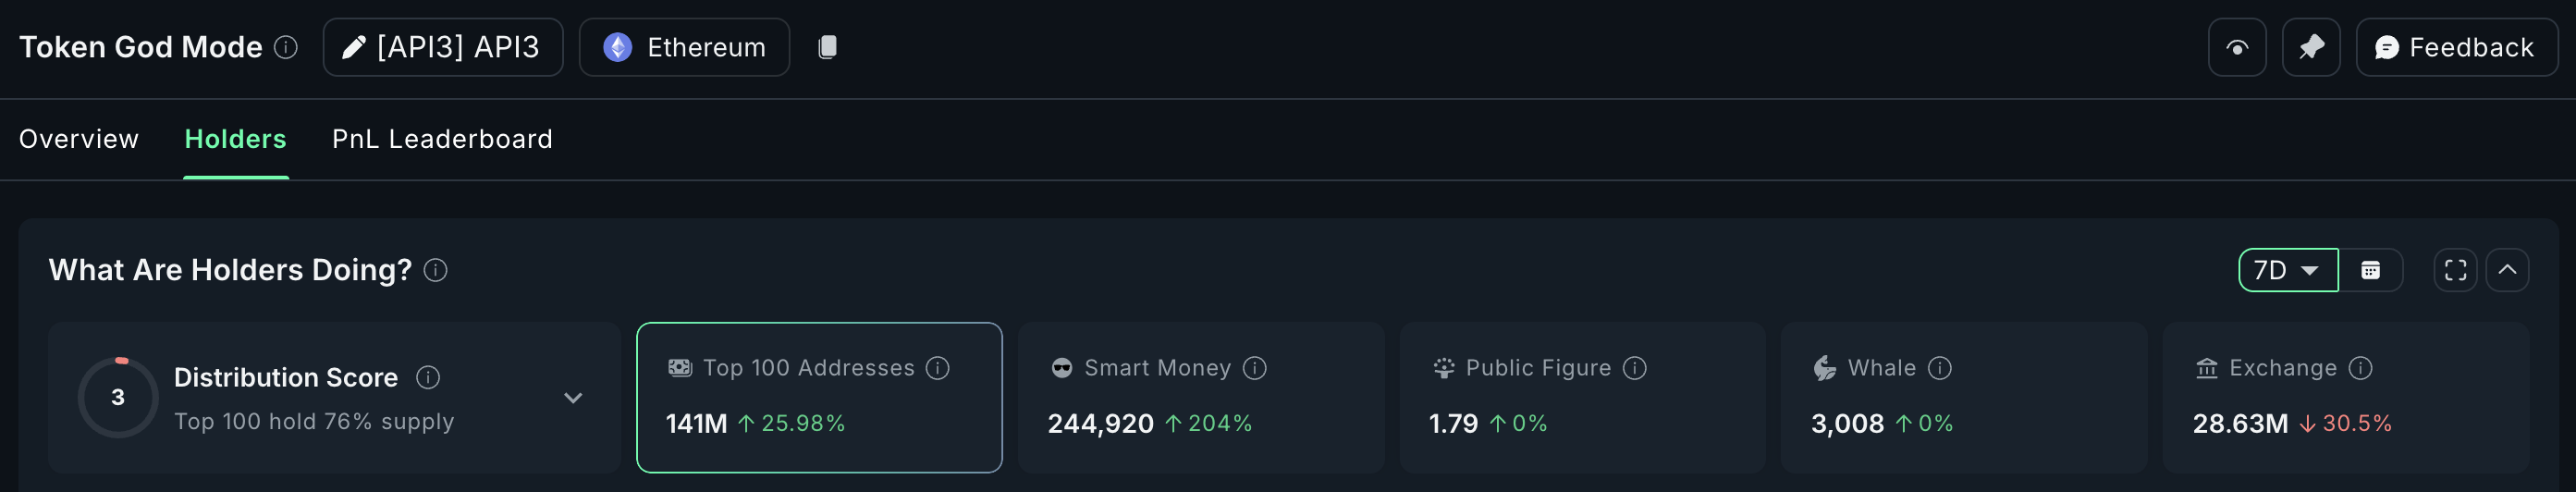
Exchange holdings also confirm this. Over the past 7 days (during the rise), API3's exchange balance decreased by 30.5%, currently at 28.63 million tokens.
Simultaneously, the top 100 addresses increased holdings by 25.98%, and smart money wallets increased by 204%.
API3 Price Chart, Bullish Bias
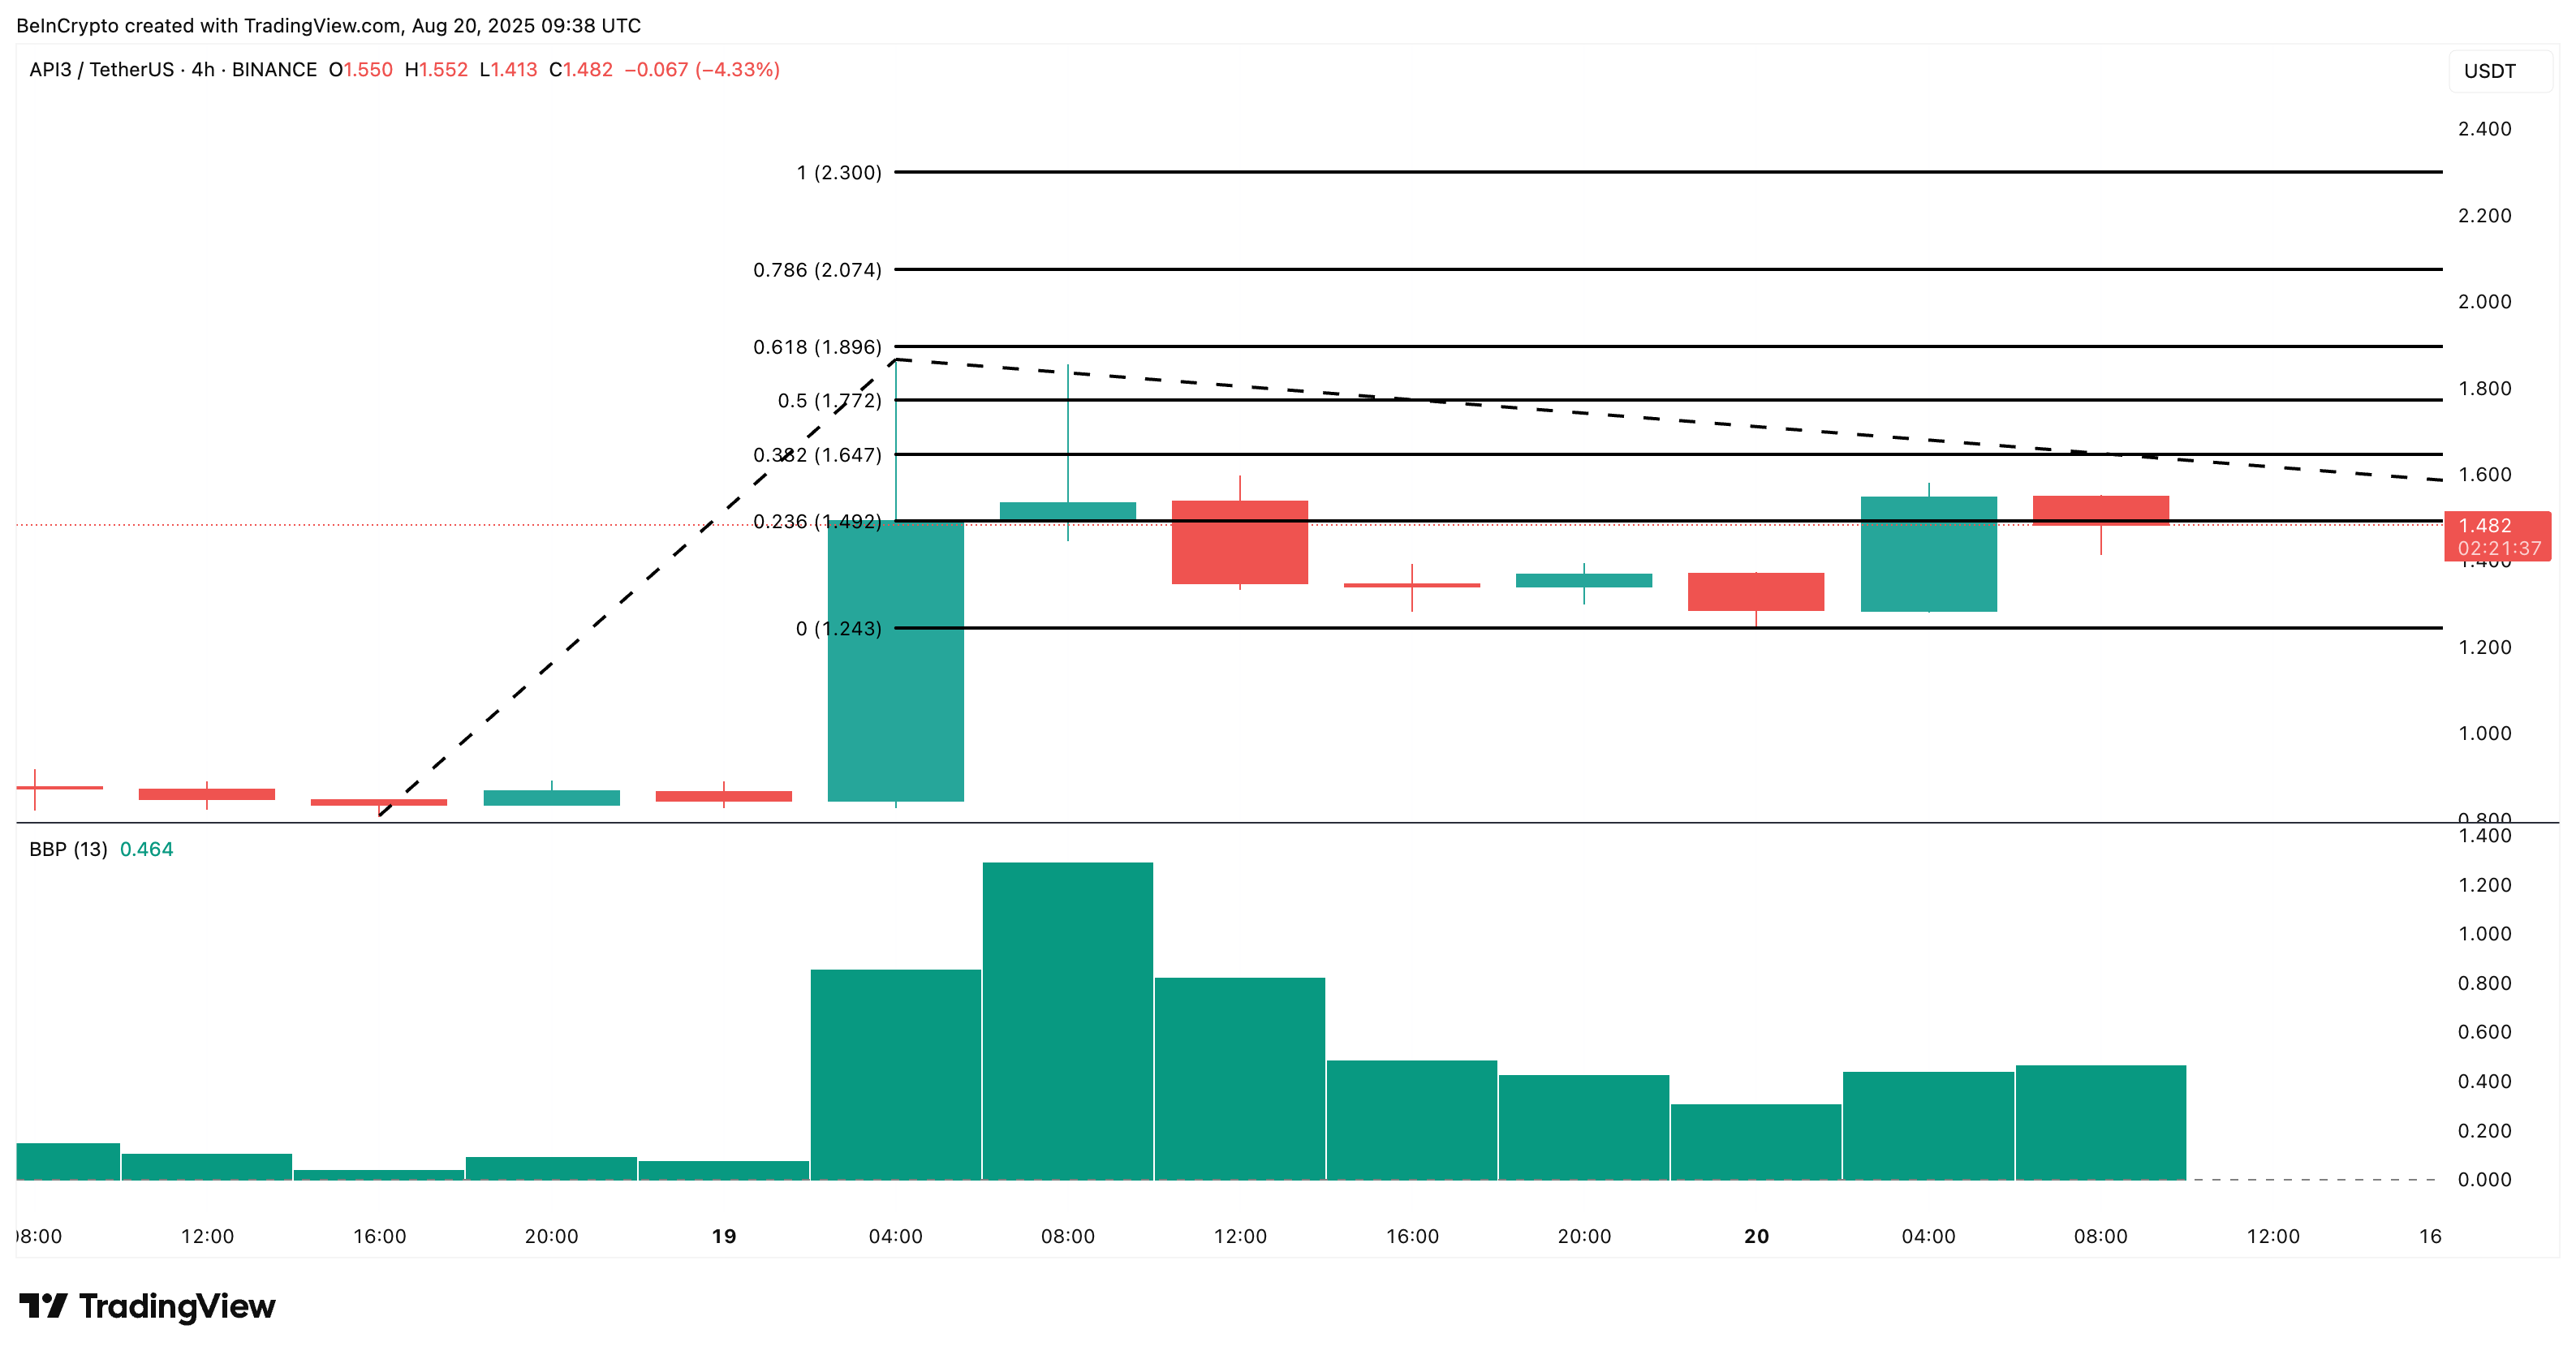
On the 4-hour chart, API3 continues to show bullish momentum. The price rebounded near the 0.236 Fibonacci level around $1.49, and the Bull-Bear Power (BBP) index is positive at 0.464.
This suggests buyers are not done yet, and if buying continues, short positions or selling bets could be quickly liquidated. This will push the price higher, with immediate targets at $1.64 and $1.77.
Bullish momentum appears to be increasing with green bars, making the sustainability of the API3 price rally seem more likely. The BBP indicator measures the strength of buyers and sellers by comparing highs and lows with moving averages.
However, if the price drops below $1.24 and buyers retreat, the same short positions could win, potentially invalidating the bullish outlook. Long positions will be exposed, and liquidations could quickly intensify the decline.