Bitcoin is trading near $111,000 and testing key support levels between $107,000 and $108,900. A rebound to $113,600 could face continued selling pressure, while a deeper decline could target $93,000 to $95,000. Losses remain shallow, spot demand remains neutral, and perpetual swaps are showing a bearish but mild bias.
VX:TZ7971
Filling the gap
The market entered its second week of retreat from its all-time high of $124,000.
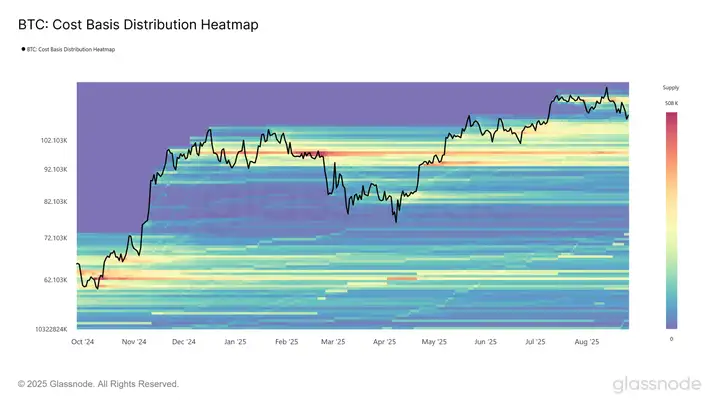
The CBD heatmap provides a visualization of supply concentration at various acquisition prices, highlighting the significant portion of tokens that last changed hands. Each color band reflects areas of concentrated cost basis, which often act as natural support or resistance zones.
Currently trading near $111,000, Bitcoin hovers above the lower edge of a price gap. The latest pullback has allowed for a redistribution of supply at a discount, gradually filling the gap. Notably, a thick supply cluster has formed between $93,000 and $110,000 since December 2024, gradually forming a potential floor.
This accumulation helps explain the current continued resilience above $110,000, suggesting that a further correction would require either significant short-term selling pressure or a longer-term absence of demand sufficient to capitulate these investors into selling.
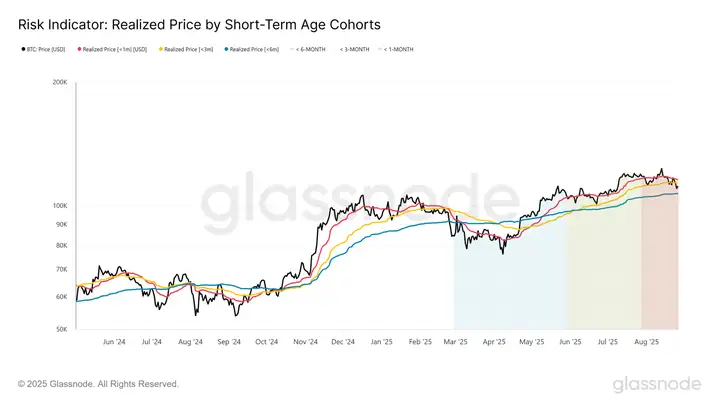
Bitcoin is currently trading below the cost basis for 1-month ($115,600) and 3-month ($113,600) holders, putting these investors under pressure. Therefore, any relief rally is likely to encounter resistance as short-term holders seek to exit at breakeven points.
More critically, the 6-month cost basis is located around $107,000. A sustained break below this level could trigger fear, accelerating downward momentum towards the lower edge of the support supply cluster highlighted in the CBD heat map.
Medium-term risks
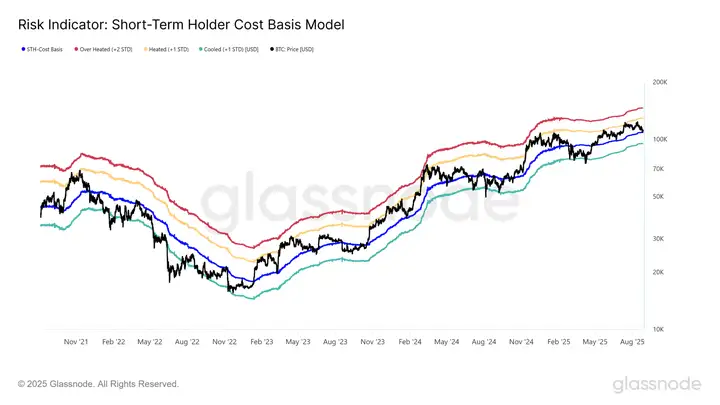
If the current weakness continues and the price sustains below the short-term holders' cost basis near $108,900, history suggests caution. In past cycles, such breakouts have often signaled the start of multi-month bearish phases as new investors sell amidst mounting unrealized losses.
Framing this risk using a four-year statistical band, previous bearish retracements typically concluded with a low approximately one standard deviation below the short-term holder's cost basis. For the current cycle, this lower bound is estimated to be around $95,100. Therefore, if Bitcoin fails to re-establish above the $107,000–$108,900 threshold, a potential mid-term bottom formation could occur in the $93,000–$95,000 region, consistent with the dense support cluster highlighted earlier in the CBD heatmap.
Perpetual contracts are bearish
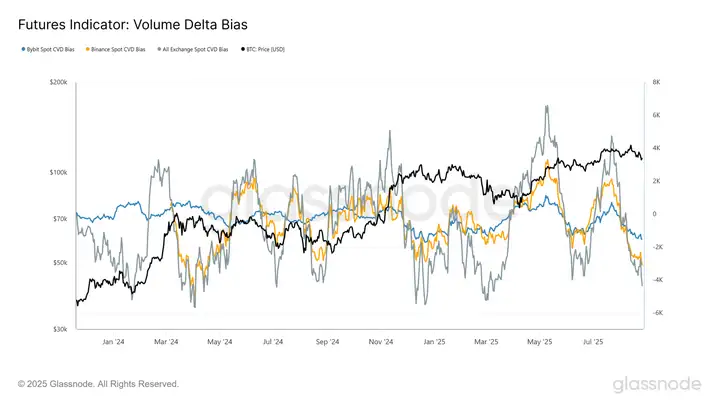
In contrast to the neutral tone in the spot market, the situation for perpetual futures has shifted decisively to the bearish side. Since July, the CVD bias on Binance, Bybit, and aggregator exchanges has fallen into negative territory, indicating an increasingly uneven selling pressure. This suggests that perpetual traders, typically the more speculative segment of the market, have favored short during recent pullbacks.
That said, the indicator is highly volatile, often reaching extremes of buying and selling pressure in the short term. While the current bias highlights a growing bearish trend, it should be closely monitored to confirm whether this negativity is a sustained trend or proves to be a brief blip in the perpetual contract.
Bitcoin's pullback to $111,000 has the market testing a critical range. Recent investor cost base of $107,000–$108,900 marks key support; a break opens the way to $93,000–$95,000. A dense supply cluster could form a mid-term bottom. A rally to $113,600 is possible but likely to encounter resistance as short-term holders under pressure sell on strength. Consolidation is likely to prevail over sustained rapid gains until a clear positive market development emerges. We'll see what the data reveals today and tomorrow.