

Ethereum (ETH) price appears to be ending August on a positive note, rising more than 23% and breaking a three-year chain of negative performance in August. Unlike Bitcoin, which struggled throughout the month, ETH price has shown resilience.
However, September has historically been one of Ethereum’s weaker months, with only modest gains of 3.20% in 2024 and 1.49% in 2023 after a series of red Septembers. Now, with the charts sending mixed signals, ETH could be in for a volatile month.
Long term investors can take profits
One important metric to watch is Ethereum's Net Unrealized Profit/Loss (NUPL), which measures the overall returns of investors.
A high NUPL means that most wallets are in profit, which is usually a signal that some may be taking profits. The NUPL of Ethereum long-term investors is currently at 0.62, near its highest level in the past three months.
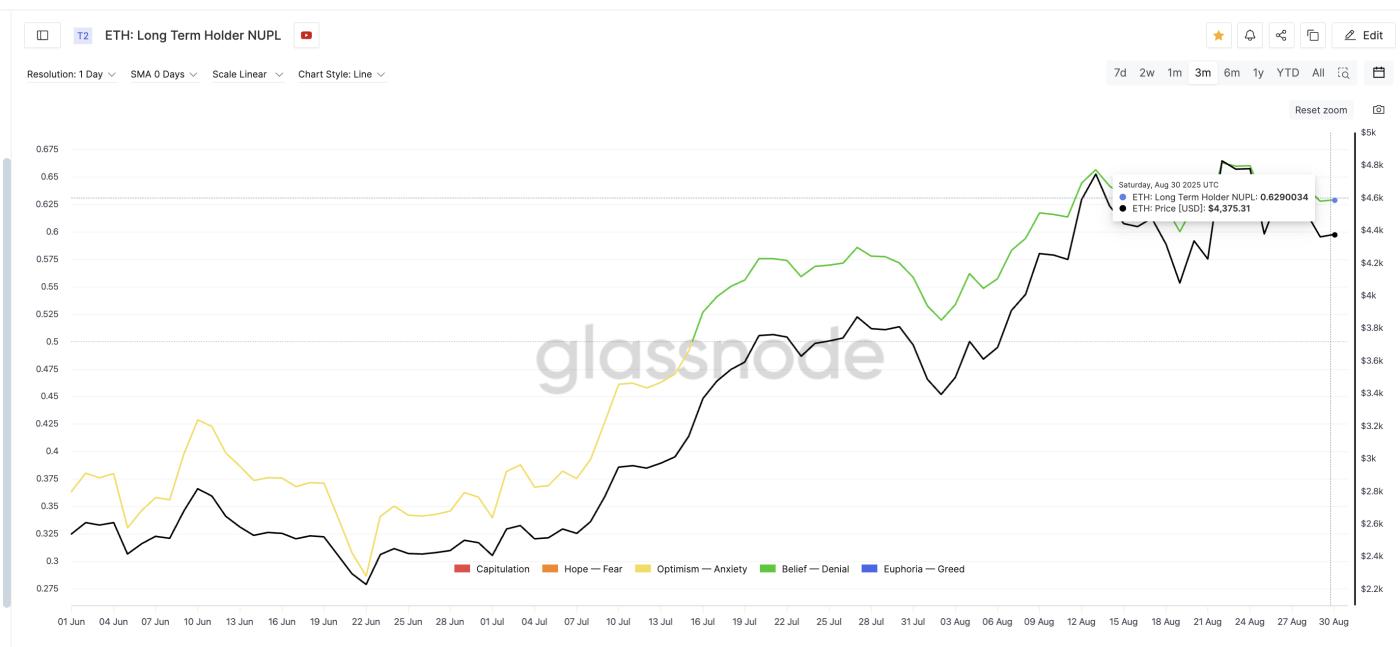 Ethereum Holders Might Book Profits: Glassnode
Similar levels have triggered corrections in the past. On August 17, when NUPL hit 0.63, ETH fell from $4,475 to $4,077 (-8.9%). Later that month, at 0.66, ETH fell from $4,829 to $4,380 (-9.3%). This suggests that September could bring volatility or range-bound price action.
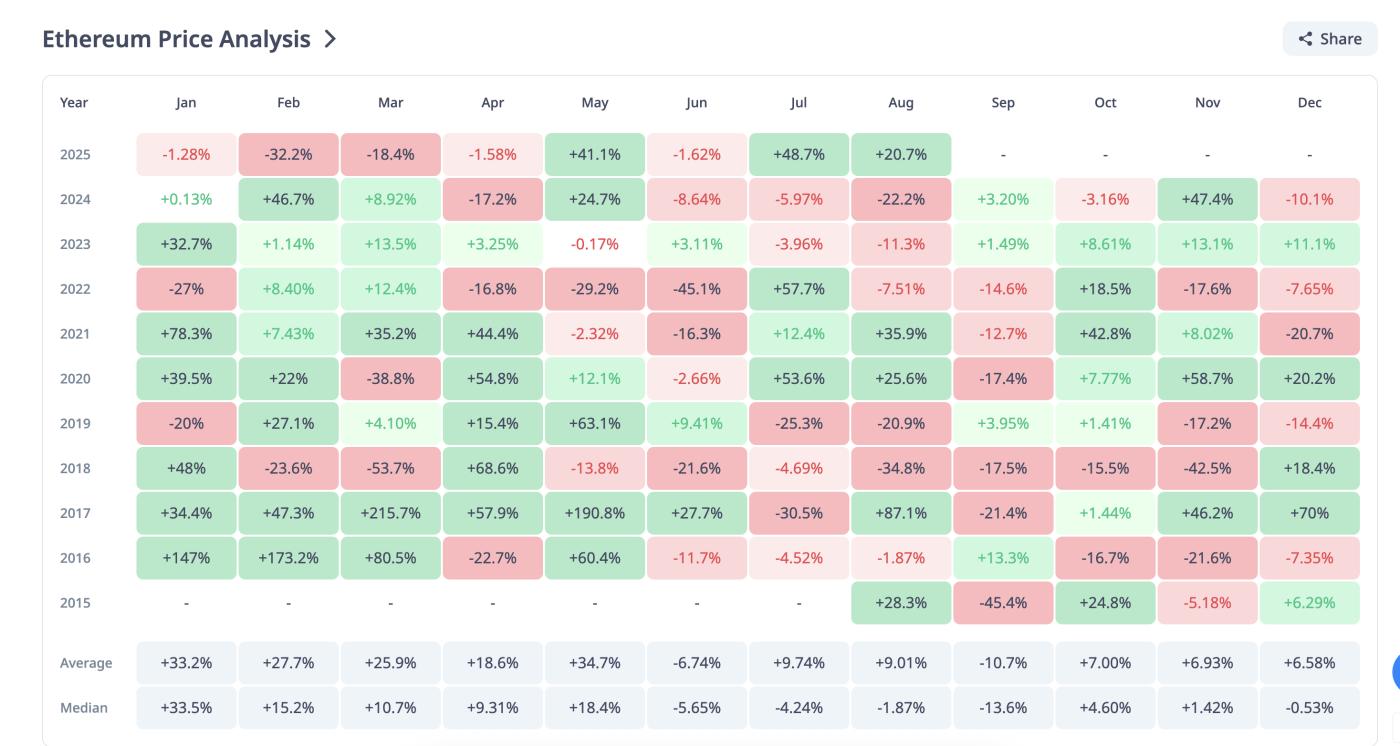 Ethereum Price's Historical Performance: CryptoRank
History shows that September has not been ETH's strongest month. That history, combined with the high NUPL, favors volatility.
For Token Insights and Market Updates: Want more Token insights like this? Subscribe to Editor Harsh Notariya's Daily Crypto Newsletter here .
However, long-term fundamentals remain supportive of price gains. In an exclusive interview with BeInCrypto, Kevin Rusher, CEO of RAAC, explained:
“In September, I expect the main drivers for Ethereum to remain the same, with the most important being the growing trend of companies buying ETH for their treasuries. In fact, just this week, Standard Chartered cited this as a key reason for raising ETH price target to $7,500,” he said.
This treasury accumulation trend, coupled with Ethereum’s Vai in DeFi and Tokenize of real assets (RWA), could help mitigate downside moves even as short-term volatility persists.
Capital price heat map highlights key resistance
Another important indicator is the Cost Basis Heat Map, which shows where ETH was last accumulating. These zones often Vai as natural support or resistance.
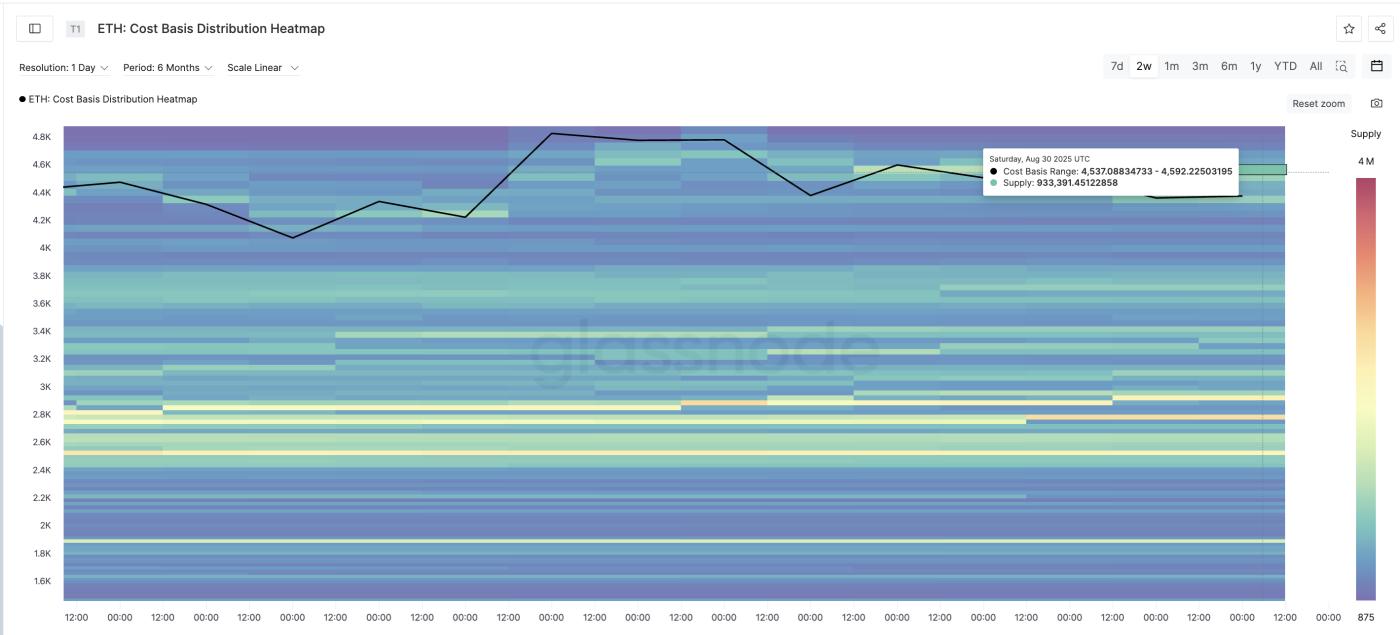 Key ETH Accumulation Clusters: Glassnode
The strongest support cluster lies between $4,323 and $4,375, where over 962,000 ETH has been accumulated. Below that, there are additional zones at $4,271–$4,323 (418,872 ETH) and $4,219–$4,271 (329,451 ETH), which provide buffers in case Ethereum price declines.
The bigger challenge lies above. Between $4,482 and $4,592, nearly 1.9 million ETH has accumulated, making this a formidable resistance zone.
If ETH price breaks above this zone, the momentum could extend to $4,956. More on this when we discuss Ethereum price action later.
Technical charts signal Ethereum price volatility
The 2-day Ethereum price chart shows that it has broken below an ascending trend line. This does not confirm a bearish reversal, but it does show that the bullish momentum is fading.
The Relative Strength Index (RSI), which measures the speed and strength of price movements, has formed a bearish divergence — with price making higher highs while RSI is trending lower.
This usually signals waning strength and the possibility of range trading, especially if it forms on a longer time frame.
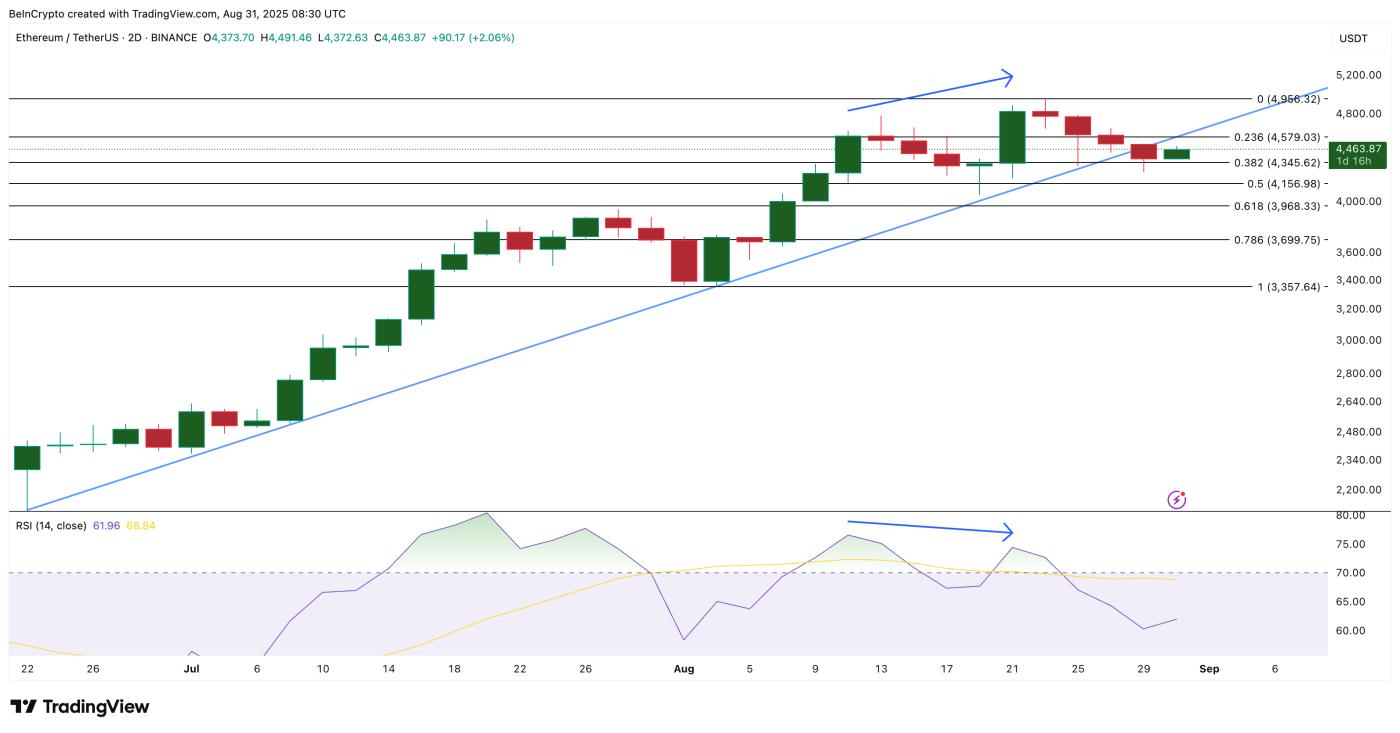 Ethereum Price Analysis: TradingView
If ETH reclaims $4,579 (almost breaking the overhead resistance), the bullish momentum could resume, with the main target at $4,956.
On the downside, keep an eye on the key support levels at $4,345 and $4,156. A break below $4,156 could open the door to a deeper decline, while a hold above $4,579 would leave $4,956 (near $5,000, a key psychological level) within reach.
For Ethereum, however, that level may not just be the beginning of something bigger, as Rusher summarized.
“Yes, $5,000 is still a significant level. Investors psychologically like round numbers, plus it’s a new All-Time-High . Once ETH breaks above $5,000, it will gradually become a strong support level,” he added.
However, if Ethereum price closes below $4,156 with a complete 2-day candle, the bullish narrative may take more time to materialize.
And with long-term holders' NUPL approaching a 3-month high, volatility talk takes on added weight.


