

Bitcoin, Ethereum and Shiba Inu are waiting for BTC to test critical support with the risk of losing $100,000, ETH is consolidating after its surge toward $4,000, and SHIB is coiling in a triangle pattern that could push volatility to new heights and price to the sky or a zero, if volume finally comes back. Prepare for decisive entries and exits as these setups reach their tipping points.
Bitcoin's goodbye
Bitcoin is barely surviving, and the charts indicate that the $100,000 mark is in grave danger. BTC has been declining steadily since an unsuccessful attempt to recover highs above $120,000, losing an important moving average support in the process. The recovery from $108,000 to $110,000 has temporarily eased the situation, but there is still little momentum and a significant downward risk.
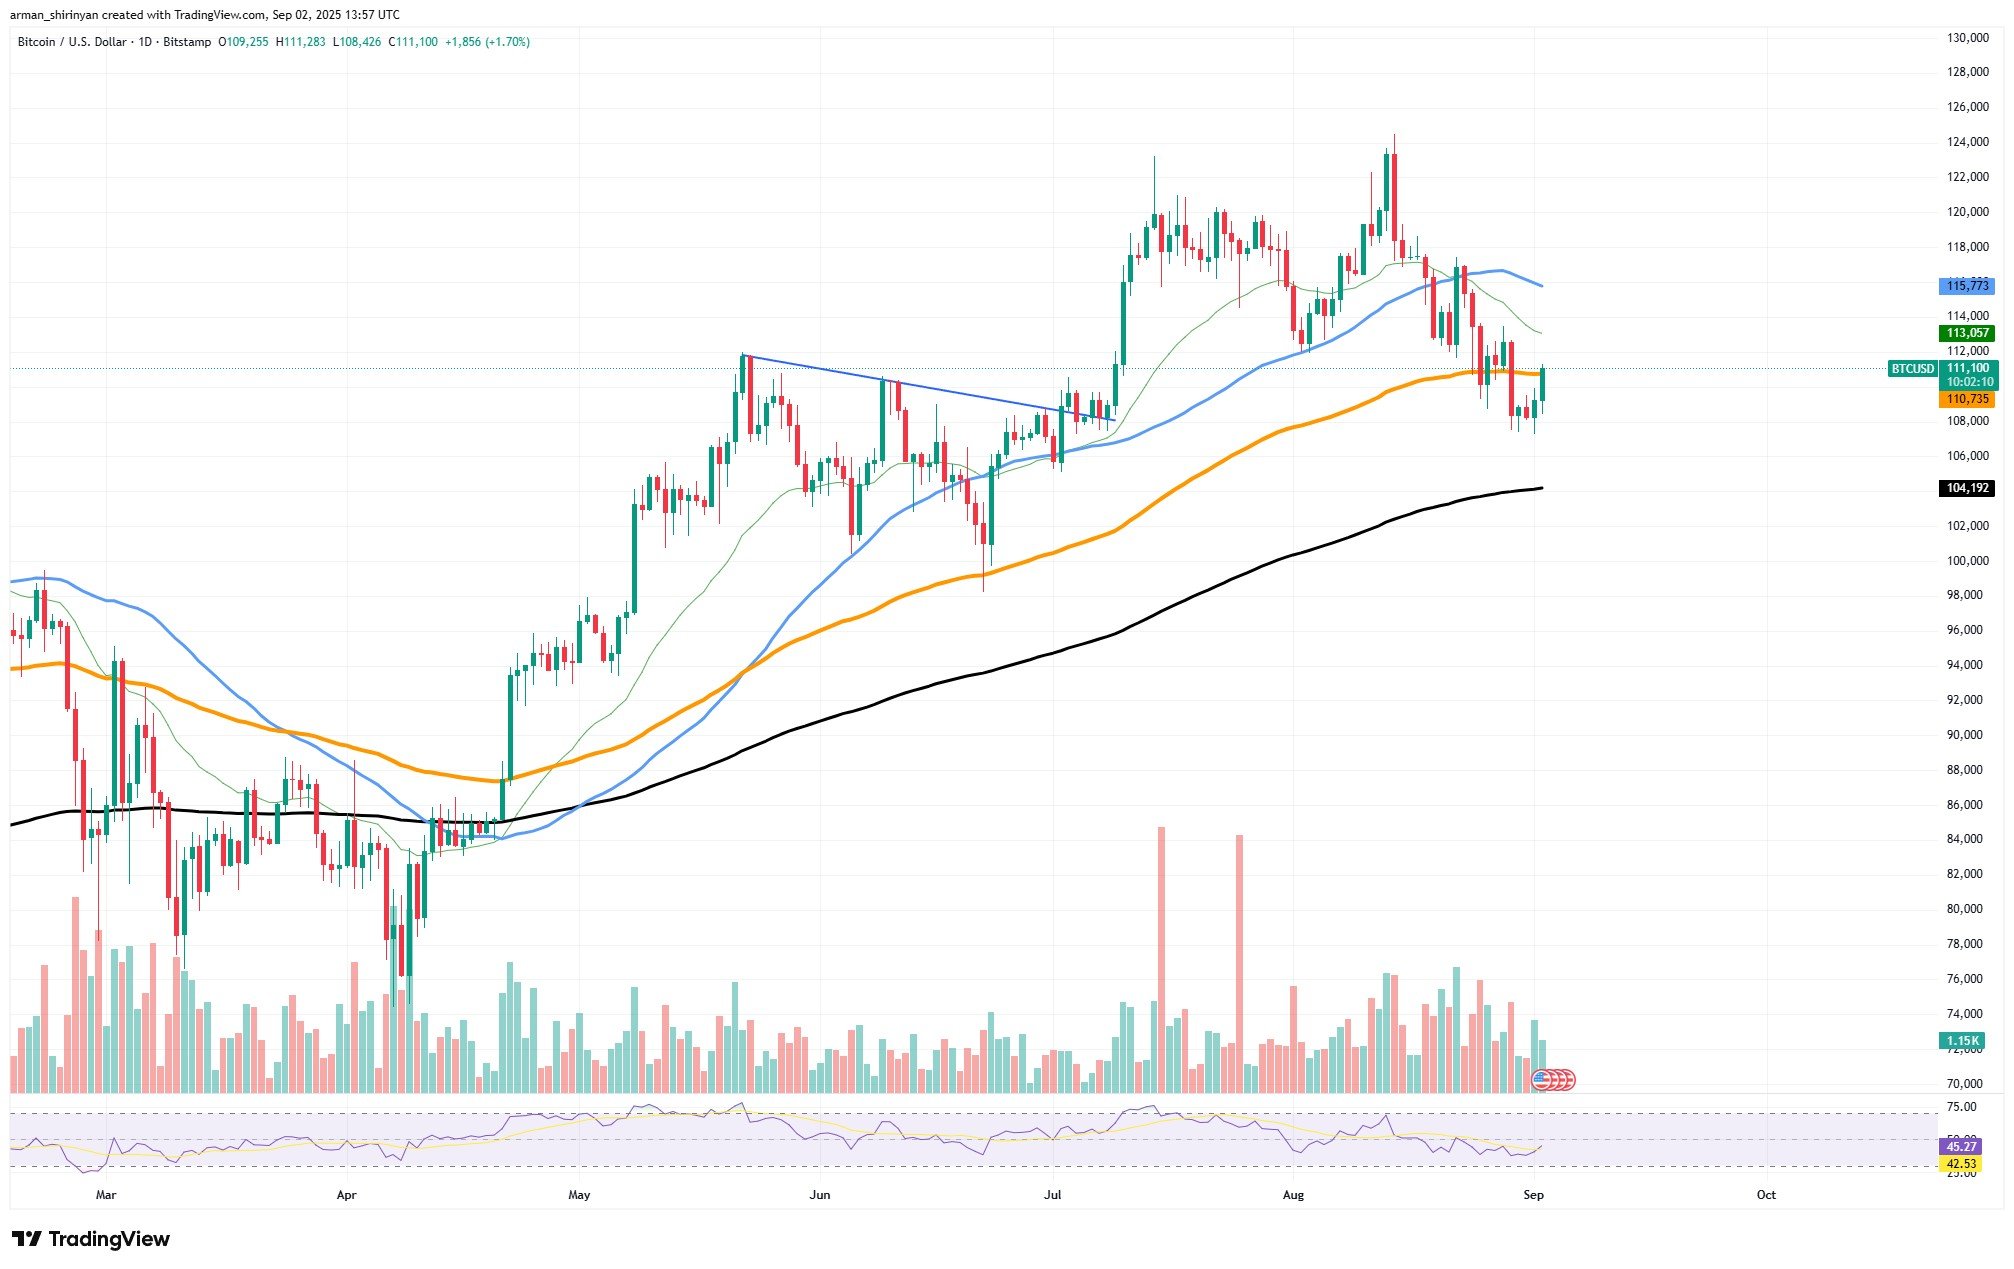
Technically speaking, Bitcoin remains below its 50-day moving average, indicating that the short-term bullish momentum has subsided. The market may break down into double-digit territory, and the 200-day EMA, which is currently at $104,000, is the last important line of defense.
Volume patterns highlight this setup’s vulnerability even more. Trading activity has declined in recent sessions, indicating that buyers are not acting decisively. With no obvious bullish divergence, the RSI is still muted and hovers close to oversold territory. This indicates that Bitcoin lacks the technical strength that typically supports a significant reversal.
Additionally, the larger market environment isn’t offering much assistance. The dominance of Bitcoin is still under threat, despite the fact that some altcoins have proven resilient. This suggests that money is moving less into Bitcoin in particular. Deeper corrections are made more likely by macro uncertainty and decreased liquidity.
As support levels wane, be prepared to lose $100,000. In the absence of Bitcoin recovering $114,000 and maintaining momentum above it, the path of least resistance indicates a decline. A drop below six figures would be a psychological blow to market sentiment as well as a technical failure, with the potential to bring down the entire cryptocurrency market.
Ethereum cools off
Following its spectacular surge to $5,000, Ethereum has cooled off and is currently consolidating at $4,300. Ethereum may be preparing for a comeback, according to the charts, even though the pullback has made some traders cautious — that is, if it can maintain a crucial level: $4,000.
The 20-day EMA is serving as the short-term buffer as ETH tests its short-term supports at the moment. The 50-day EMA near $4,050, which has historically functioned as a dependable pivot during retracements in robust uptrends, is the more important line to keep an eye on.
Compared to the buying craze in early August, volume has slowed, suggesting that the market is cooling. This does not necessarily mean that the market is bearish, because periods of lower volume frequently come before accumulation phases, which allows big buyers to get back in before the next leg higher.
Since the RSI is close to neutral, Ethereum has space to rise if buyers take back control. The critical $4,800-$5,000 resistance zone would be the next upside target if ETH holds $4,000 and buyers intervene at the 50 EMA. If that range were broken, it would be confirmed that the overall upward trend would continue.
Shiba's volatility to surge
As the price action of Shiba Inu (SHIB) keeps compressing inside a symmetrical triangle pattern, the coin is about to enter a critical phase. SHIB, which is currently trading at $0.0000123, is getting close to the formation’s tip where volatility usually spikes and key moves take place. With this configuration, traders wonder if SHIB will soar higher or plummet to another zero.
Under strong resistance, SHIB has been consolidating for months, with the 200-day moving average at $0.0000140 serving as a ceiling. The token has not succeeded in making a breakthrough despite numerous attempts. The market is now building momentum for a breakout as the triangle gets smaller.
The following are the options from here:
SHIB may initiate a wave of short covering and rekindle buying interest if it breaks above the triangle’s upper boundary. A breakout above the 200-day SMA would confirm a reversal and possibly pave the way for a larger rally. Other important upside targets are $0.0000130, $0.0000140 and $0.0000150.
Selling pressure is likely to increase if $0.0000120 is broken, with an immediate decline toward $0.0000110. SHIB could add another zero if that level is lost, pushing the token into even more bearish territory. The tightening triangle should cause traders to anticipate increased volatility, even in the absence of a clear breakout. Both bulls and bears may be trapped by abrupt intraday swings until a distinct direction becomes apparent.
The mid-40s RSI indicates that SHIB is neither overbought nor oversold, allowing for potential movement in either direction. The market is still waiting for a trigger, as evidenced by the muted trading volumes in the interim.
To summarize everything: BTC remains playable only if it reclaims $114,000 or bounces at $104,000, with an exit on a close below $100,000. ETH offers opportunity at $4,000-$4,050 or on a breakout above $4,800, with risk cut under $3,950 and profits capped near $5,000. SHIB’s entry sits above the $0.0000130-$0.0000140 resistance, while failure of $0.0000120 is the exit cue. Across all three, momentum and volume confirmation are crucial, as each chart is positioned for a strong directional move rather than sideways drift.


