

This report, written by Tiger Research, outlines the Tiger Valuation Model (TVM), a systematic evaluation framework for calculating Bitcoin's fair value. We combine market sentiment indicators, network fundamentals, and macroeconomic indicators to determine Bitcoin's fair value.
1. Introduction
Every asset has a price. Even a single apple on the supermarket shelf can feel expensive to one person and cheap to another. This difference in perception arises because each individual uses their own internal benchmarks to assess value. When something is perceived as cheap, we tend to buy more; when it's perceived as expensive, we hold back or sell.
“So, what is Bitcoin’s fair value?”
This question has almost certainly been asked by every crypto investor, both retail and institutional. Some look at technical chart patterns, some react to news, and still others rely on instinct.
In traditional stock markets, valuations are supported by standard metrics and models. Analysts use indicators such as the P/E ratio, P/S ratio, and EV/EBITDA, as well as models like the dividend discount model (DDM) or discounted cash flow (DCF) to derive price targets. Investors use these frameworks to assess fair value and guide decision-making.
In contrast, Bitcoin lacks a widely accepted valuation framework. There's no consensus on what data to use or how to interpret it. Some compare Bitcoin to gold or speculate that it could absorb a portion of the global capital market, approaches that remain theoretical and difficult to implement practically.
“Fifteen years after Bitcoin's inception, is it still impossible to estimate its fair value?”
The market reality has changed. Bitcoin's market capitalization now exceeds US$2 trillion and it has become an established asset class. Institutional investors are entering in increasing numbers, increasing correlation with traditional financial markets. Volatility, once driven by retail speculation, has subsided.
Bitcoin is no longer a nascent asset. On-chain data allows real-time visibility into transaction volume, wallet activity, and long-term holder behavior, including their purchase prices. Network activity can be monitored with transparency that often surpasses traditional financial assets.
In response to this fundamental shift, Tiger Research introduced a systematic valuation framework for Bitcoin.
The key is to reflect Bitcoin's unique characteristics. Rather than imposing models used for stocks or gold, our framework leverages on-chain data and institutional behavior to estimate value. The result is an objective benchmark that can be used by both retail and institutional participants. The goal is to enable more rational, evidence-based investment decisions, transcending emotional reactions fueled by FOMO or FUD.
Dive deeper into Asia's Web3 ecosystem with Tiger Research. Join over 16,000 pioneers for exclusive, up-to-date insights into market conditions.
2. Tiger Valuation Model (TVM)
Tiger Research's Tiger Valuation Model (TVM) is a framework designed to estimate Bitcoin's fair price. The TVM's primary objective is to comprehensively assess the various factors that influence Bitcoin's price. This approach mirrors how stock analysts evaluate companies by leveraging disclosures, fundamentals, and broader economic conditions.
Unlike other methods that rely solely on on-chain data or macroeconomic trends, TVM combines both to provide a more comprehensive and accurate estimate of Bitcoin's fair value.
The goal is to provide a more objective and reliable valuation benchmark for investors.
2.1. TVM Formula
Fair Price = Basic Price × Fundamental Indicators × Macro Indicators
TVM uses a step-by-step approach to calculate Bitcoin's fair price. This method consists of three steps that sequentially examine market sentiment, network fundamentals, and the macroeconomic environment.
The first step uses on-chain data to evaluate investor sentiment and identify overbought or oversold conditions. This step estimates a sentiment-neutral floor price by filtering out extreme emotions in the market.
The second step measures the floor value based on Bitcoin network activity. Since 2024, the BTCFi ecosystem has begun to grow significantly, and Bitcoin network activity has gradually increased. TVM captures this shift by analyzing changes in network activity to adjust the Floor Price.
The final step incorporates broader economic factors, including global liquidity, institutional capital flows, and regulatory developments. These variables are combined into a macro multiplier that is applied to the adjusted base price.
The core feature of the TVM approach is the interaction effect between these components. Each factor independently influences price, but when combined, they can amplify results. For example, if macro conditions improve and institutional capital flows in while user growth also increases, the combined impact could exceed the sum of the individual impacts. Conversely, stagnating user adoption amid tightening liquidity could lead to greater downside risks.
This strengthening dynamic is evident in recent market cycles. During the 2020 pandemic, even moderate fundamental improvements triggered a significant price rally due to loose monetary conditions. Conversely, in 2022, network health remained stable, but a broad market contraction led to a sharp price decline.
TVM takes these dynamics into account by applying multipliers derived from network and macro indicators respectively to the sentiment-adjusted base price.
We believe that the structured approach of TVM offers a clearer explanation of Bitcoin's complex price formation process than conventional methods. By integrating various market signals, TVM provides a more practical and transparent valuation framework for investors.
2.2. TVM Detailed Framework
Step 1: Determine the Base Price
The first step in TVM is to assess whether the current Bitcoin price is overbought or oversold and to extract a sentiment-neutral fair value. This process involves removing the influence of market emotions such as fear and greed to establish a baseline .
This concept aligns with the stock market adage: "Stock prices are like dogs on a leash." Short-term volatility ( the dog ) can lead away from long-term value ( the owner ). Similarly, in the Bitcoin market, we believe that while sentiment can drive short-term price movements, long-term prices tend to revert to their intrinsic value. The Floor Price represents a sentiment-neutral fair value, filtering out extreme emotions using on-chain data.
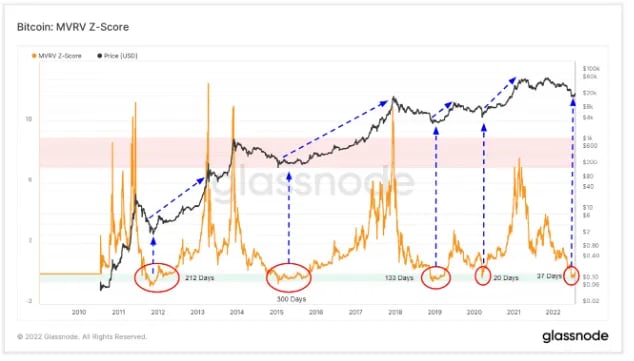
To estimate this value, we applied three widely used on-chain indicators: the MVRV-Z Score , aSOPR, and NUPL. These metrics rely on immutable blockchain data to assess market sentiment. We analyzed the past four years of each metric and quantified its forward-looking return profile by measuring how the price changes after certain signals. For example, we tracked the average return after periods when the MVRV-Z Score entered a deep undervaluation zone.
The output from each indicator is then converted into expected returns and combined to form the Base Price. We apply an average weighting of 50% for MVRV-Z, 30% for aSOPR, and 20% for NUPL. The resulting sentiment-adjusted fair value serves as the foundation for subsequent adjustments.
Step 2: Applying Fundamental Indicators
The Floor Price reflects market neutrality but doesn't capture Bitcoin's true value. Unlike traditional assets, Bitcoin has no cash flows and cannot be valued using standard models like discounted cash flow (DCF). Bitcoin also doesn't fully meet the characteristics of a hedge like gold.
Therefore, we define Bitcoin's real value as a function of its decentralized network—a system not controlled by any central authority. This network value derives from user participation and activity, similar to Metcalfe's Law: the higher the user engagement, the greater the network's utility and long-term value. Conversely, a decrease in activity can reduce perceived value. Recently, the BTCFi ecosystem has emerged and expanded Bitcoin's use cases, making network activity analysis even more important.
To measure network fundamentals, we use three main metrics:
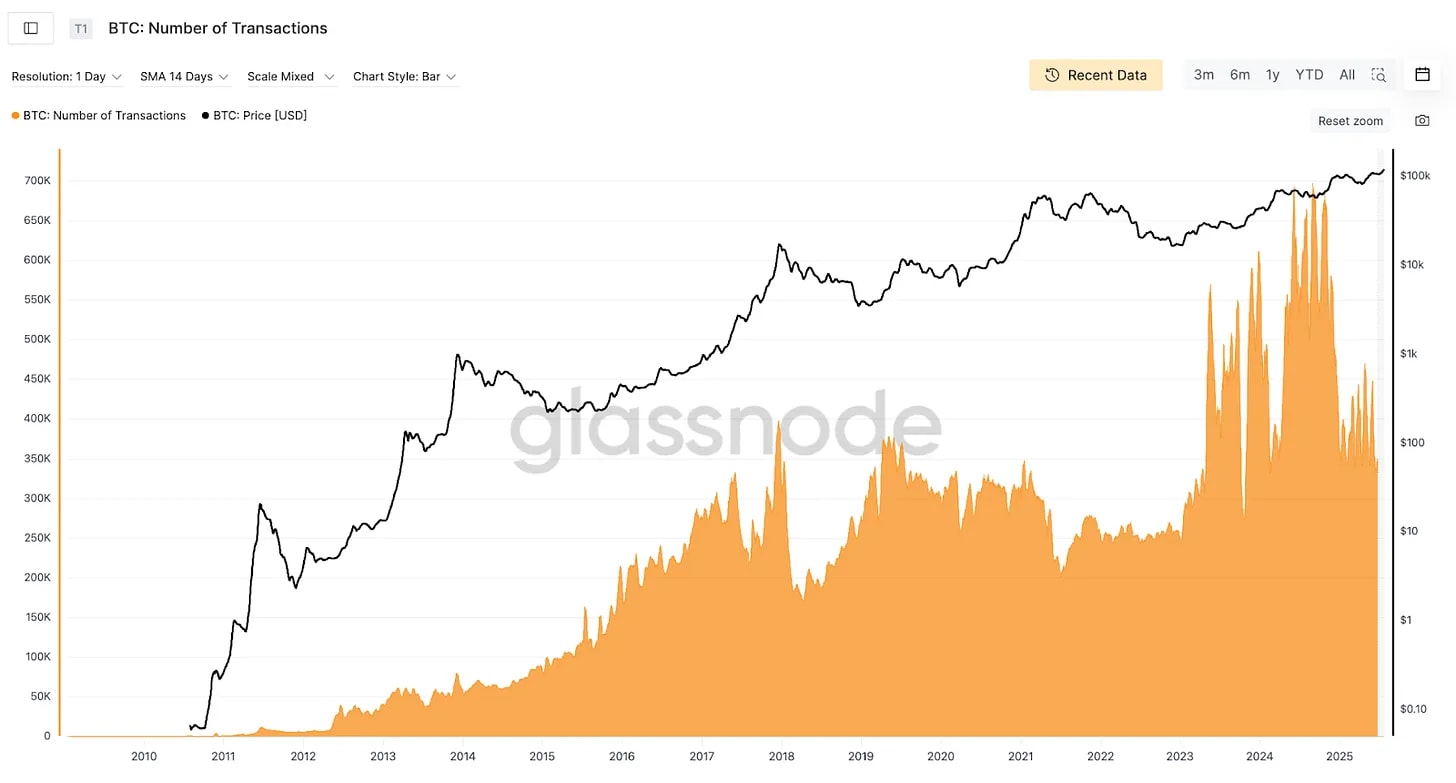
Number of transactions – frequency of network usage
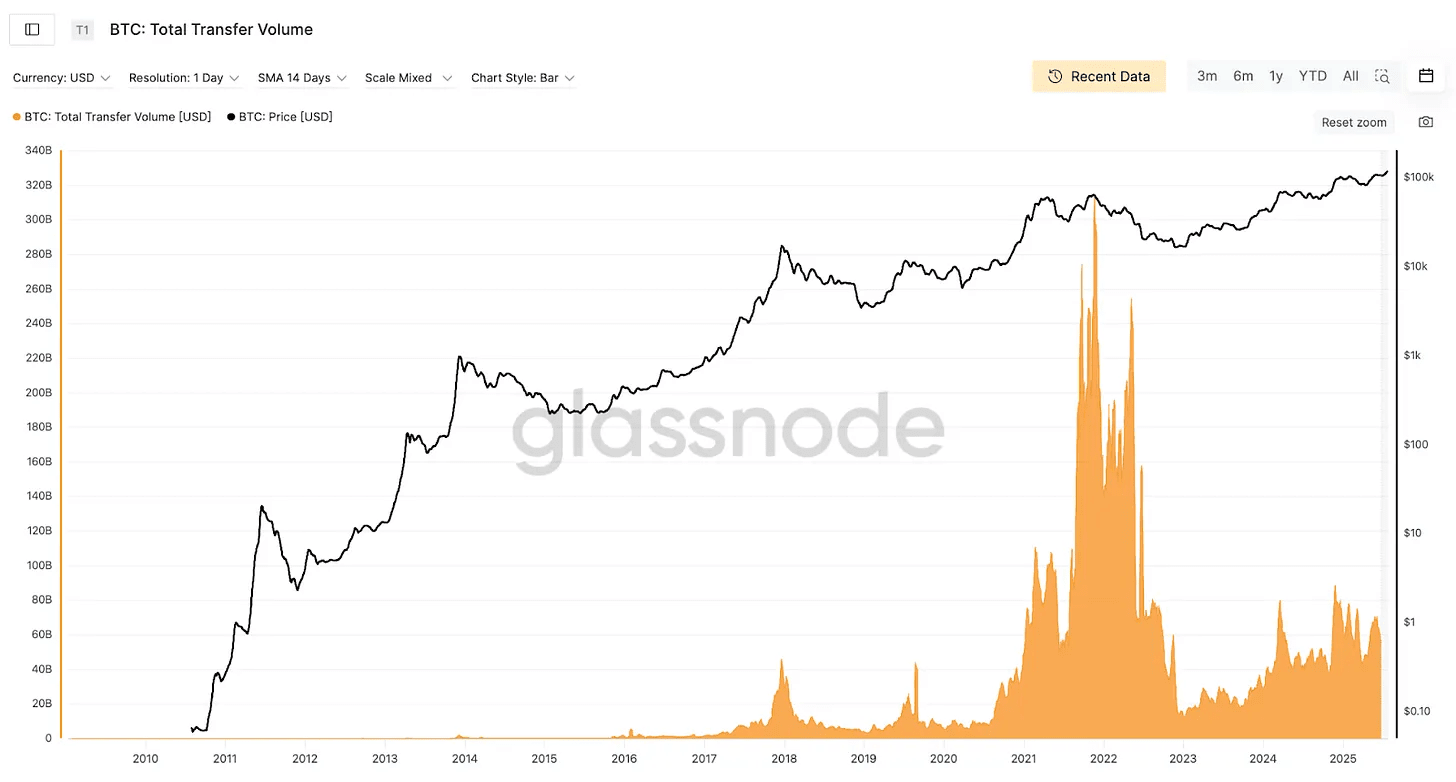
Transfer volume – scale of economic activity
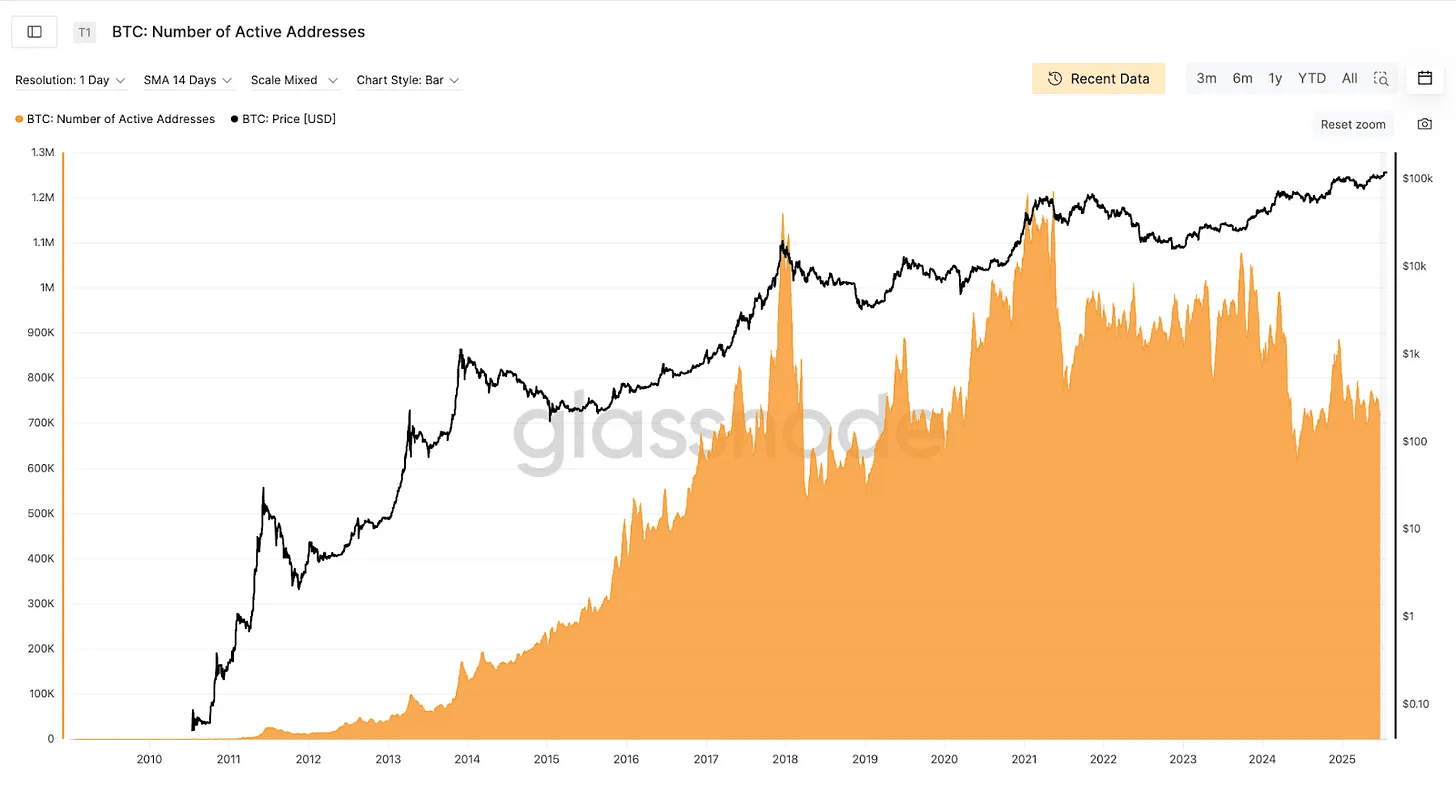
Number of active and new addresses – network growth and user adoption
These metrics reflect how actively the network is used and help measure Bitcoin's fundamental value.
Each indicator is compared to its historical average to create a Fundamental Multiplier. If current activity is above the average, the multiplier increases; if it is below, the multiplier decreases. This adjustment is applied to the Base Price to account for network dynamics and serves as input for the final step.
However, it's important to acknowledge that these indicators don't yet have a significant impact on price. Bitcoin still functions primarily as an investment asset, like gold, and the BTCFi ecosystem is still in its infancy. While network activity indicators are theoretically strong, their impact on price is still limited. However, we expect these fundamental indicators to become more influential as BTCFi expands and the Bitcoin network's utility increases.
Step 3: Inserting Macro Indicators
The final step is integrating macroeconomic factors. As Bitcoin evolves into a globally traded financial asset, its price is increasingly influenced by external conditions. Regardless of fundamentals, changes in macroeconomic conditions can cause significant price movements.
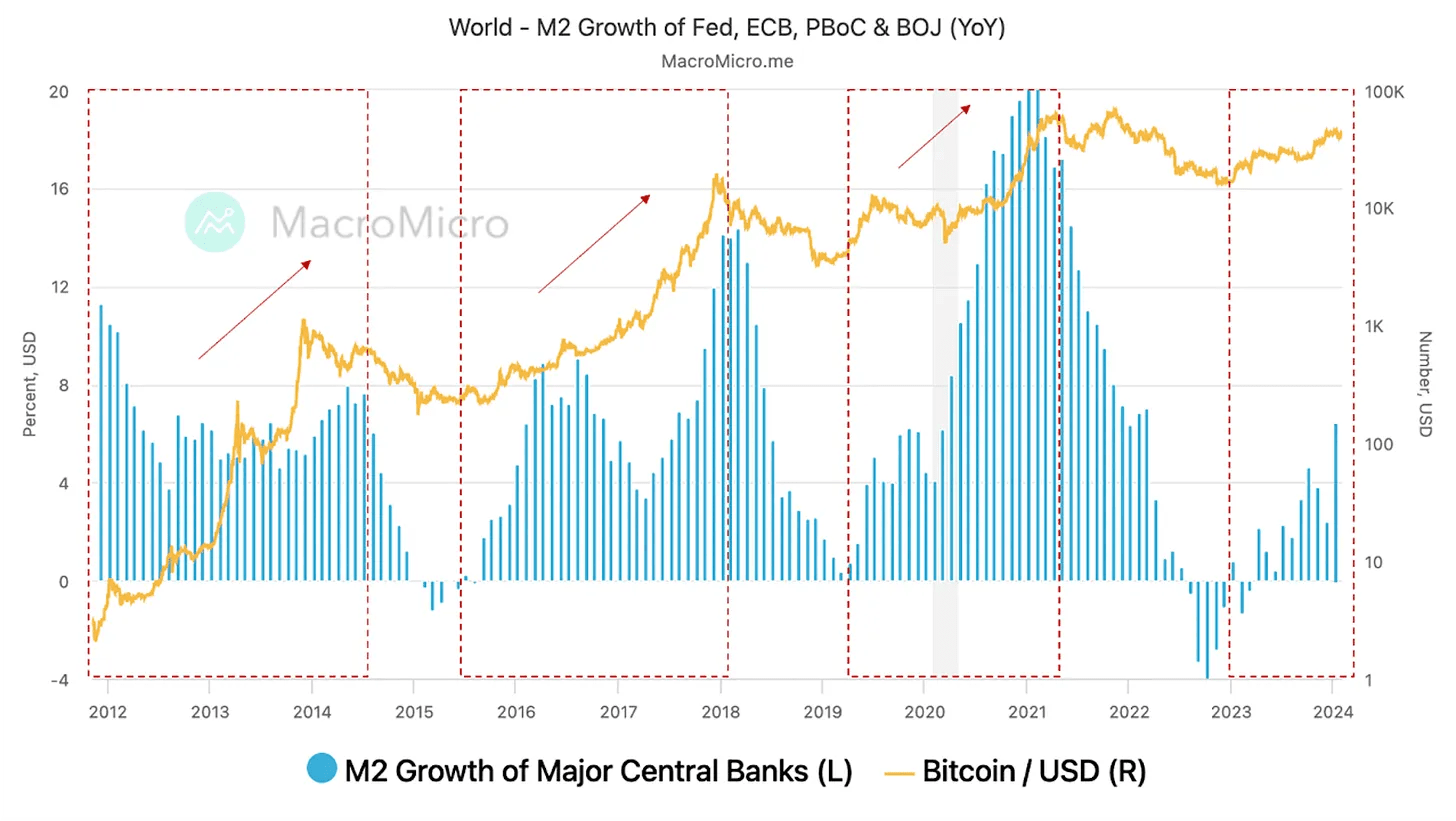
For example, during the COVID-19 pandemic in 2020, global liquidity surged, and Bitcoin's price rose sixfold—from $10,000 to $60,000. Conversely, when the US Federal Reserve tightened policy in 2022, Bitcoin fell below $20,000, despite stable fundamentals. These events demonstrate Bitcoin's high sensitivity to macroeconomic conditions. Its correlation with gold has varied over time, making it difficult to definitively classify it as a risk asset or a safe-haven asset.
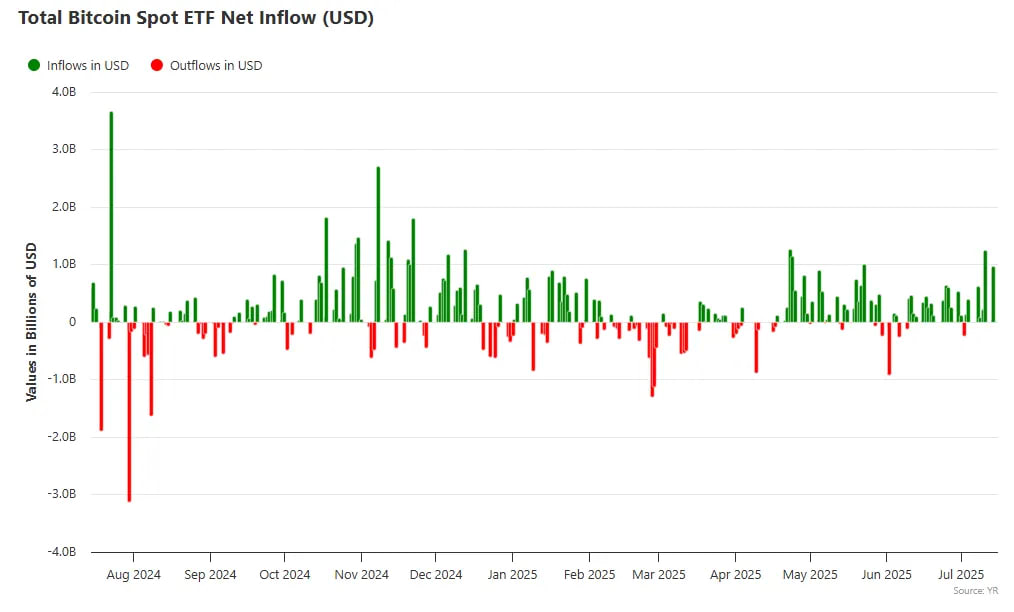
The link between Bitcoin and global markets has deepened following the SEC's approval of a spot Bitcoin ETF in 2024, accelerating institutional capital flows. Firms like BlackRock and Fidelity are channeling significant funds into Bitcoin through ETFs, with total assets reaching $135 billion, helping push the price above $100,000. Publicly traded companies like Strategy are also contributing through large-scale accumulation. These developments are closely linked to regulatory trends, particularly in the US, and future capital flows will likely depend on policy developments.
To quantify these macro factors, TVM uses three main indicators:
Global liquidity (M2) – total money supply of central banks in major economies (US, EU, China, Japan, Korea)
Institutional capital flows – real-time monitoring of ETF inflows/outflows to gauge institutional sentiment
Regulatory environment – a qualitative assessment of whether government policies support or hinder Bitcoin
Each factor is compared against historical norms to generate a Macro Multiplier, which is then applied to the price adjusted by the Fundamental Multiplier. The final output is the 12-month Fair Price.
2.3. Safety Mechanisms against Extreme Volatility and Noise
To prevent overreaction to short-term shocks, the Tiger Valuation Model (TVM) applies a maximum limit ( cap ) to the adjustment multiplier. The goal is to filter out excessive noise and maintain valuation stability. Specifically, the Fundamental Multiplier is capped at ±10%, while the Macro Multiplier is capped at ±40%.
For example, even if there is very positive network development, the fundamental adjustment cannot exceed +10%. Similarly, even under severe macro shocks such as the global financial crisis, macro adjustments will not reduce valuations by more than 40%.
This limitation exists for a simple reason: most market-moving news creates only temporary disruptions, not fundamental changes. Bitcoin could drop 20% due to regulatory commentary or rise 10% due to a celebrity tweet, but that doesn't change its fundamental value. The TVM framework is designed to filter out this noise and focus on a rational long-term valuation range.
2.4. Case Study: November 2022
Now that we've covered the essence of TVM, let's see how this model can be applied to a real-world market scenario. We'll analyze the practical implementation process through a representative case study.
In November 2022, when Bitcoin was trading near $20,000, the FTX bankruptcy crisis erupted. The entire crypto market descended into panic. Let's use TVM to estimate fair value under these circumstances.
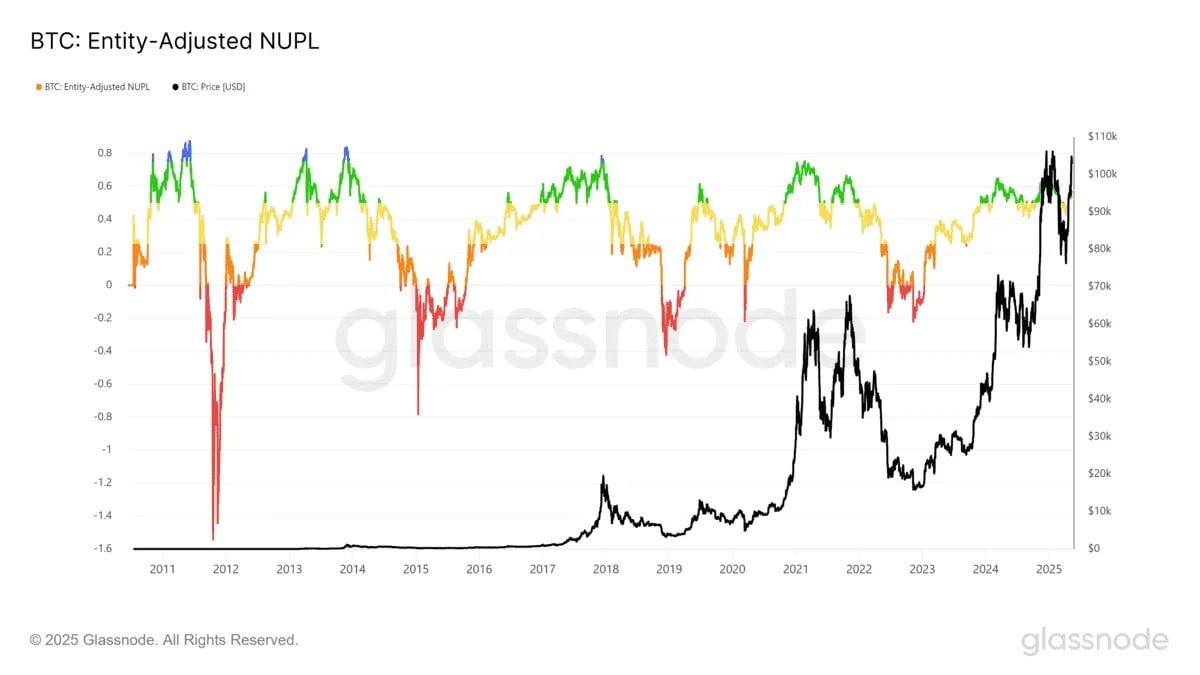
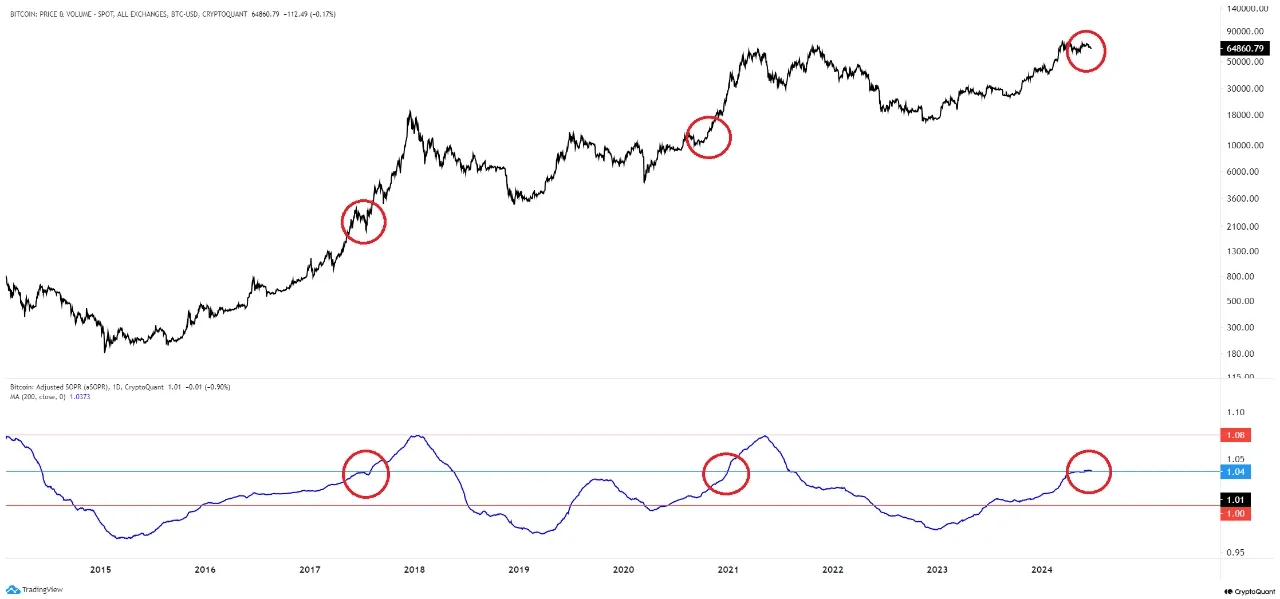
Let's start by establishing a floor price. The MVRV-Z Score fell below zero, while the aSOPR and NUPL also entered the fear zone . Generally, when the MVRV-Z Score is below zero, it means the current price is below the average buying price of market participants. This indicates that the market has reached an extreme level of fear, and additional selling pressure is likely limited. Based on historical data, similar conditions typically provide a potential rebound of around 10%, so the floor price is set at $22,000.
Looking at fundamental indicators from this starting point, we find something interesting. After the FTX collapse, trust in centralized exchanges disappeared, and Bitcoin network activity actually increased temporarily. Users moved their assets from exchanges to private wallets, slightly increasing the number of transactions, transfer volume, and the number of active wallets. While limited, this increase in network activity indicates that people still trust the Bitcoin network. We view this as a positive fundamental factor, so we applied a 5% upward adjustment. With a base price of $22,000 and a +5% fundamental adjustment, the price is $23,100.
On the macro front, global M2 growth has slowed, reducing market liquidity. The property crisis in China has added risks to global macro indicators. Furthermore, the collapse of FTX is not just a single entity's failure but has fueled broader distrust in the crypto ecosystem. Without a clear regulatory framework from major economies, institutional participation remains limited. Considering these factors, a 30% downward adjustment is expected.
Interestingly, extreme fear often creates the conditions for a strong rebound. When the MVRV-Z is in deep negative territory, this price zone often attracts accumulation by long-term investors. We find that the lows formed during extreme conditions often become solid support levels. If macro conditions improve or regulatory uncertainty eases, we expect a sharp recovery.
Fair Price = Base Price × Fundamental Indicator Multiplier × Macro Indicator Multiplier
$16,170 = $22,000 × 1.05 × 0.70
Base Price: $22,000 (based on MVRV-Z < 0, with 10% adjustment applied)
Network Fundamental Multiplier: 1.05 (increased network activity, increased transfers to personal wallets)
Macro Indicator Multiplier: 0.70 (FTX collapse, global M2 contraction, regulatory uncertainty)
Fair Value Valuation: $22,000 × 1.05 × 0.70 = $16,170
Now let's compare this prediction with the actual results. In December 2022, Bitcoin's price dropped to $15,000. The TVM calculation of $16,170 was only about 7% off, which is quite accurate. After the price drop, on-chain data showed extreme fear, while fundamental indicators showed confidence in the network remained intact. This suggests a potential medium-term rebound.
Since late 2022, expectations for a Bitcoin ETF approval have been growing, increasing the potential for institutional investors to enter. Geopolitical uncertainties, such as the Russia-Ukraine war, have also increased interest in Bitcoin's role as "digital gold." As macroeconomic conditions began to improve, the rebound predicted by on-chain data began to occur.
Starting in March 2023, macroeconomic conditions improved significantly. The US Federal Reserve slowed its pace of interest rate hikes, helping restore risk appetite, and the end of China's zero-COVID policy boosted expectations of a global economic recovery. As a result, Bitcoin surpassed $40,000 by the end of the year, recording a 166% increase.
This case clearly demonstrates the power of the TVM framework. Rather than relying on technical patterns or emotional judgment, the model combines on-chain data, fundamentals, and macro variables to generate objective fair value estimates. More importantly, the model proactively identifies potential rebounds under extreme conditions—providing a structured framework for investors to make rational decisions.
3. Base Price Reduction
The reason TVM uses the MVRV-Z Score , NUPL , and aSOPR to calculate the floor price is quite simple: these three indicators are based on actual transaction data recorded on the blockchain. This data is completely transparent and shows when Bitcoin was purchased, at what price, whether it has been sold, and how much is currently held.
This type of objective data is important because it provides a logical starting point for analysis, free from emotional reactions. For example, if the average purchase price of all investors was $50,000 and the current price is $80,000, most participants have unrealized gains of 60%.
This could signal increased profit-taking motivation, increasing selling pressure in the market. However, this is only one part of the big picture—we need multiple perspectives to get the full picture. Each of these three key indicators captures a different but complementary dimension of market structure:
The first indicator measures how high or low the current price is compared to past norms.
The second indicator shows how much profit the market as a whole currently has.
The third indicator tracks whether the most recent seller made a profit or suffered a loss.
Combined, these three perspectives allow us to gain a comprehensive view of market conditions. This is similar to how a doctor checks blood pressure, body temperature, and heart rate to assess a patient's health. One piece of data alone isn't enough; the combination of all three creates a clearer picture.
Global investment firms also use these indicators. In its 2024 white paper, Grayscale highlighted MVRV-Z and NUPL as core analytical tools. Glassnode, a leading on-chain analytics firm, called MVRV-Z "the most accurate indicator for identifying market tops and bottoms."
3.1. Details of Key Price Sentiment Indicators
3.1.1. MVRV-Z Score: A Portrait of Overall Market Profitability
3.1.2. NUPL: Measure of Unrealized Profit and Loss in the Network
3.1.3. aSOPR: Track Active Seller Behavior in Real-Time
3.2. Data Construction and Analysis Process
3.2.1. Analysis Methodology
Each indicator is then grouped into five categories:
4. Fundamental Indicators
4.1. Complete Details of Fundamental Indicators
4.1.1. Transaction Count : Measures the frequency of network usage.
4.1.2. Transfer Volume: Measuring economic significance
4.1.3. Active / New User Count : Measures network growth
5. Macro Indicators
5.1. Complete Details of Macro Indicators
5.1.1. Global Liquidity Indicator (Global M2)
5.1.2. Institutional Inflows
5.1.3. Regulatory & Ecosystem Score
🐯 More from Tiger Research
Telusuri lebih lanjut laporan yang relevan dengan topik ini:[Special Report] Vietnam Crypto Market 2025: Complete Analysis of 21 Million Investors
[Special Report] Malaysia Crypto Market 2025: The Hidden Force Behind Global Web3 Giants
Disclaimer
The Bitcoin valuation methodology presented in this document (hereinafter referred to as the “Methodology”) is intended solely for educational and academic research purposes. It does not constitute investment advice, a solicitation to buy or sell, or a recommendation to engage in any form of trading activity. The fair value derived from this Methodology is a theoretical finding based on objective data and mathematical models. These results should not be construed as guidance or endorsement for any specific investment action, including buying, selling, or holding Bitcoin.
This methodology is designed as a research framework to provide one perspective on Bitcoin valuation. It is not intended to be used as a basis for actual investment decisions.
This methodology has been carefully reviewed to ensure it does not involve any form of market manipulation, fraudulent trading, or other unfair trading practices as stipulated in Article 10 of the "Virtual Asset User Protection Act" ("Virtual Asset User Protection Act"). All analyses utilize only publicly available information, including on-chain blockchain data and officially released economic indicators. No material information that is not publicly available or insider information is used. All valuation outputs, including target prices, are based on reasonable assumptions and are presented without material misrepresentation or omission of facts.
The author and the parties distributing this Methodology fully comply with the conflict of interest disclosure requirements stipulated in Article 10, paragraph 4, point 2 of the Virtual Asset User Protection Law. If the author owns or intends to trade the relevant virtual asset (Bitcoin) at the time of writing or distribution, such ownership will be transparently disclosed.
The indicators used in this Methodology—such as Base Prices, Fundamental Indicators, and Macro Indicators—are derived from approaches the author deems reasonable. However, they do not represent absolute truth or definitive answers. The Bitcoin market is highly volatile, operates 24/7, spans global jurisdictions, and is subject to significant regulatory uncertainty. As a result, substantial and prolonged deviations between the assessment results of this Methodology and actual market prices may occur.
This methodology is based on historical data and information available at the time of writing. It does not guarantee or predict future performance. Past patterns or correlations may not persist, and unforeseen market shocks, regulatory changes, technical failures, or macroeconomic events could significantly weaken the predictive validity of this framework. Given the relatively short history and evolving nature of the crypto market, there are inherent limitations to the reliability of past data and its applicability to future projections.
All investment decisions must be made independently and are the sole responsibility of the investor. This Methodology should not be used as the sole or primary basis for any investment decision. Investors should carefully consider their financial situation, investment objectives, risk tolerance, and experience, and seek independent financial or investment advice if necessary. The author, distributors, and other related parties are not liable for any direct, indirect, consequential, special, or punitive losses or damages arising from investment decisions made in reference to this Methodology.
Terms of Use
Tiger Research permits fair use of reports it has compiled and published. 'Fair use' is a principle that permits the use of portions of content for the public interest, as long as it does not harm the commercial value of the material. If the use complies with this principle, reports may be used without prior permission. However, when citing Tiger Research reports, you are required to:
Clearly cite 'Tiger Research' as the source.
Includes Tiger Research logo (black/white).
If the material is to be re-compiled and republished, separate approval is required. Unauthorized use of the report may result in legal action.


