

Pi Coin (PI) is showing signs of recovery after a difficult period. At the time of writing, Pi Coin's price is near $0.36, up nearly 3% in the past 24 hours and about 4% in the past week. This move could encourage traders hoping that the Token has overcome its difficult period.
But be careful. A closer look at the chart shows that this rally may not be what it seems. If the current signals play out, this rally could turn into a trap that leads to a new record low of $0.31.
Why the recovery looks like a trap
The first clue comes from the Money Flow Index (MFI), which tracks both price and volume to show buying or selling pressure. MFI has surged along with this rally, indicating buying activity as prices fall. On the surface, this looks positive — it shows traders are getting involved.
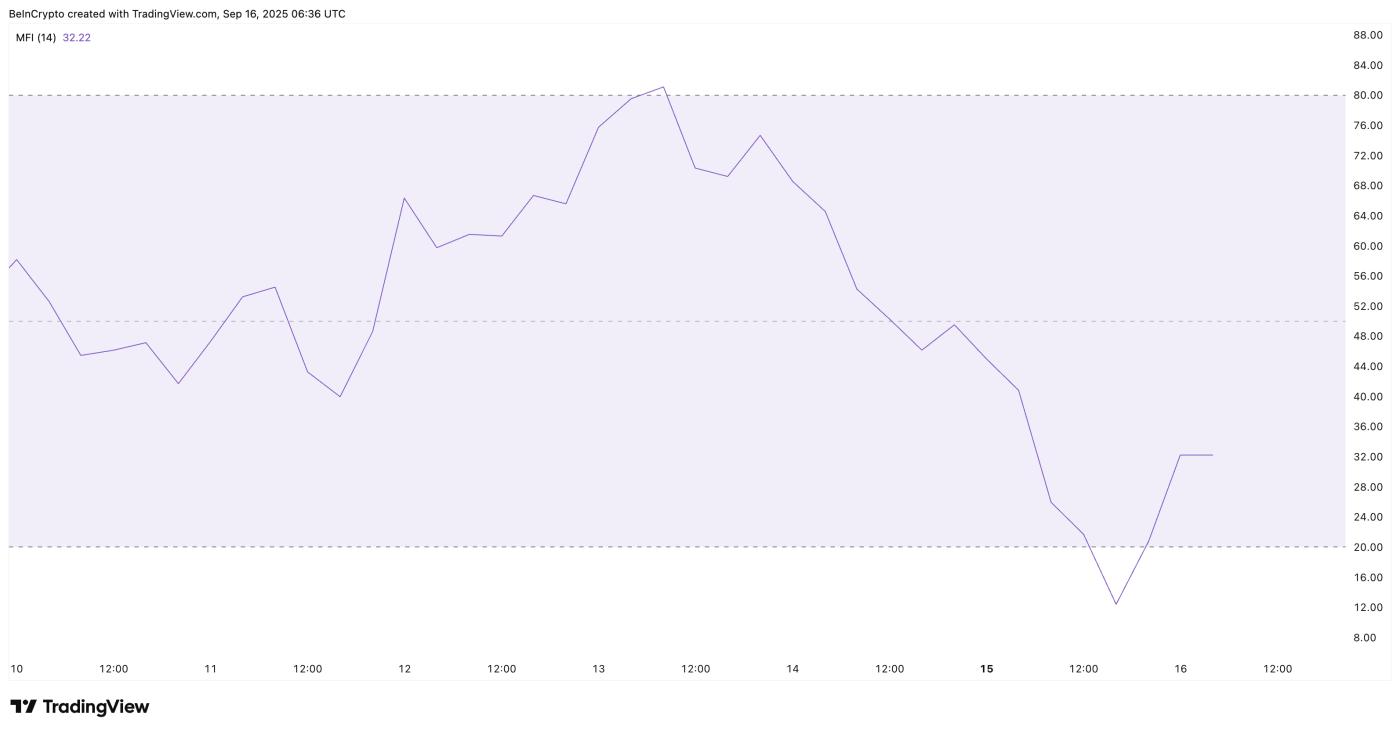 Dip Buying Continues For PI: TradingView
But Chaikin Money Flow (CMF) tells a different story as it drops and remains in deep negative territory. CMF measures XEM money is flowing into or out of an asset. Currently, CMF is at -0.11, indicating no significant inflows from large investors, only outflows.
Want more information about Token like this? Sign up for Editor Harsh Notariya's daily Crypto Newsletter here .
This means that Pi Coin 's recent rally is driven by retail investors, without support from large money flows. A mismatch between MFI and CMF usually signals weakness.
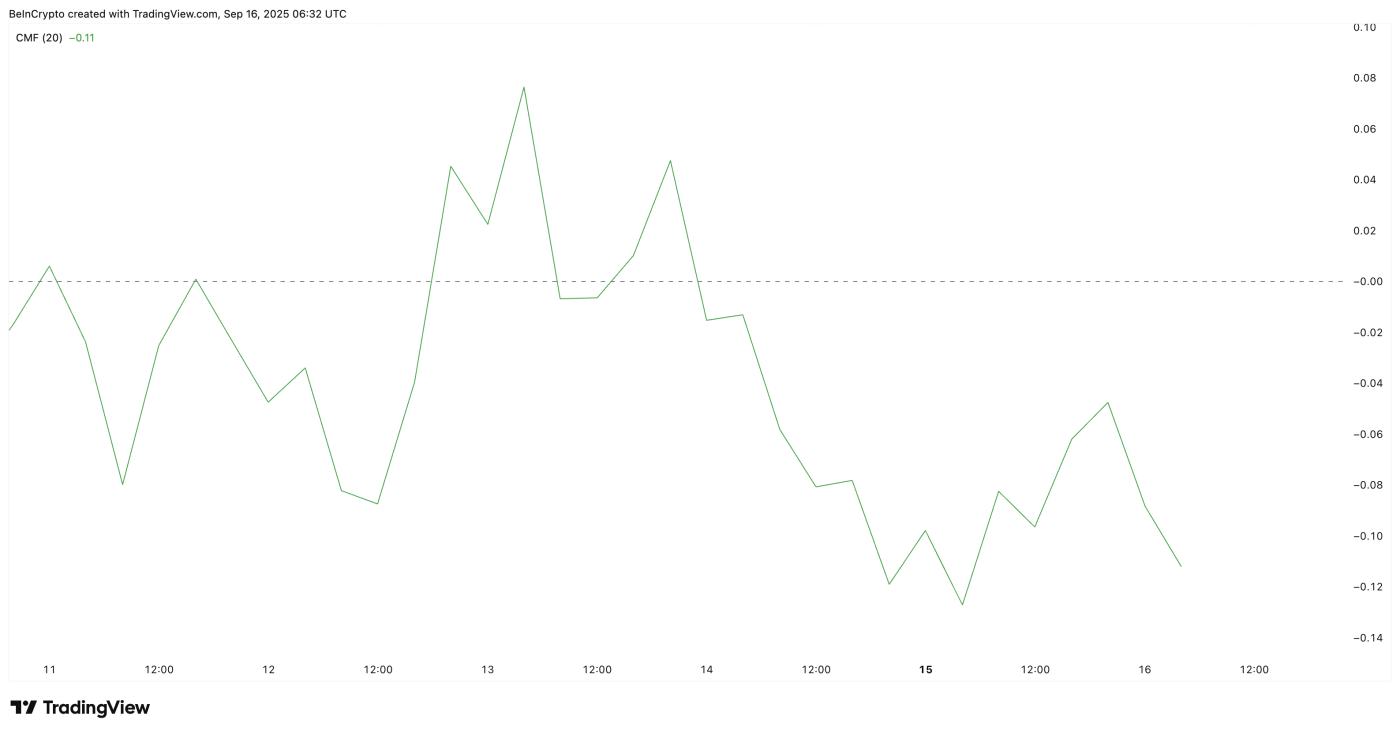 Lack Of Big Money Flowing Into Pi Network: TradingView
Looking more broadly, the daily RSI (Relative Strength Index) sheds more light on the situation.
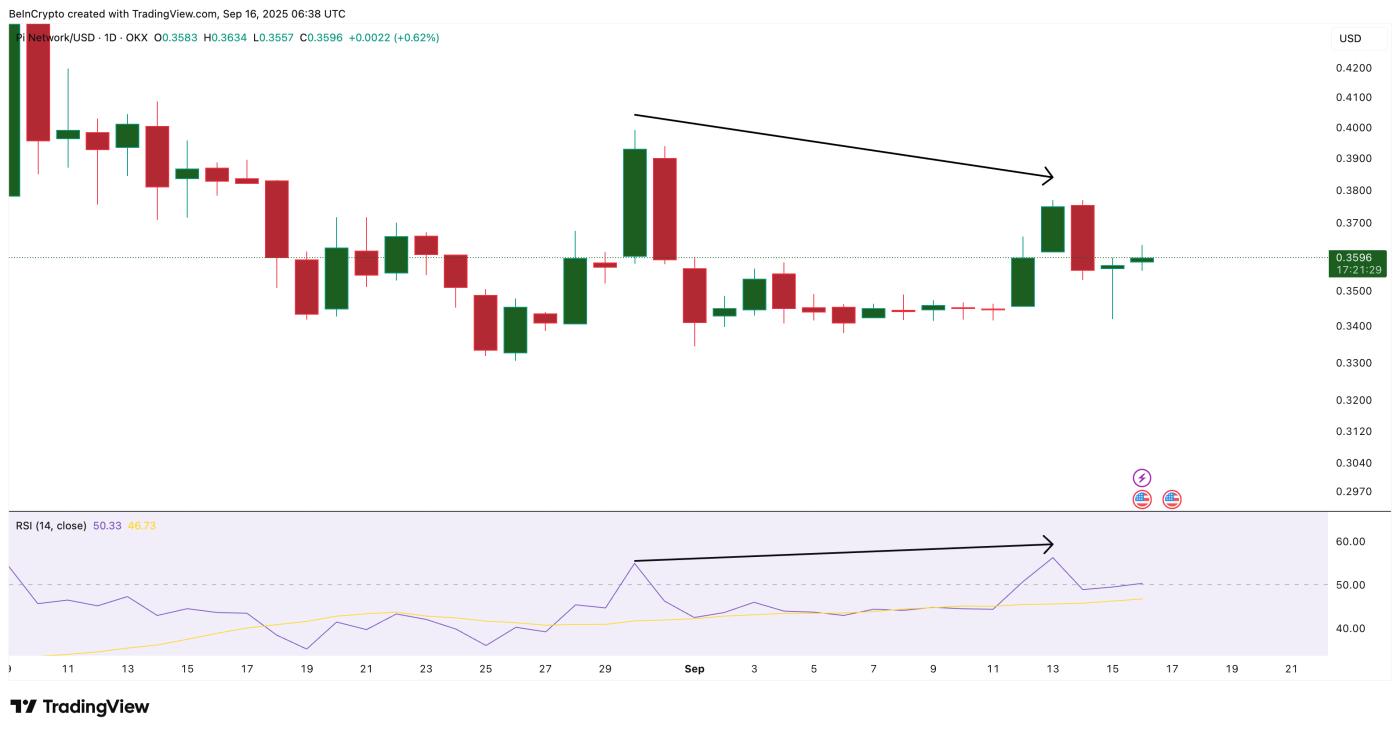 Pi Coin Bearishness: TradingView
RSI compares the size of recent rallies to recent declines. In this case, Pi Coin price made lower highs, but RSI made higher highs. This is a hidden divergence, which usually indicates a continuation of the downtrend. Combined, the MFI-CMF divergence and RSI divergence confirm that the rally may just be a trap.
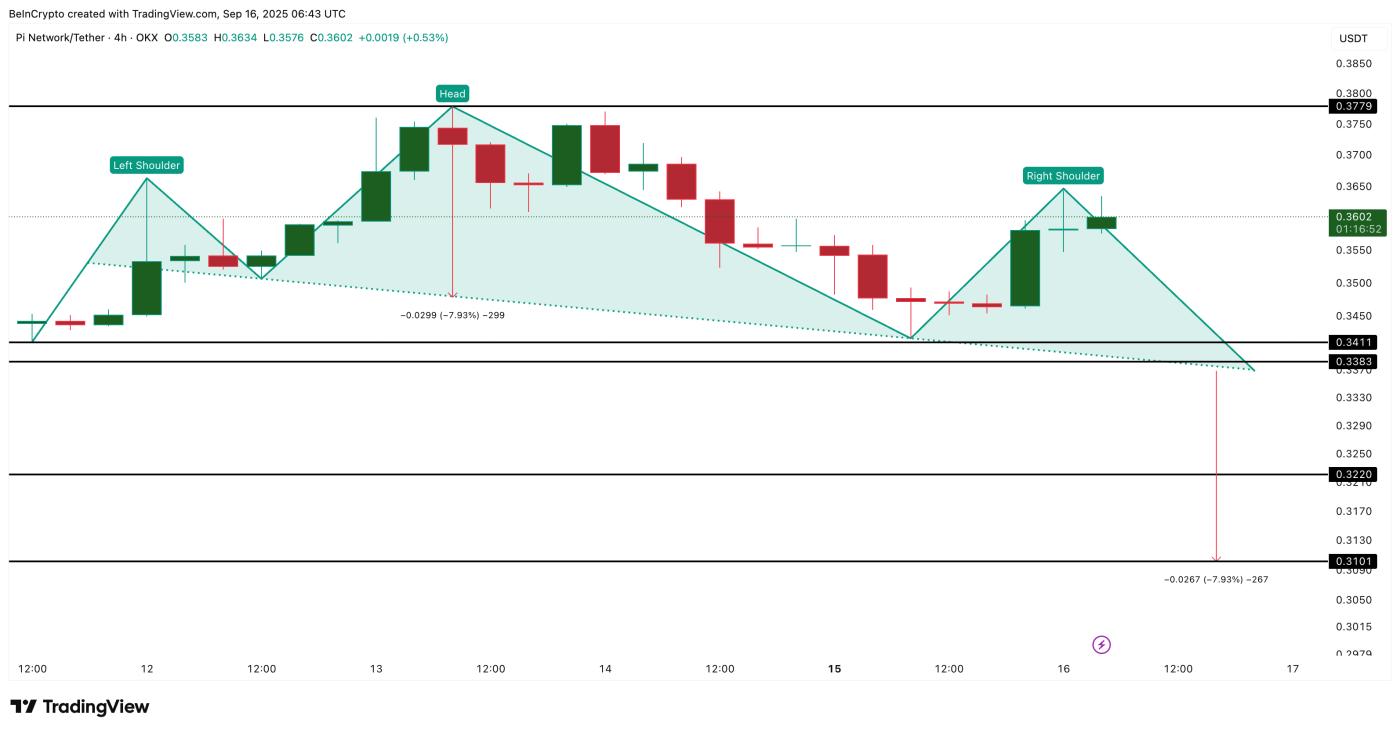
Pi Coin Price Chart Shows Trap With Important Levels
The 4-hour chart provides the final Shard of the puzzle. Pi Coin price appears to have formed a head and Vai pattern, a classic bearish setup. The right Vai top appears to be complete with the rally, with the neckline sitting around $0.33. If price breaks below that neckline, the target measures a drop to $0.31 — a new all-time low.
 Pi Coin Price Analysis: TradingView
That’s why this rally looks risky. While retail investors are driving the short-term gains, broader indicators and chart structure are pointing down.
There is one way to invalidate this bearish setup: Pi Coin must reclaim $0.37 with a strong close in 4 hours. That would break the bearish pattern's head area, restoring momentum to the bulls. Until that happens, this rally should be XEM as a trap that could push PI lower.


