

Trust Wallet Token (TWT) surged to $1.33 before correcting and is now trading near $1.10. It is still up 37% in the last 24 hours. The TWT price rally was widely tied to a fresh tweet from Binance founder CZ, but the real driver wasn’t just social hype.
Technicals show the breakout was primed in advance. Once targets were met, traders quickly booked profits. Now, the signs point to cooling momentum and rising selling pressure.
A Breakout Target Met, Followed by Heavy Profit-Taking
On the 2-day chart, the TWT price had been forming an inverse head-and-shoulders pattern. It is a classic setup that often signals a reversal, and that too with an immediate price target.
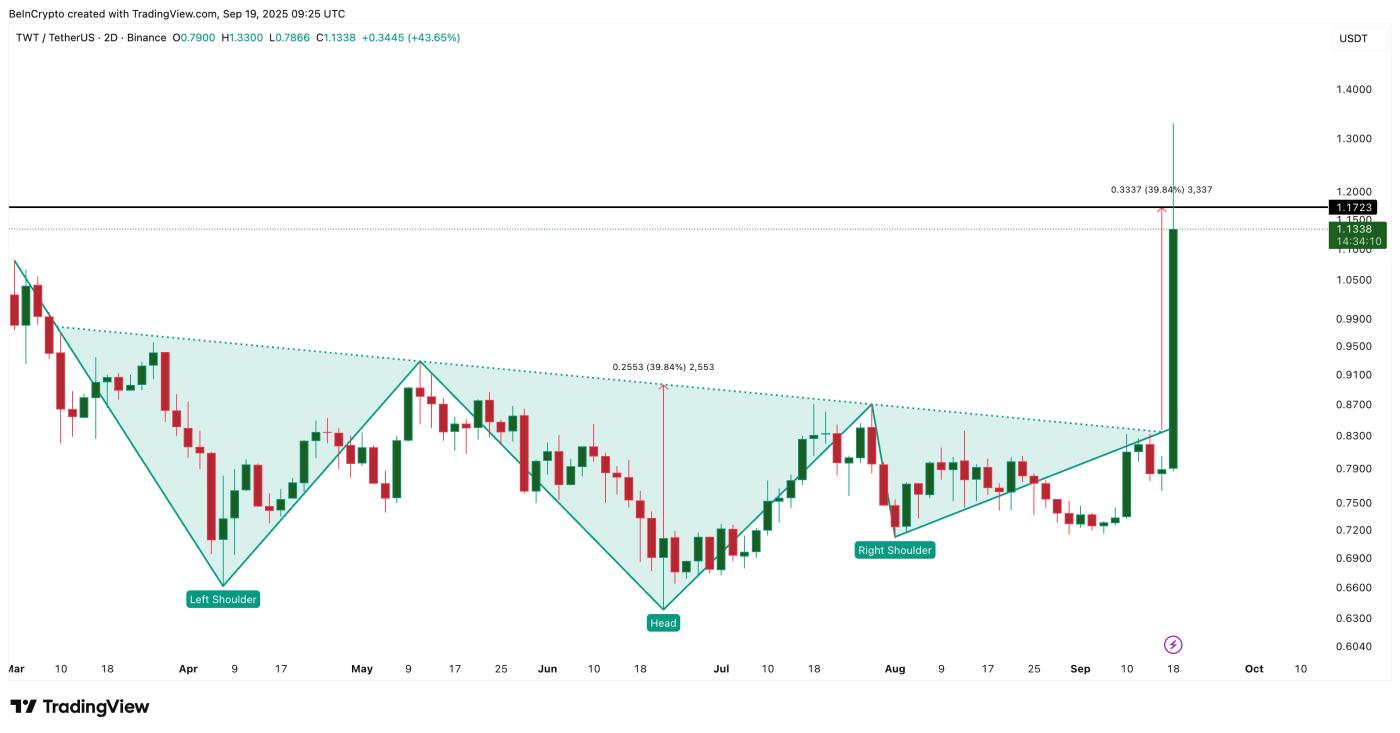 TWT Price Target: TradingView
The breakout was already in play before CZ’s quote re-tweet. The tweet simply accelerated the move and sent prices straight into the pattern’s projected target. Once that target was hit above $1.17 (the original target), smart traders supposedly began cashing out.
Want more token insights like this? Sign up for Editor Harsh Notariya’s Daily Crypto Newsletter here.
The result was a sharp wave of profit-taking. Exchange net flows flipped from –177,980 TWT on September 17 to +2.84 million just two days later — a 1,600% jump in tokens flowing onto exchanges. Such a surge signals that holders rushed to lock in gains, creating heavy near-term sell pressure.
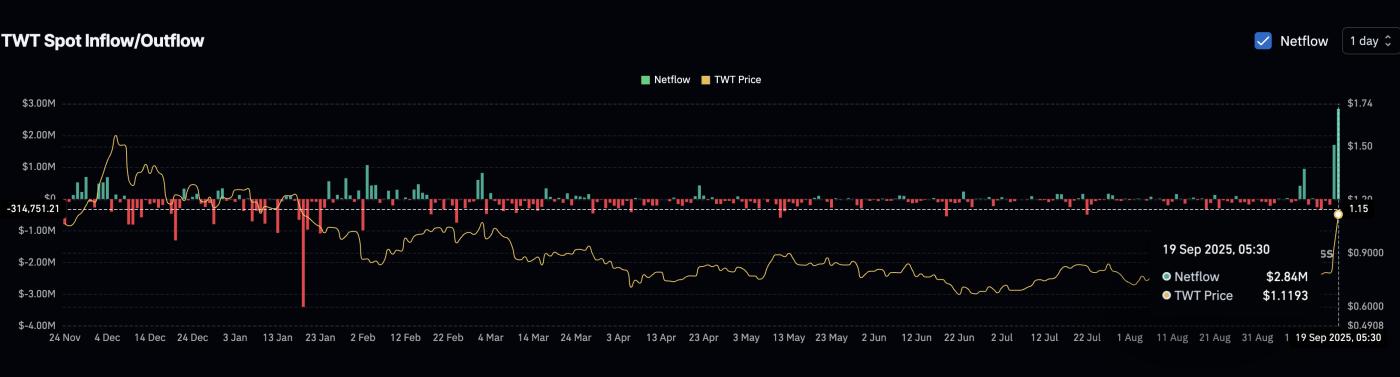 TWT Sellers Barge In: Coinglass
Normally, whale accumulation often offsets retail selling. But in this case, the opposite has played out. Wallets holding 10 million–100 million TWT have been trimming steadily since early September, cutting their stash from 248.9 million to 241.4 million. That’s a dump of almost $8.23 million at current prices.
These whales even booked profits with another sell-burst happening over the past 24 hours.
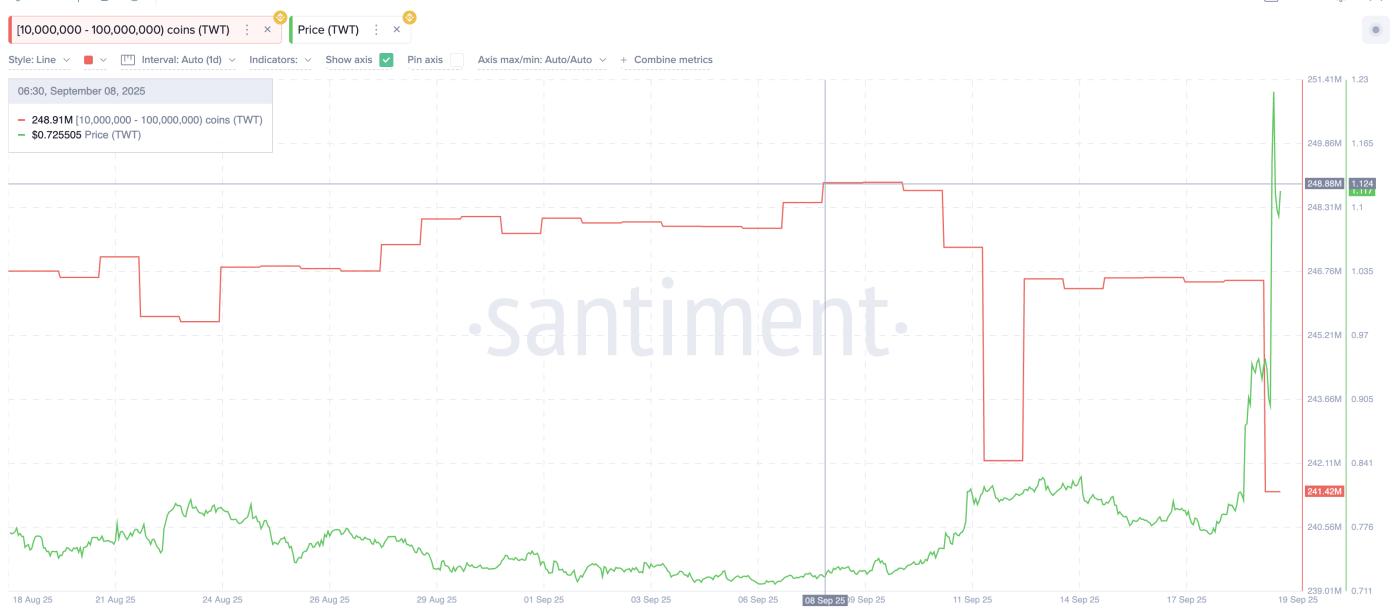 TWT Whales Keep Dumping: Santiment
That drop shows large holders have been reducing exposure even before retail joined in and are now booking profits too. This leaves little support to absorb the new selling pressure.
Bearish Divergence Keeps the TWT Price Correction Risks High
Despite the short-term excitement, long-term signals remain cautious. Since December 2024, TWT’s price has made lower highs while the Relative Strength Index (RSI) has made higher highs — a hidden bearish divergence. RSI is a momentum indicator that tracks whether buying or selling pressure is stronger.
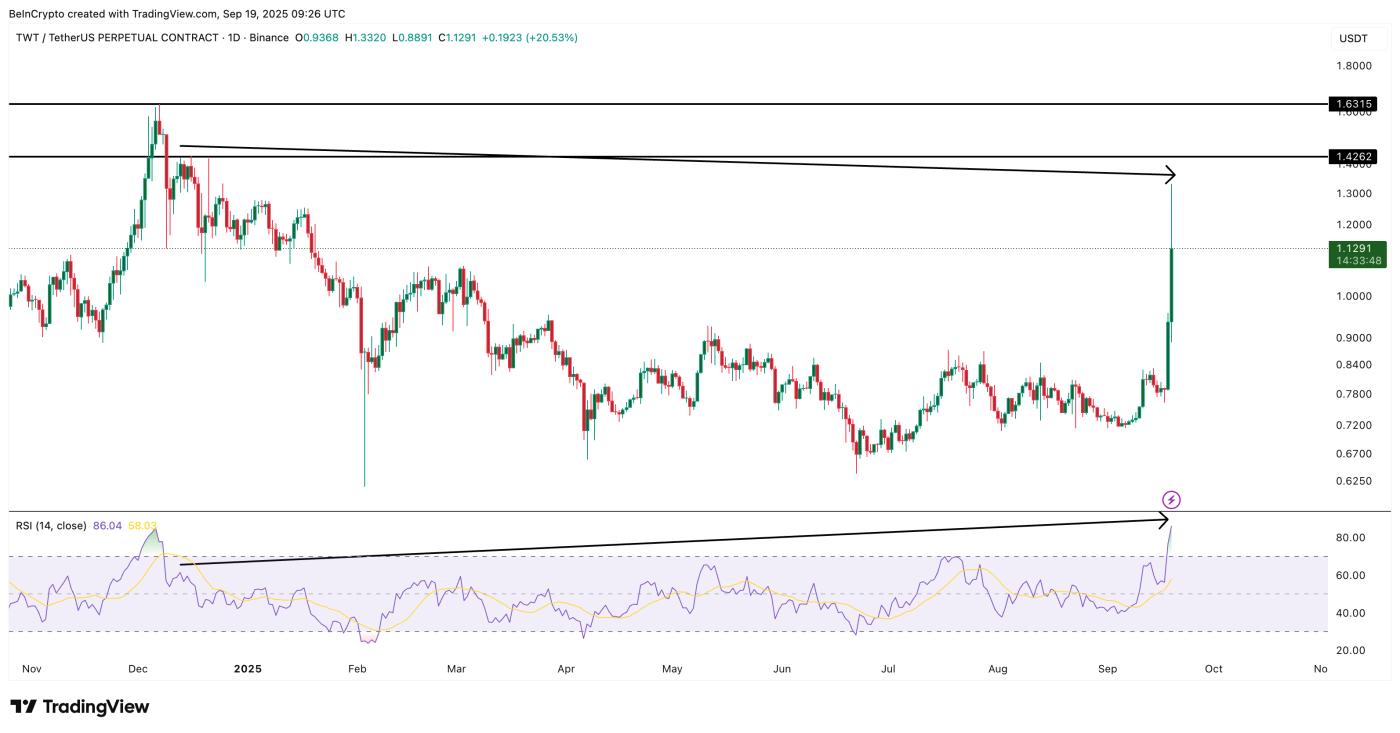 TWT Bearish Divergence In Play: TradingView
This suggests that momentum has not been enough to push prices into a true reversal, keeping the broader downtrend intact.
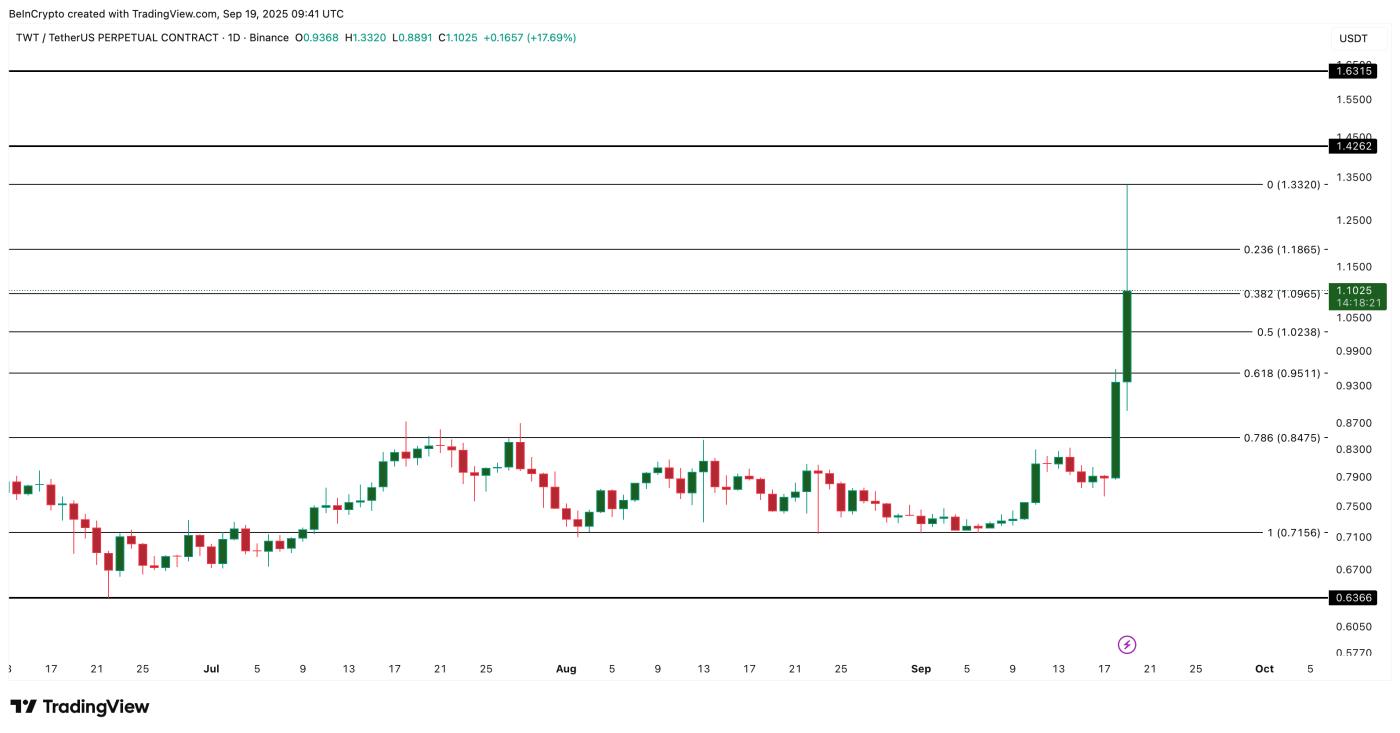
The price chart highlights the risk zones. Support sits at $1.00, followed by $0.84 and $0.71. A break under $0.71 could expose TWT to deeper losses toward $0.63. On the upside, only a daily close above $1.42 — and ideally $1.63 — would invalidate the bearish setup and get the market to put its trust back on the TWT price rally.
 TWT Price Analysis: TradingView
For now, the Trust Wallet Token (TWT) price rally looks like a move that met its target and sparked sharp profit-taking, not the start of a sustainable uptrend. Holding above $1.00 will be key to avoiding a deeper correction.


