

The US Federal Reserve convened its September FOMC meeting at 2:00 AM on the 18th and announced in Washington that it would lower the target range for the federal funds rate by 25 basis points to 4%-4.25%. This marked the first monetary easing of the year and the first rate cut under Trump's presidency. The resolution passed by an 11-1 margin, with Miran dissenting, advocating for a 50 basis point rate cut. Faced with the complex situation of slowing economic growth, cooling employment, and stubborn inflation, a more accommodative financial environment is needed to maintain the delicate balance between maximum employment and the 2% inflation target.
According to the latest dot plot voting content, the Federal Reserve will set the target interest rate for 2025 in the 3.5% range. There is a high probability that there will be room for a one-basis rate cut in the upcoming November and December meetings. However, the room for rate cuts in 2026 is very limited, and there may only be one rate cut.
Regarding this interest rate cut, Federal Reserve Chairman Powell also issued a statement that the U.S. unemployment rate is at a low point but has risen slightly, employment growth has slowed, and downside risks to employment have increased, reflecting a decrease in immigration and a decline in labor force participation. The slowdown in U.S. GDP growth mainly reflects a slowdown in consumer spending and an increase in U.S. inflation.
As for tariffs, their overall impact on inflation remains to be seen. The baseline scenario is that the impact of tariffs on inflation will be short-lived and limited, but the risk of persistent inflation needs to be managed. The balance of risks has shifted, with employment facing downside risks. Inflation risks are tilted to the upside, and the Federal Reserve is well-positioned to respond promptly.
Following the FOMC meeting, Bitcoin's price briefly surged above $117,300, a 2.1% increase from the previous day's low, in line with market expectations but modest. Over the long term, declining interest rates are reducing returns in the roughly $7.4 trillion money market, prompting investors to seek higher-yielding assets. As of writing, Bitcoin was trading at $117,740, a 1.12% increase over the past 24 hours.
While this round of rate cuts hasn't immediately sparked a price frenzy, it has already set the stage for subsequent capital shifts. With traditional yields declining and the US dollar weakening, both institutional and retail investors are likely to increase their investments to combat inflation and diversify risk, benefiting Bitcoin. In the short term, however, caution is warranted regarding the risk of a pullback as the bullish outlook fades.
Bitcoin four-hour chart
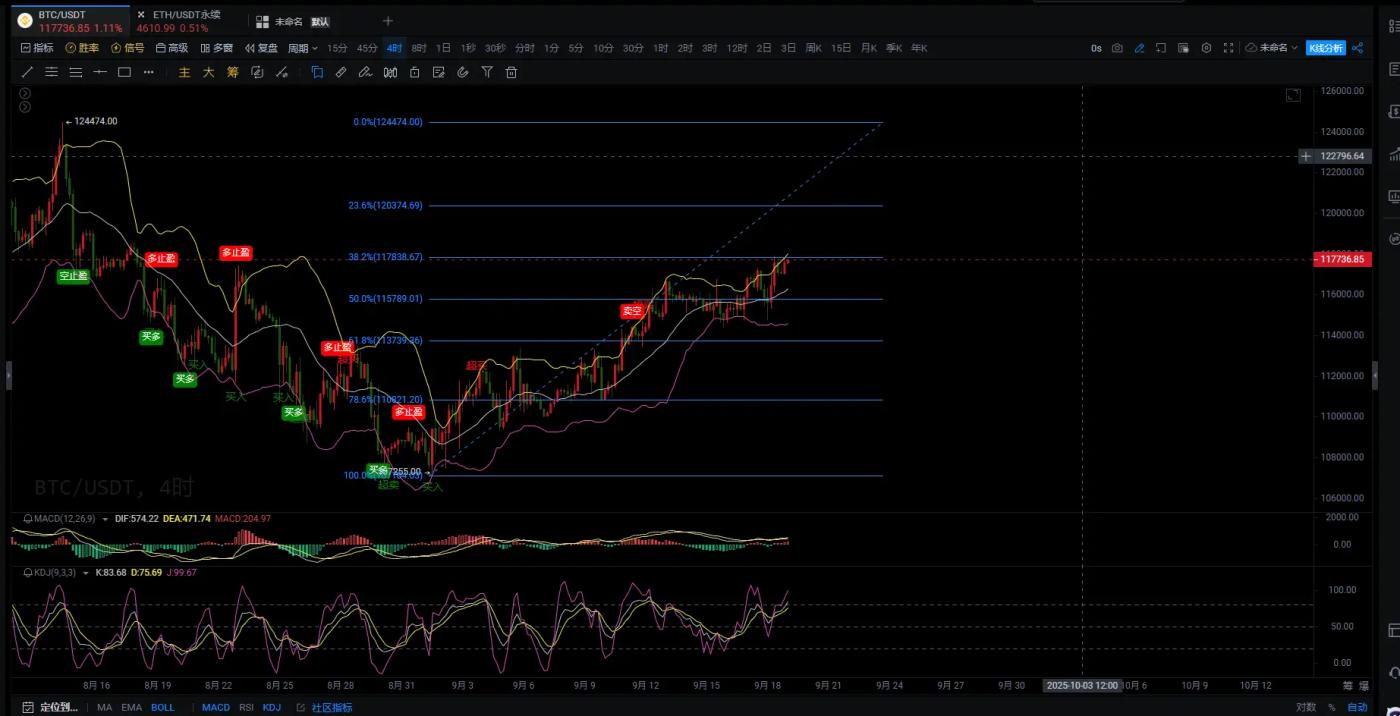
The current price is trading near the upper Bollinger Band, indicating bullish momentum but also suggesting a certain degree of overbought risk in the short term. The middle Bollinger Band lies between 115,500 and 116,300, providing crucial support for price corrections. The widening Bollinger Band opening suggests a potential for a larger directional move.
Looking at the MACD indicator, the DIF line is above the DEA line, forming a golden cross. The red MACD histogram suggests continued bullish momentum. However, the top of the histogram is showing signs of a slight contraction, suggesting a weakening of upward momentum. If the DIF and DEA begin to converge, it could signal a price correction. Conversely, if the MACD opening continues to widen, the uptrend is likely to continue, with a target range of 120,000-124,000.
The KDJ indicator shows a K-line value of 83, a D-line value of 75, and a J-line value close to 100, clearly in overbought territory and suggesting a short-term correction risk. A high-level death cross between the K-line and the D-line would trigger a short-term correction signal. However, if the KDJ indicator remains blunt at a high level without a rapid decline, the market is likely to continue its strong, volatile upward trend.
Based on the 107,555 low and 124,474 high, the price is currently fluctuating between 117,700 and 118,000, right around the 38.2% retracement level at 117,838. The 117,800-118,000 range (38.2% retracement) is currently the primary resistance level, with upward momentum expected upon a breakout. The 120,400-124,500 range (previous high) is a strong resistance level, a breakout of which would confirm a trend reversal. The 115,700-112,000 range (50% retracement) is the primary support level, while the 113,700-110,800 range is considered intermediate-term support. A break below the 112,000-110,800 range could signal a weakening trend.
Comprehensive analysis shows that Bitcoin's current price is at a critical watershed in its upward trend. If the price breaks through and stabilizes at 118,000, it will likely hit the previous high near 124,500. If the price encounters resistance at 118,000, it may fall back to the 115,700-116,300 range to seek support and accumulate momentum for a second charge.
To sum up, Daxian gives the following suggestions for reference
long it falls back to the 115700-116300 range, with the target at 117700-118000. After effectively breaking through and stabilizing, continue to look towards around 120000.


