Bitcoin is dancing dangerously close to the edge at $111,248, balancing a $2.22 trillion market cap and $51.78 billion in 24-hour volume like a circus act on caffeine. With price swings from $111,115 to $114,005, the charts are throwing out more mixed signals than a late-night trading group chat.
Bitcoin
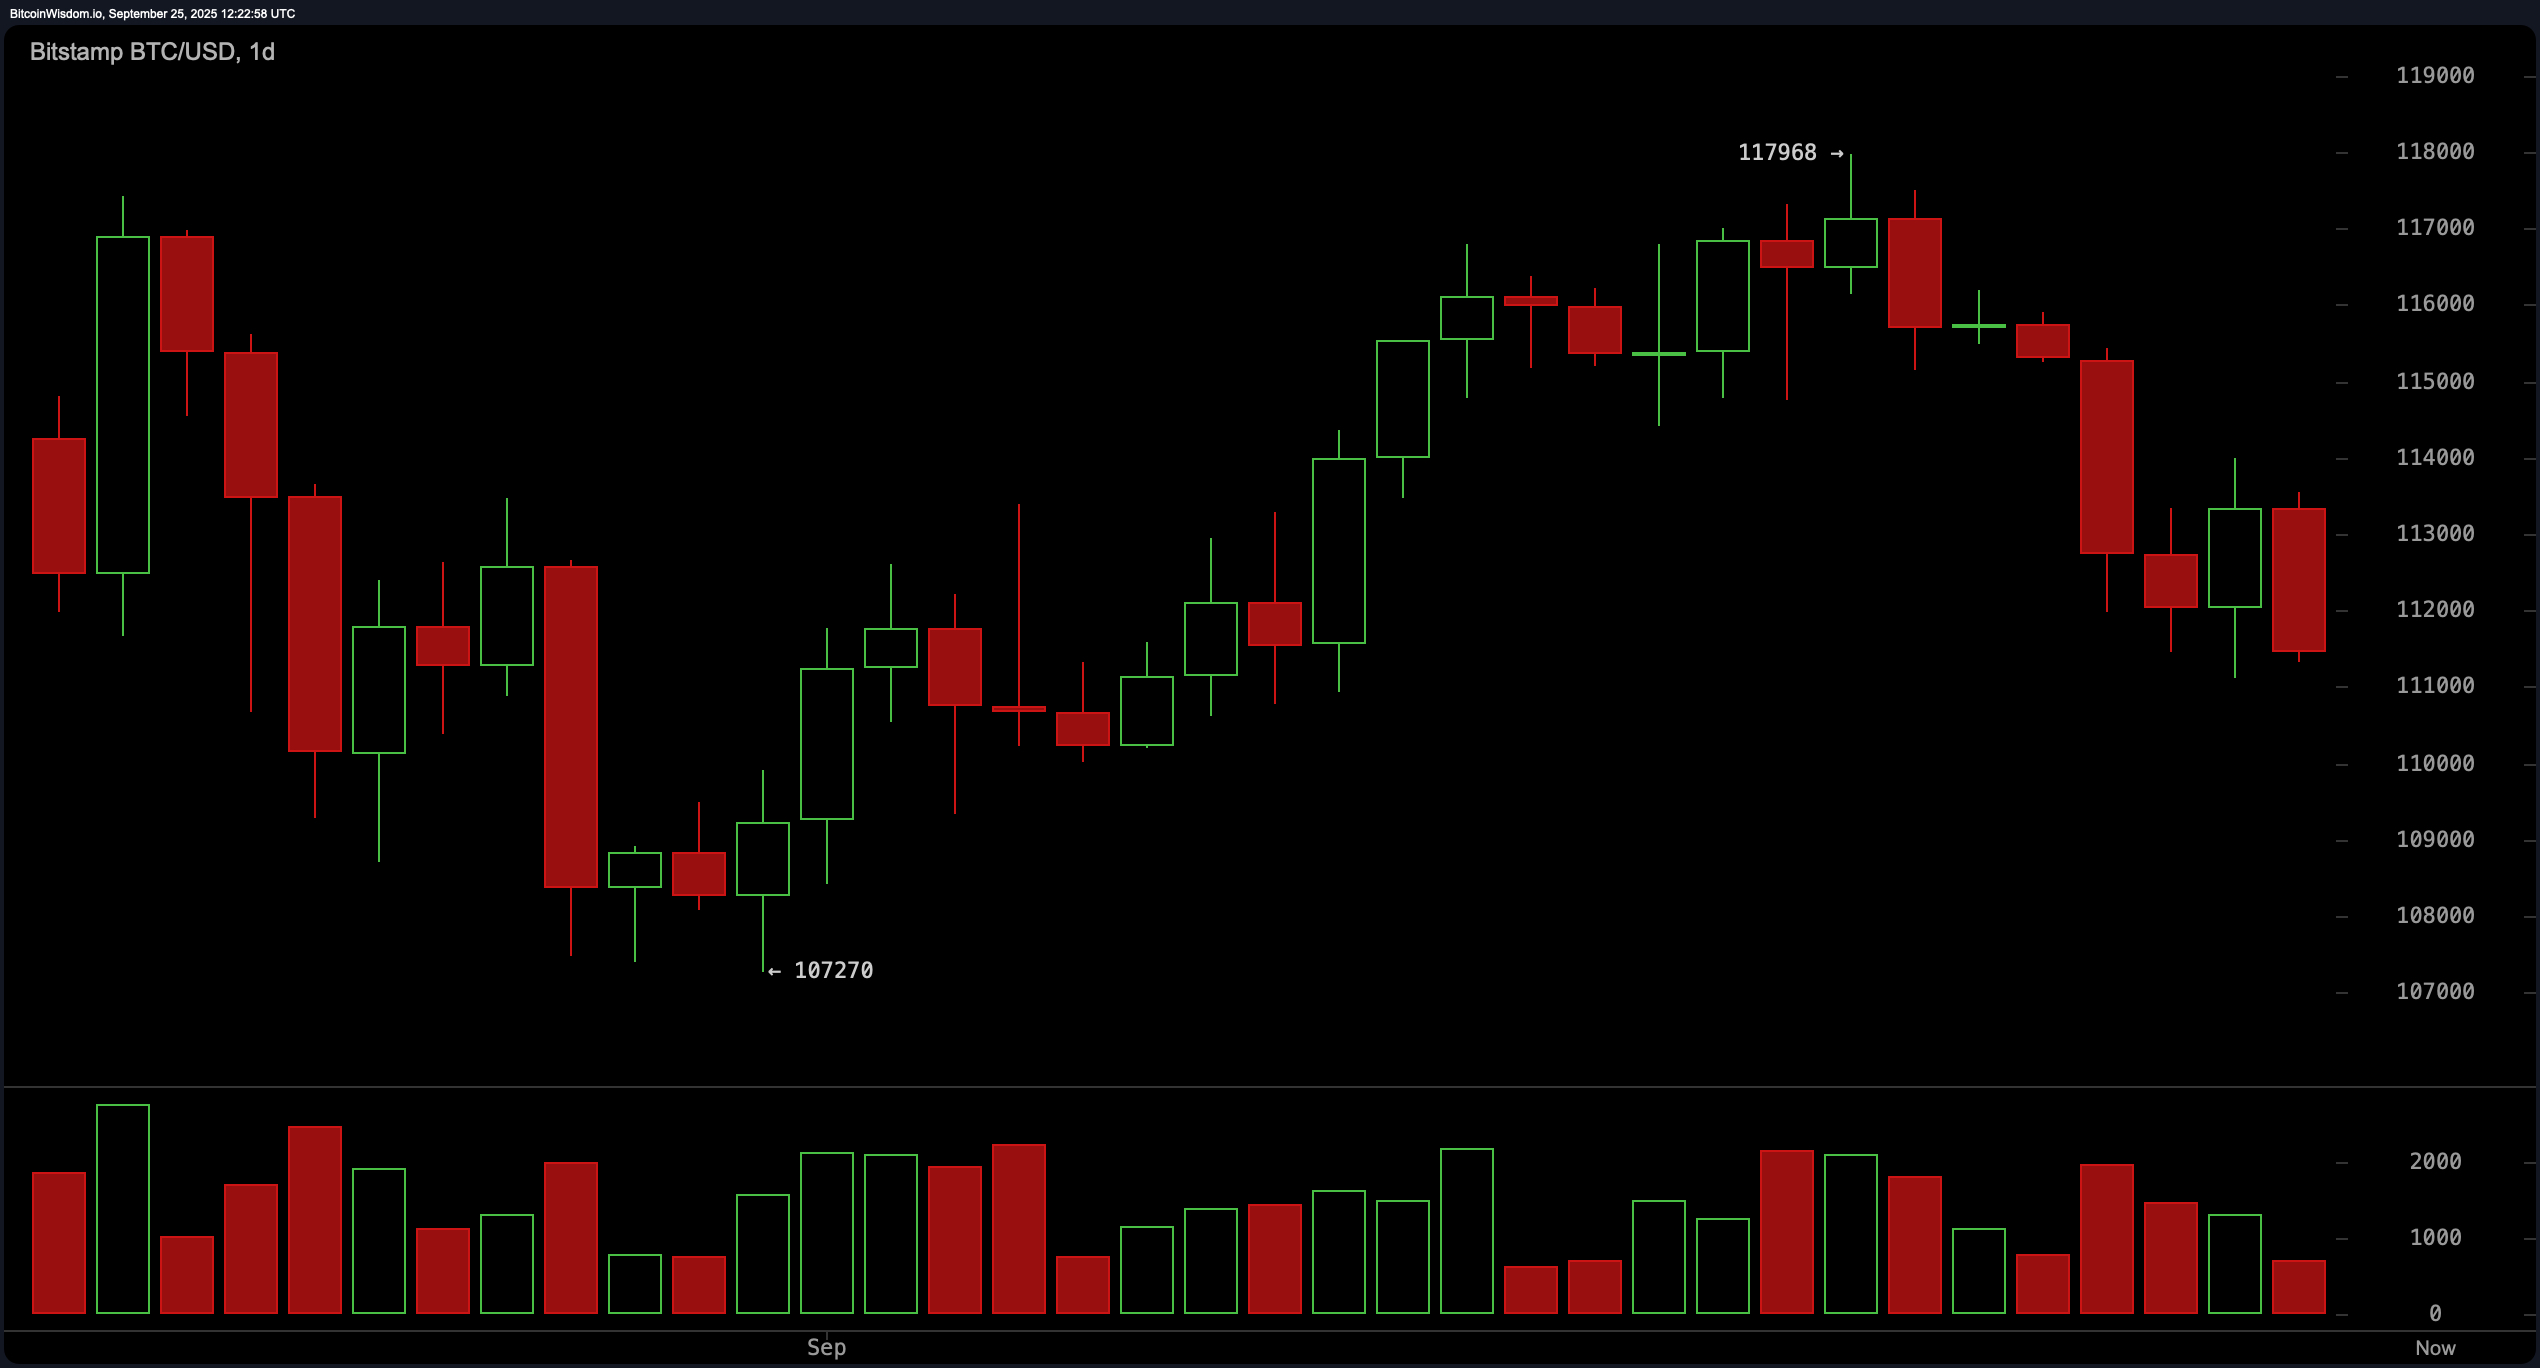
The daily bitcoin chart is giving serious commitment issues. After peaking at $117,968, bitcoin has decided to throw a fit and reverse course, dipping into a moody short-term downtrend. The tell-tale sign? A subtle head-and-shoulders formation that even your least-technical friend could recognize after two glasses of cabernet.
Volume is trailing off faster than hype after an NFT mint, which hints that the recent bearish momentum may be losing its bite. However, bulls better hold that $111,000 support like it’s their retirement plan—because if it breaks, we’re eyeing the $107,000 dungeon next.
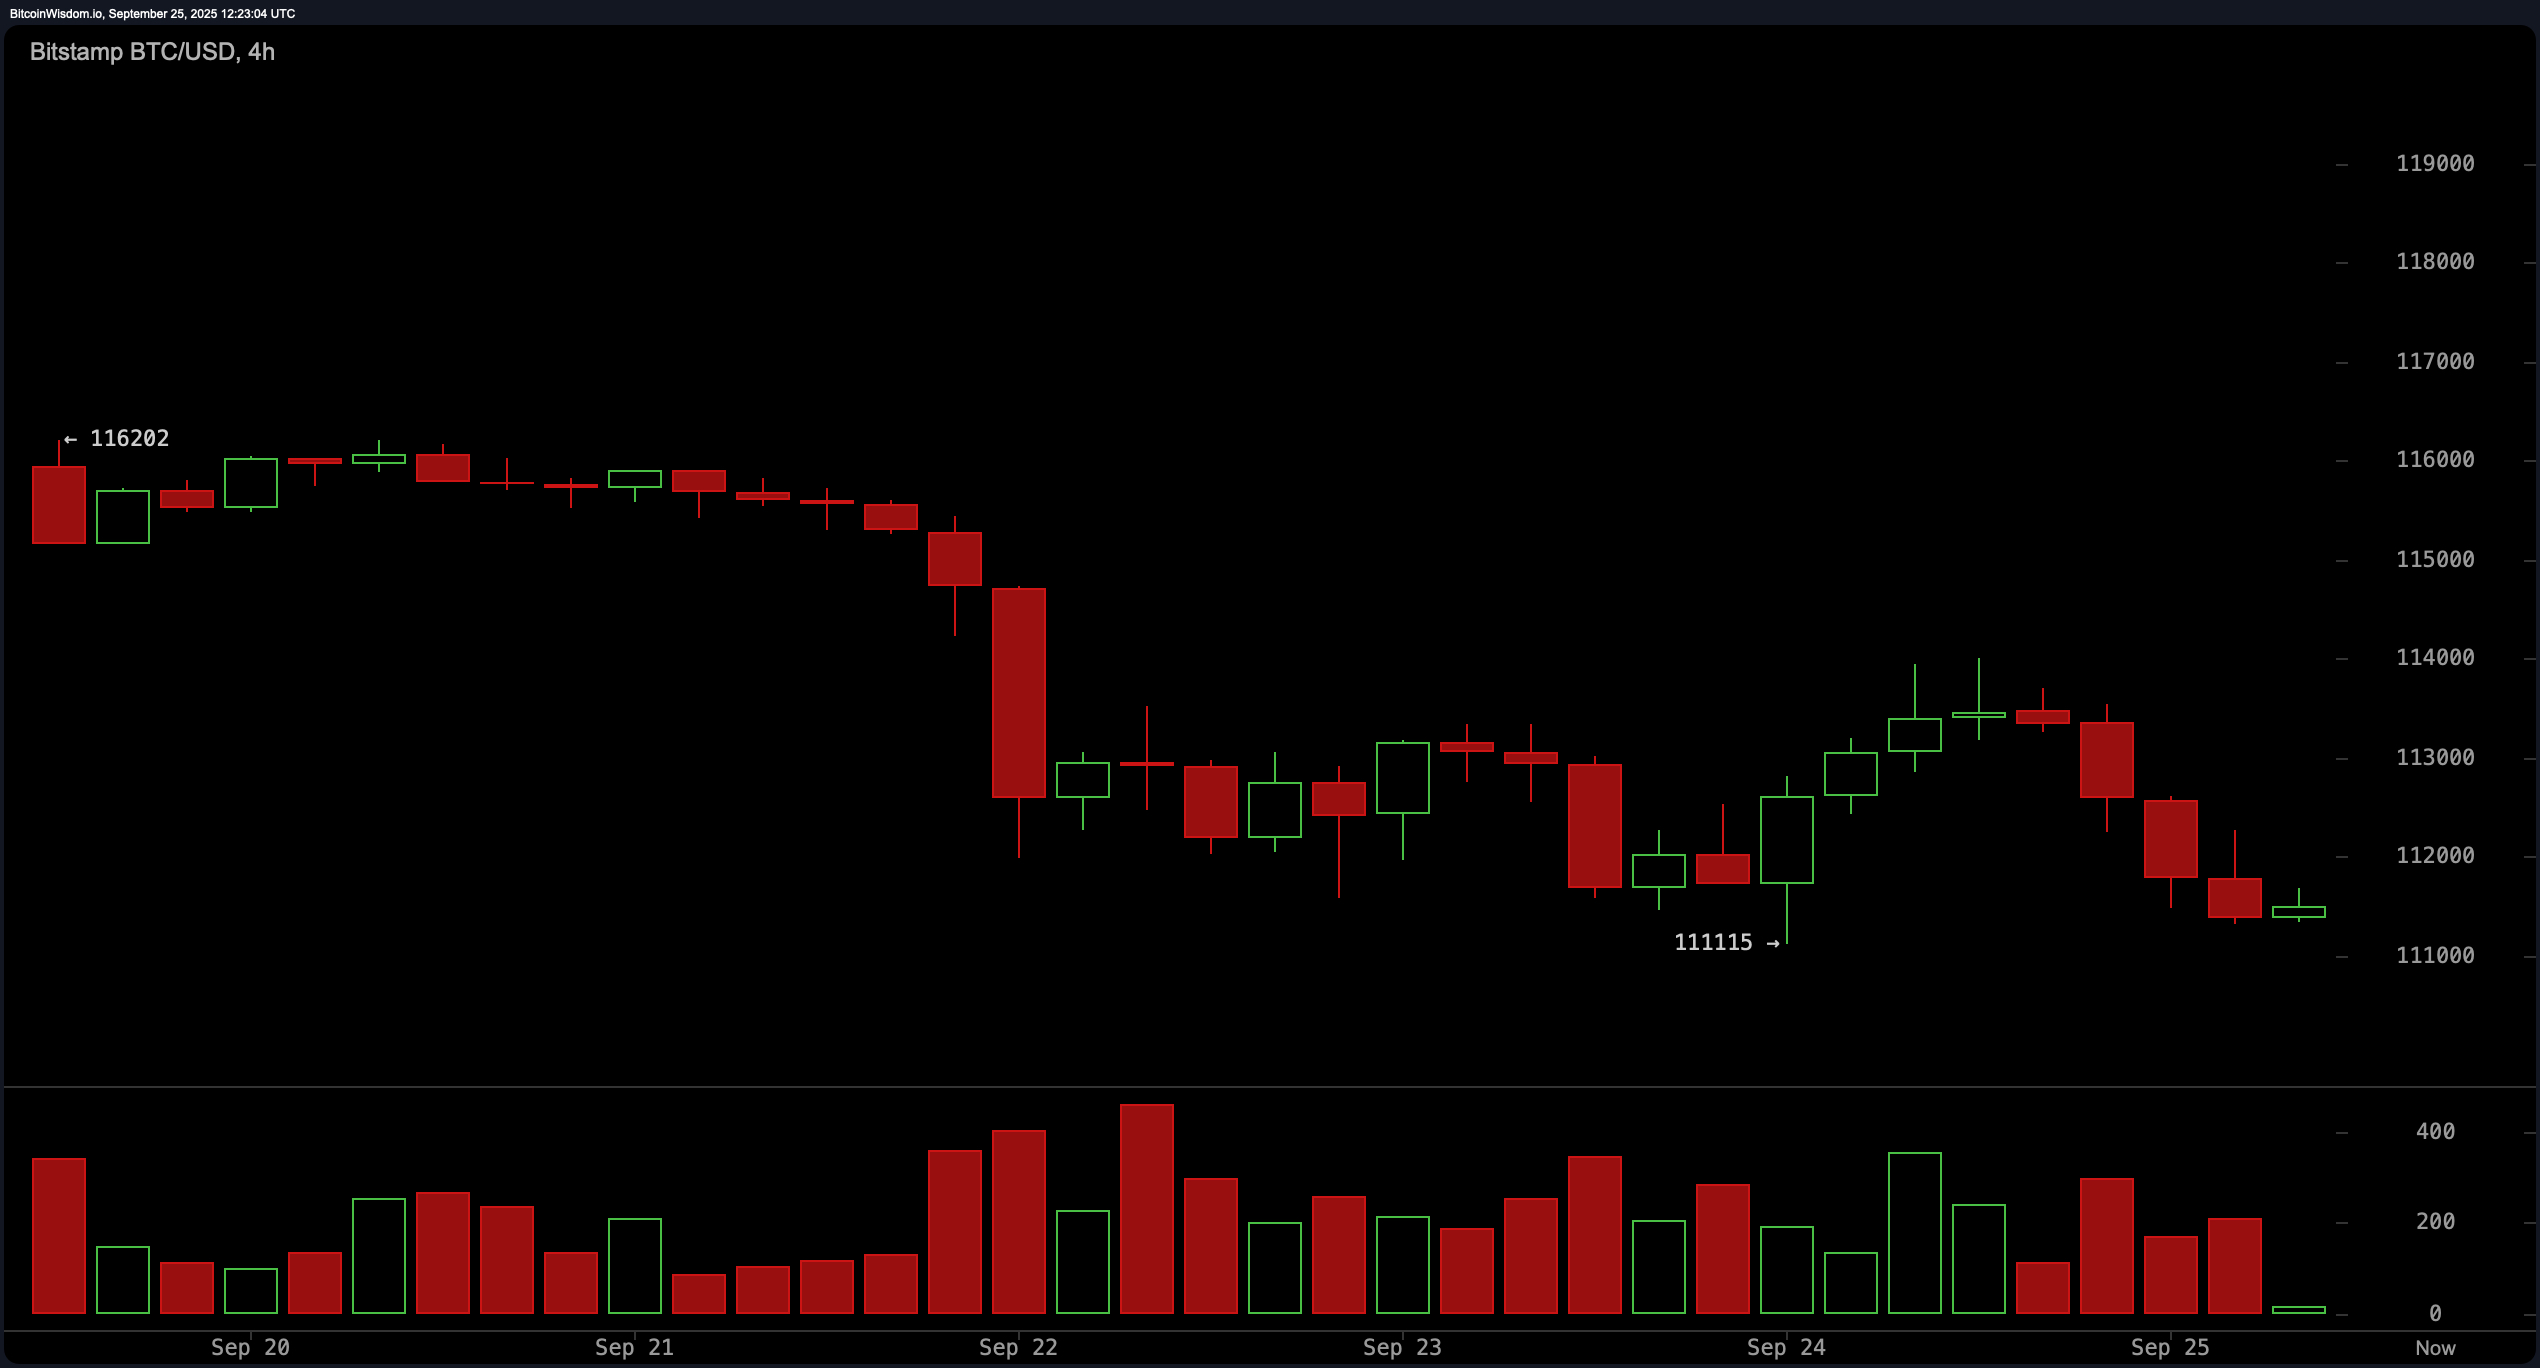
Moving to the 4-hour bitcoin chart, the vibe is straight-up bearish, and bitcoin is not even pretending otherwise. With lower highs and lows parading across the chart, and strong selling pressure after failing to break above $114,000, the sellers clearly still hold the mic. If price action flirts with the $113,500 range and fails to commit, shorting into resistance might be your best dance move. But if bitcoin does manage to pop its head above $113,500 with conviction, it could attempt a small swing north—assuming momentum dares to play nice.
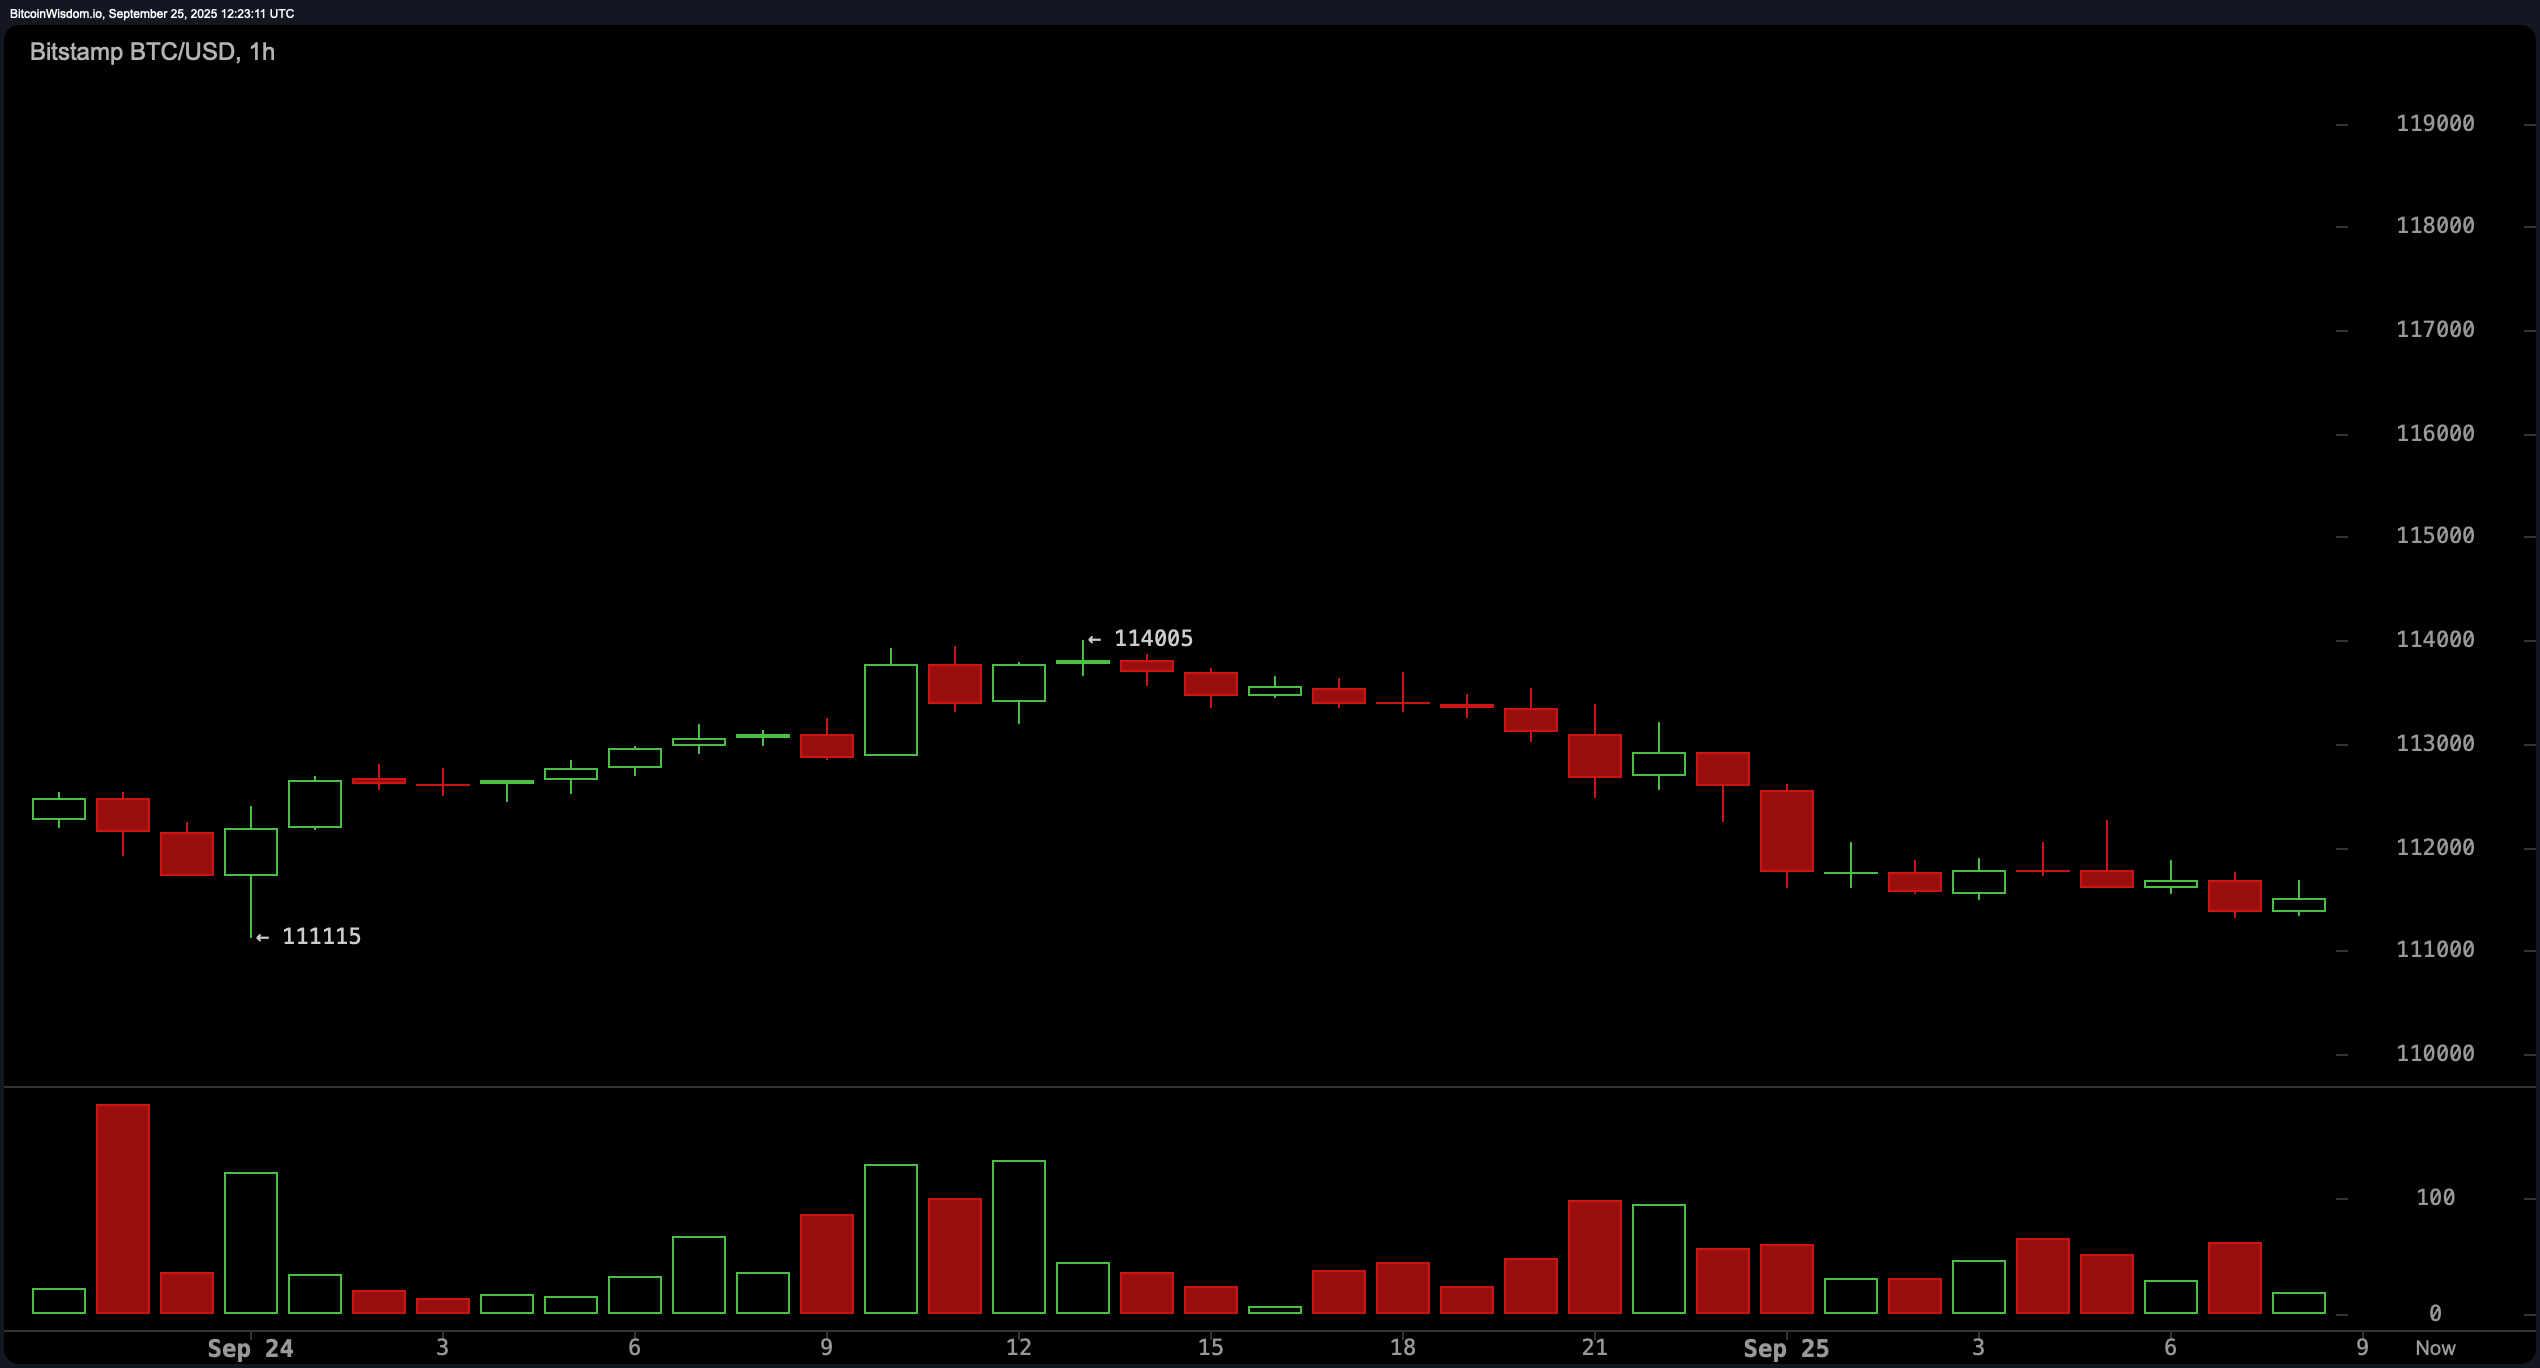
On the 1-hour bitcoin chart, things look like your favorite indecisive friend at brunch—stuck. A rounding top and sideways grind near support at $111,115 suggest that the market is either cooking up a breakdown or desperately forming a base. Volume is whisper-quiet, like a suspicious canine. A break below $111,000 with volume would crack this lull wide open and send us into the $109,500–$110,000 territory faster than you can say “stop-loss.” Intraday scalpers should keep their eyes glued to the $112,200 level for a quick rebound opportunity if volume returns with gusto.
Now, let’s talk oscillators—and no, they’re not just fancy finance toys. The relative strength index (RSI) at 42 is giving off “meh” vibes, joined by the Stochastic at 18 and the commodity channel index (CCI) at -73, all pointing to neutrality. The average directional index (ADX) sits at a limp 17—about as directional as a lost tourist. The Awesome oscillator shows a neutral 463, while momentum drags itself into a bearish territory at -3,814. But the real diva here is the moving average convergence divergence (MACD), showing a very bearish -48. Let’s just say if these indicators were in a band, they’d be playing a slow breakup ballad.
Finally, the moving averages (MAs) have taken off their bull hats. Every single short- and mid-term exponential moving average (EMA) and simple moving average (SMA)—from 10 to 100 periods—is throwing shade, all issuing bearish signals. Only the long-term 200-period EMA and SMA are hanging on to optimism, like they know something we don’t. But let’s be real: unless bitcoin stages a fierce comeback above $114,000, that optimism might be more denial than insight.
Bull Verdict:
If bitcoin manages to claw its way above $113,500 with strong volume—and ideally close the day above $114,000—it could invalidate the short-term downtrend and trigger a short-covering rally. With long-term moving averages still flashing bullish signals and momentum teetering near oversold territory, the bulls might just have one more dance left in them.
Bear Verdict:
Unless the $111,000 support zone pulls off a miracle hold, bitcoin looks poised for a slide toward $107,000 or even $105,000. With almost every oscillator dragging its feet and the moving averages dressed in full bear regalia, this price action smells more like a trap door than a springboard.