

#SOL
- Oversold Bounce Potential: SOL trading near Bollinger Band support with improving MACD suggests technical rebound likelihood
- Fundamental Divergence: Strong buy wall contrast with declining network activity creates mixed sentiment environment
- Catalyst Dependency: Price recovery hinges on breaking key technical levels and improving on-chain metrics
SOL Price Prediction
SOL Technical Analysis: Oversold Conditions Suggest Potential Rebound
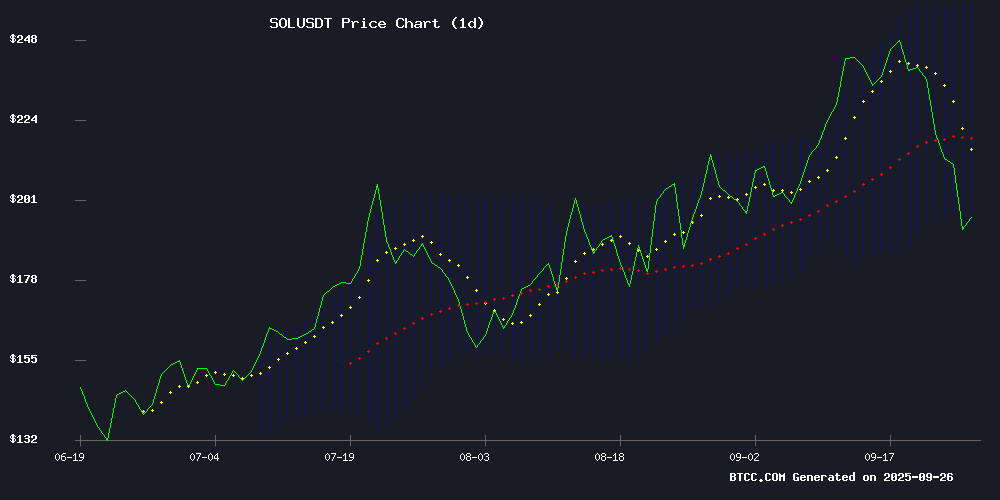
SOL is currently trading at $196.41, significantly below its 20-day moving average of $226.35, indicating bearish momentum. However, the MACD histogram shows positive divergence at 10.5357, suggesting weakening downward pressure. The price is hovering NEAR the lower Bollinger Band at $194.22, which often serves as support during oversold conditions.
"The technical setup shows SOL is testing key support levels," said Mia, BTCC financial analyst. "While below the 20-day MA, the MACD improvement and Bollinger Band positioning hint at potential stabilization."
Mixed Sentiment as Network Activity Declines Despite Bullish Catalysts
Recent headlines present conflicting signals for SOL. Positive developments include SBF's return speculation sparking interest and a substantial $300 million buy wall indicating institutional accumulation. However, concerns persist as solana faces its first September decline in four years amid declining network activity.
"The market sentiment is cautiously optimistic despite short-term headwinds," noted Mia. "The buy wall formation suggests smart money is positioning for recovery, though network metrics need monitoring."
Factors Influencing SOL's Price
SBF’s ‘gm’ Tweet Sparks Speculation of Comeback Amidst New Solana-Based Perp Dex
Sam Bankman-Fried's cryptic 'gm' tweet has reignited speculation about his potential return to the crypto scene. The post coincided with the launch of a Solana-based perpetual futures DEX by a former FTX COO, fueling rumors of his involvement.
The new project, Pacifica, employs a tokenless model reminiscent of SBF's past strategies. Users earn points instead of tokens, drawing parallels to FTX's early success with Solana. At its peak, SBF's $0.20 solana investment ballooned to a $15 billion position before contributing to FTX's collapse.
Market observers note striking similarities between ASTER's recent rally and SBF's infamous Solana playbook. The timing raises questions about whether this is mere coincidence or coordinated action by SBF's inner circle.
Solana Price Prediction: $300M Buy Wall Signals Potential Bullish Reversal
Solana emerges as a standout performer in a sliding market, with its price action defying broader volatility. The asset recently touched $253 before retracing, yet institutional interest remains robust—evidenced by $315M in fresh accumulation at the $200 support level.
A $300M buy wall has materialized, coinciding with whales withdrawing 1.5M SOL from exchanges in 48 hours. The network's fundamentals strengthen as stablecoin market cap doubles to $12B since January, while DEX dominance persists with $4.5B daily volume despite meme coin trading declines.
Solana Set to Break 4-Year September Win Streak as Network Activity Slumps
Solana's SOL token is on track to end September in the red, snapping a four-year streak of monthly gains. Historical data shows SOL climbed 29% in September 2021, 5.38% in 2022, 8.22% in 2023, and 12.5% in 2024—but this year's downturn reflects broader market pressures and declining on-chain activity.
The token peaked at $253.51 on September 18 before shedding 17% of its value. Artemis data reveals a 25% drop in daily active addresses on Solana protocols this month, with just 3.04 million unique wallets interacting with the network. Waning user engagement and bearish sentiment have converged to challenge Solana's seasonal resilience.
Solana (SOL) Oversold Conditions Spark Buy-the-Dip Speculation
Solana's native token SOL has plunged 20% from its September 18 peak to $203.78, triggering technical indicators flashing oversold signals across multiple timeframes. The 4-hour, 5-hour, and 12-hour charts all show RSI levels reminiscent of past rebounds — including a historic surge from $155 to $250 earlier this year.
Traders are noting layered bids stacking NEAR the $200 support level, suggesting institutional accumulation. 'SOL is disgustingly oversold,' remarked one analyst, recalling identical conditions preceding previous parabolic rallies. The token's volatility profile mirrors historical bottoms where rapid 50%+ recoveries occurred within weeks.
How High Will SOL Price Go?
Based on current technical and fundamental analysis, SOL could potentially reach $250-$280 in the medium term if key resistance levels are broken. The $300 million buy wall provides substantial support around current levels, while oversold technical conditions suggest upward momentum may build.
| Price Target | Probability | Key Conditions |
|---|---|---|
| $220-240 | High | MACD turns positive, holds above $200 |
| $250-280 | Medium | Break above 20-day MA, network activity recovery |
| $300+ | Low | Sustained volume increase, major catalyst required |
"The path to $250 appears feasible if SOL can reclaim the $226 moving average," said Mia. "However, traders should watch for sustained network improvement to confirm any bullish thesis."


