

OKB has emerged as one of the strongest performers in the market, climbing nearly 10% in the past 24 hours. This comes as Bitcoin and other leading digital assets trade lower, pushing the global crypto market cap down by 2%.
On-chain data shows rising demand for OKB, and if this momentum holds, the altcoin could close September above the key $200 level.
OKB Rally Builds Steam
OKB’s price rally comes amid a notable spike in demand, with its daily trading volume surging almost 200% in the past day. This totals $293 million at press time, suggesting that the rally is not driven by speculation.
For token TA and market updates: Want more token insights like this? Sign up for Editor Harsh Notariya’s Daily Crypto Newsletter here.
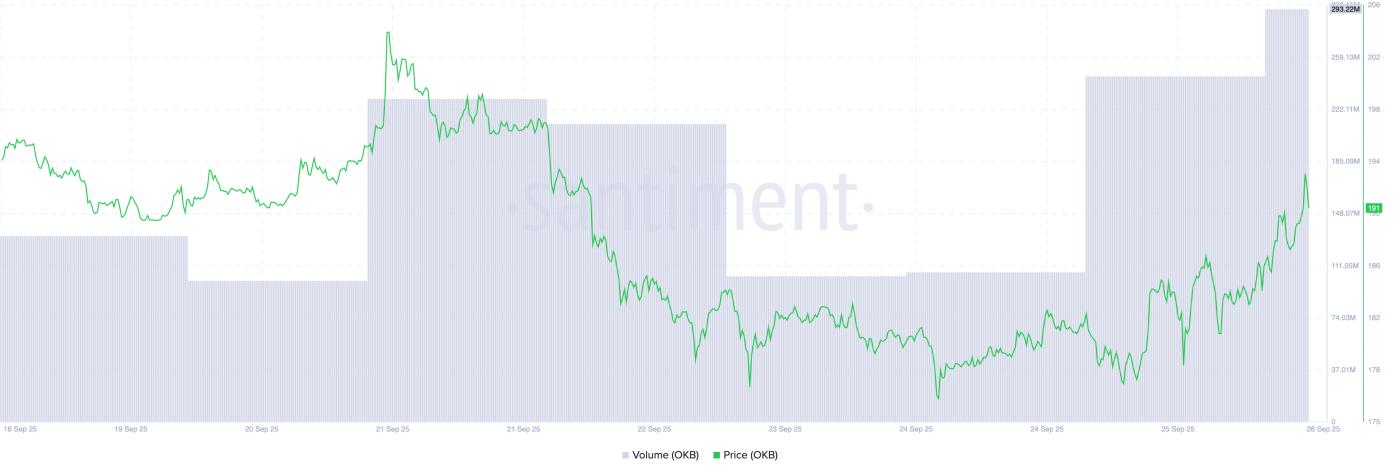 OKB Price/Trading Volume. Source: Santiment
When an asset’s price rises alongside a sharp increase in trading volume, it signals strong conviction among buyers rather than short-term hype.
Higher volumes mean more market participants are involved in the move, lending credibility to OKB’s rally and reducing the risk of a quick reversal. If demand continues at this pace, the increased depth in the market could provide the support needed for OKB to test the $200 level.
Further, readings from the daily chart show that OKB trades solidly above its Super Trend Line, reflecting a strong bullish tilt in market sentiment. At press time, this indicator forms dynamic support below OKB’s price at $169.35.
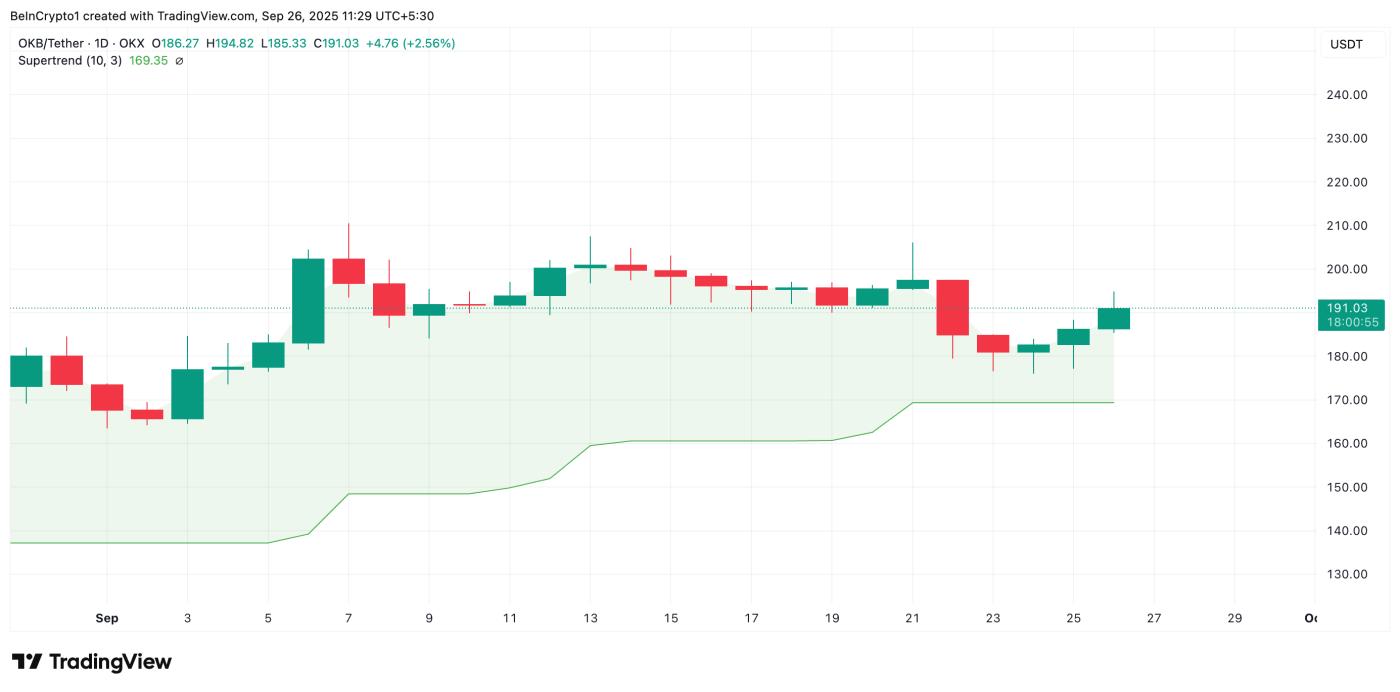 OKB Super Trend Indicator. Source: TradingView
The Super Trend indicator tracks the market’s direction by placing a line above or below the price chart based on the asset’s volatility.
As with OKB, when an asset’s price trades above the Super Trend line, it signals a bullish trend. It highlights that the market is in an uptrend that may persist as buying pressure dominates.
OKB Bulls Target $210, Yet Profit-Taking Threatens a Pullback
As September nears its close, all eyes are now on whether this momentum will be enough to propel the token toward the $200 milestone. For that to happen, OKB must first break above its next major resistance, which lies at $196.84.
A successful breach of this level could propel its price toward $210.57 in the near term.
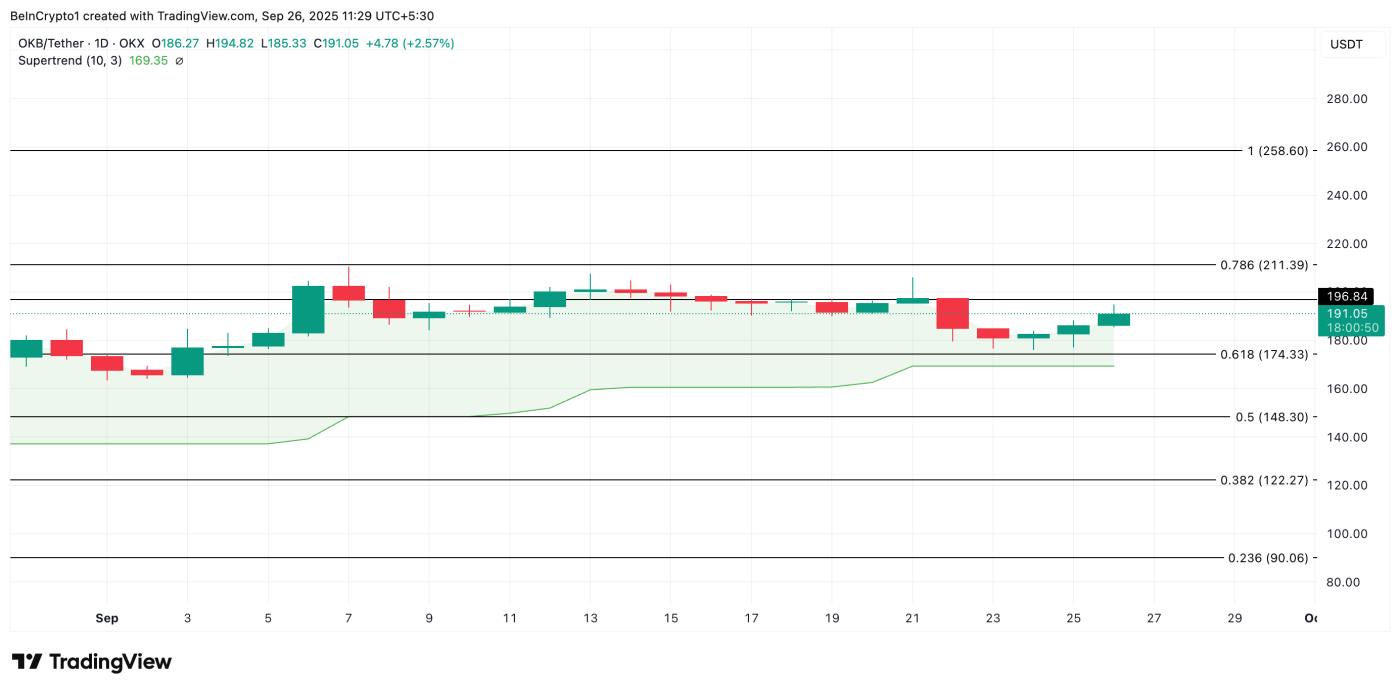 OKB Price Analysis. Source: TradingView
However, a surge in profit-taking would invalidate this bullish outlook. In that scenario, OKB could shed some of its recent gains and test support at $173.69.
OKB could fall toward the dynamic support of its Super Trend line at $169.35 if this level gives way.


