Source: The DeFi Report; Compiled by: BitpushNews
A mini- Altcoin season just ended. It started when ETH drained liquidity from BTC and the market hyped up DATs (Digital Asset Treasury) ahead of their launch.
Then, we saw Altcoin draining liquidity from ETH. Assets such as ENA, WLD, HYPE, PUMP, SOL, BNB, and AVAX all performed well.
Now, we are seeing liquidity rotate back into BTC.
But how likely is it that we’ve reached the top? That’s the question on everyone’s mind.
We will attempt to answer this question in today's report.
Disclaimer: The opinions expressed are the author’s personal opinions and should not be considered investment advice.
Bitcoin
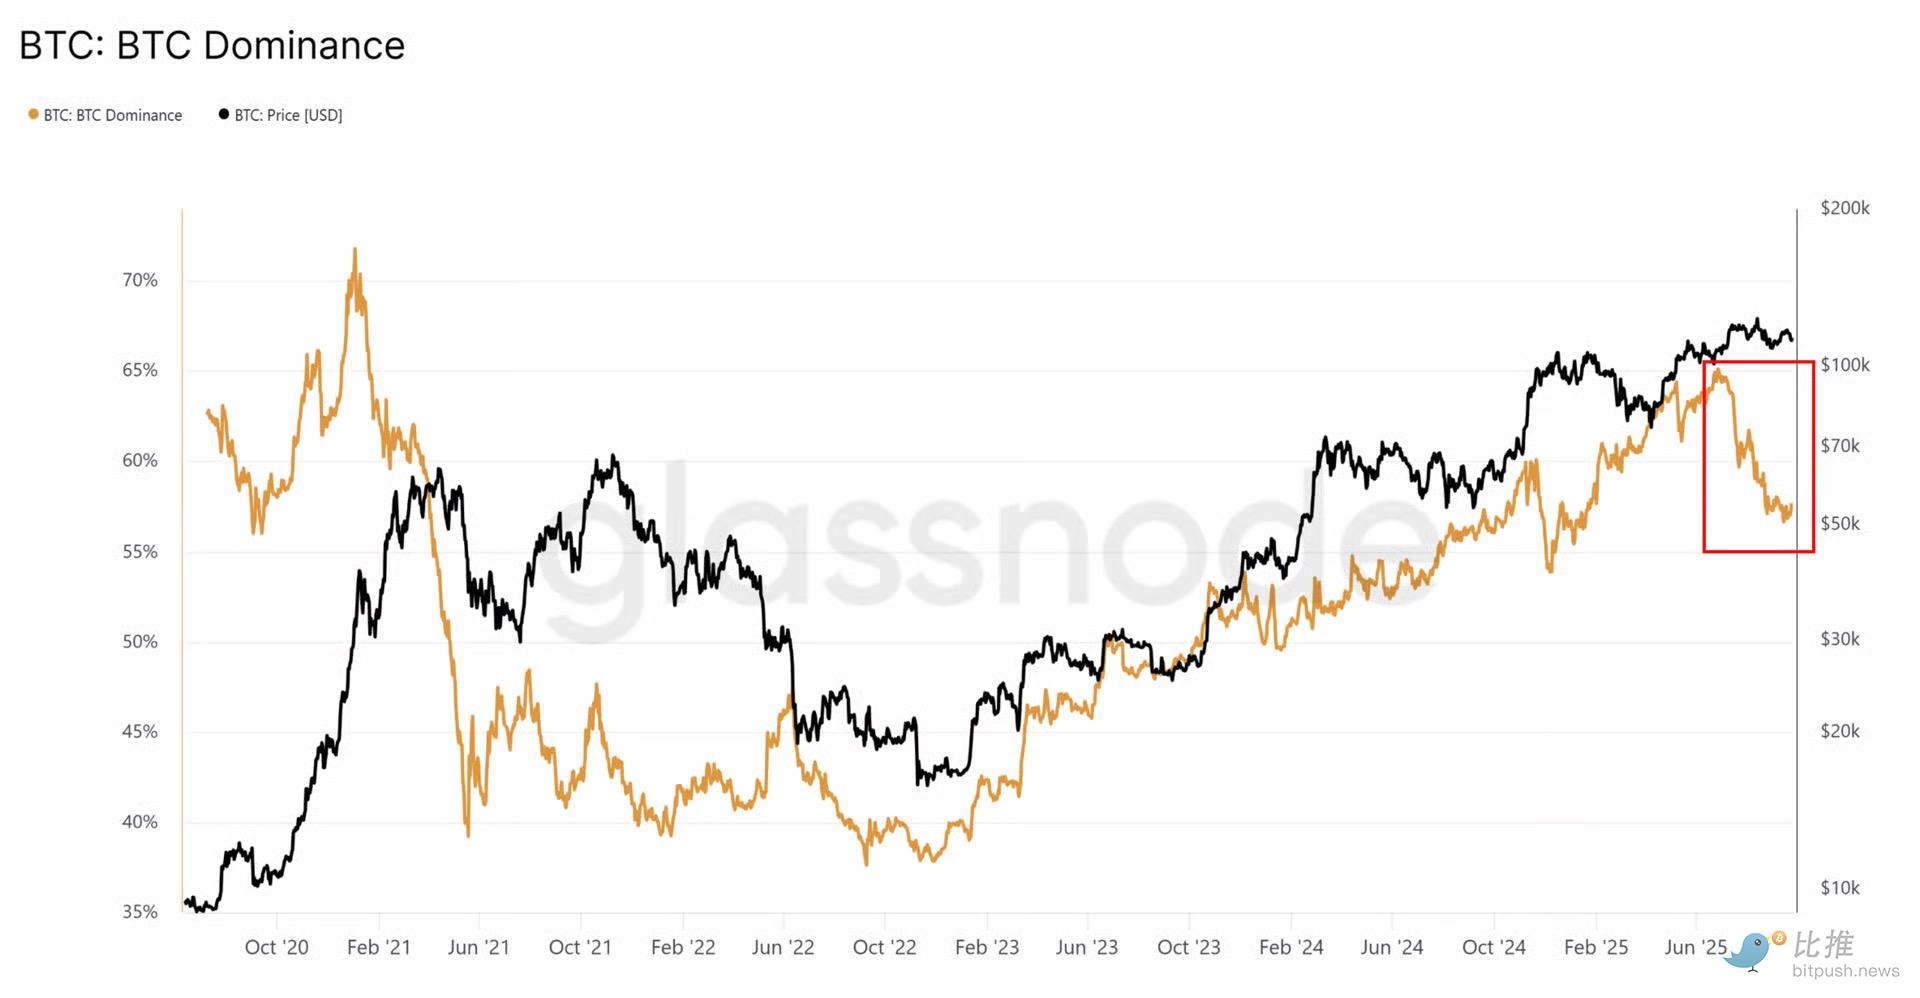
As mentioned in the introduction, a mini “Altcoin season” unfolded during the summer months.
During this period, BTC dominance fell from 65% to 57%.
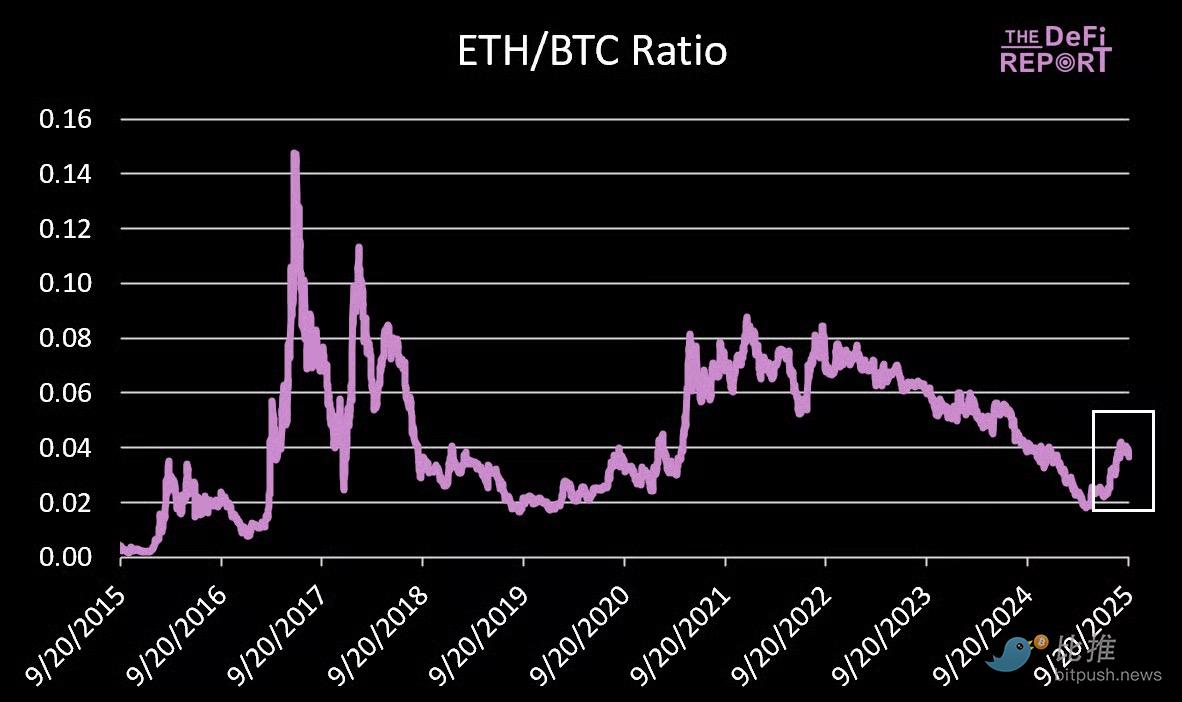
ETH was the first to rise, with the ETH/BTC ratio increasing from its April low of 0.018 to 0.042 as liquidity shifted away from BTC.
Now, the ETH/BTC ratio is pulling back, and the BTC dominance chart looks poised to consolidate in the 57% range (we still believe it will eventually head lower).
Onchain Data
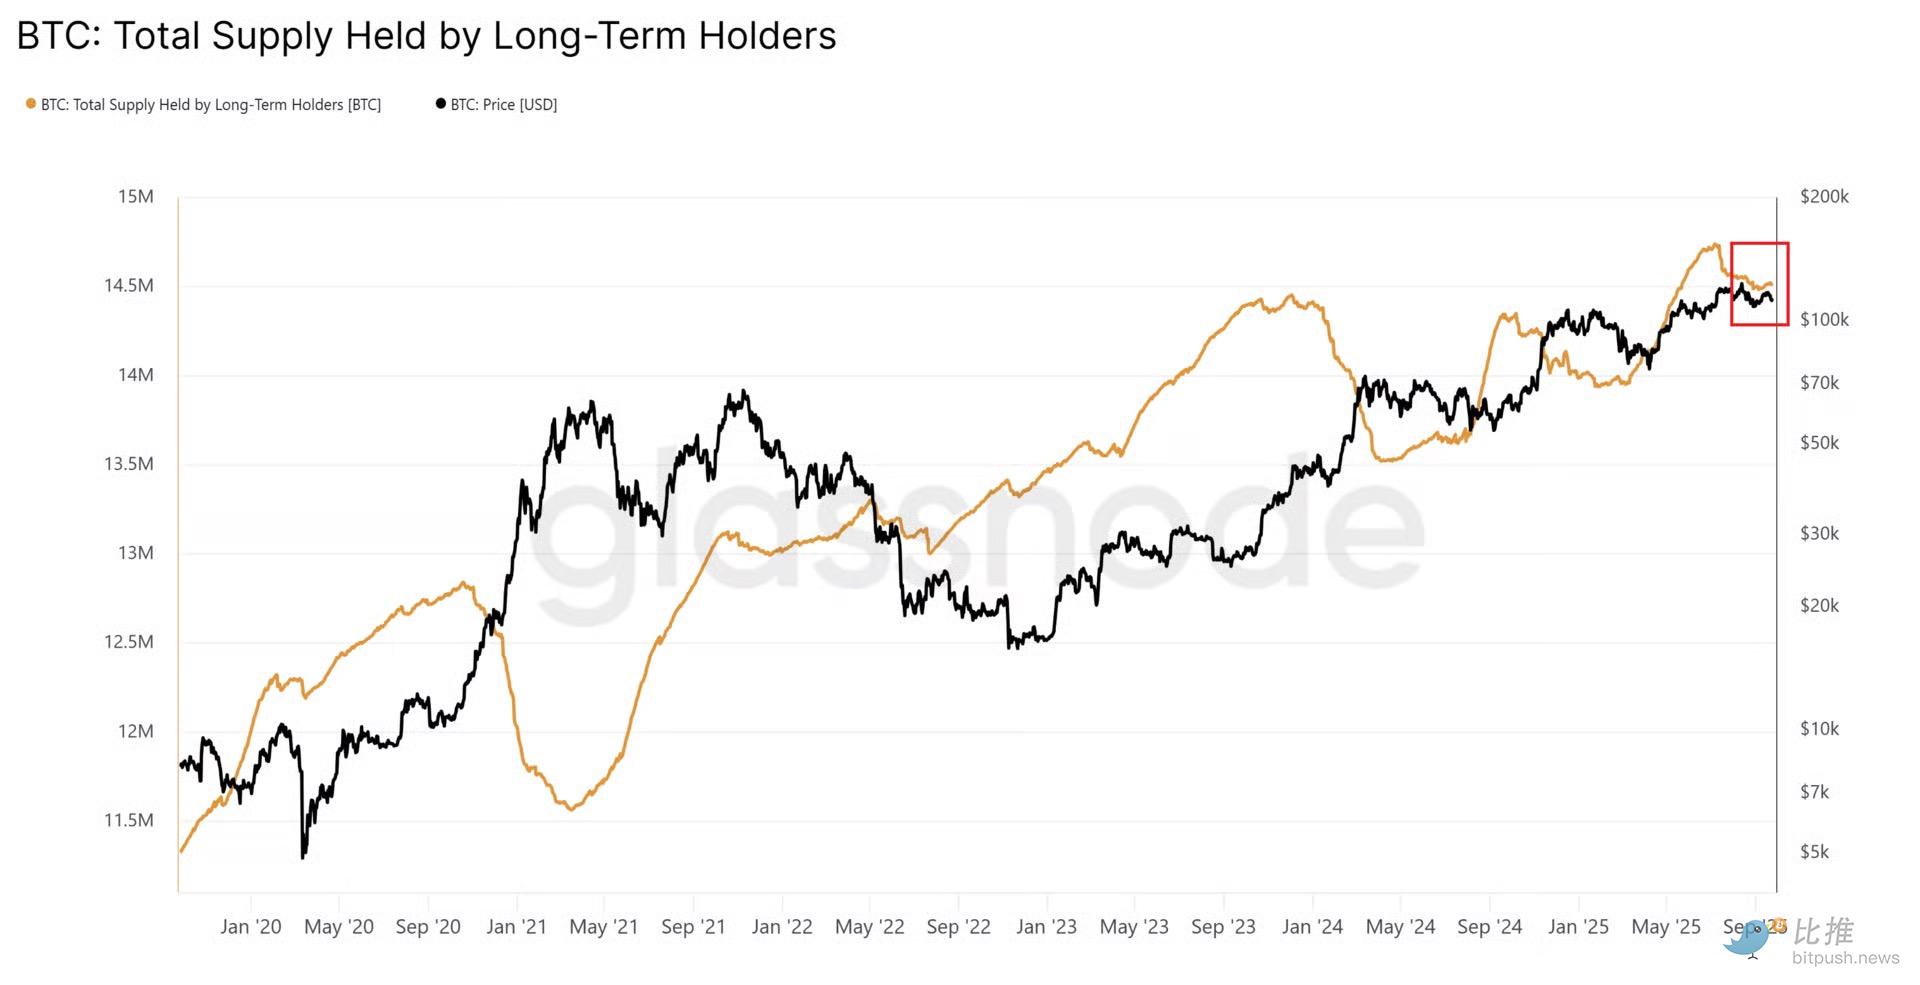
Long-Term Holders
After profit-taking in July and August, the supply from long-term holders is starting to level off – a positive sign.
ETF Flows
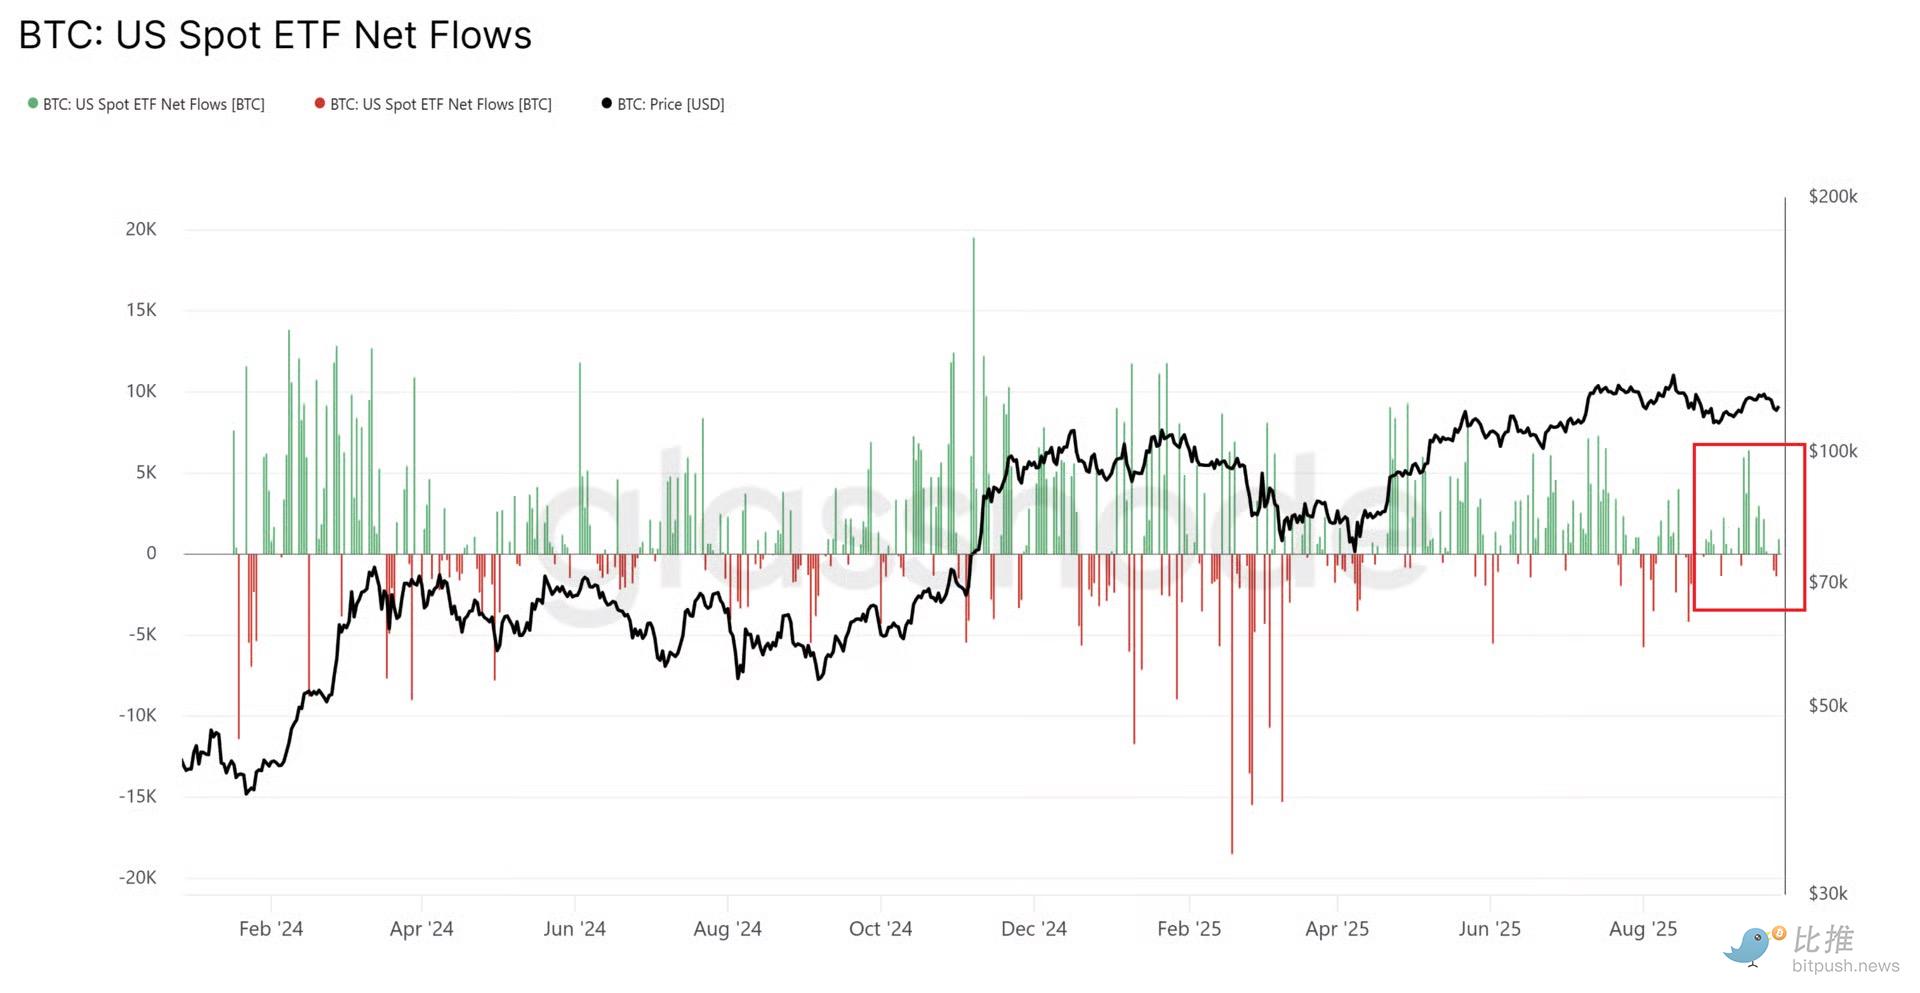
Meanwhile, inflows into ETFs have weakened.
On the bright side, outflows from ETFs have also declined.
Spot Volumes
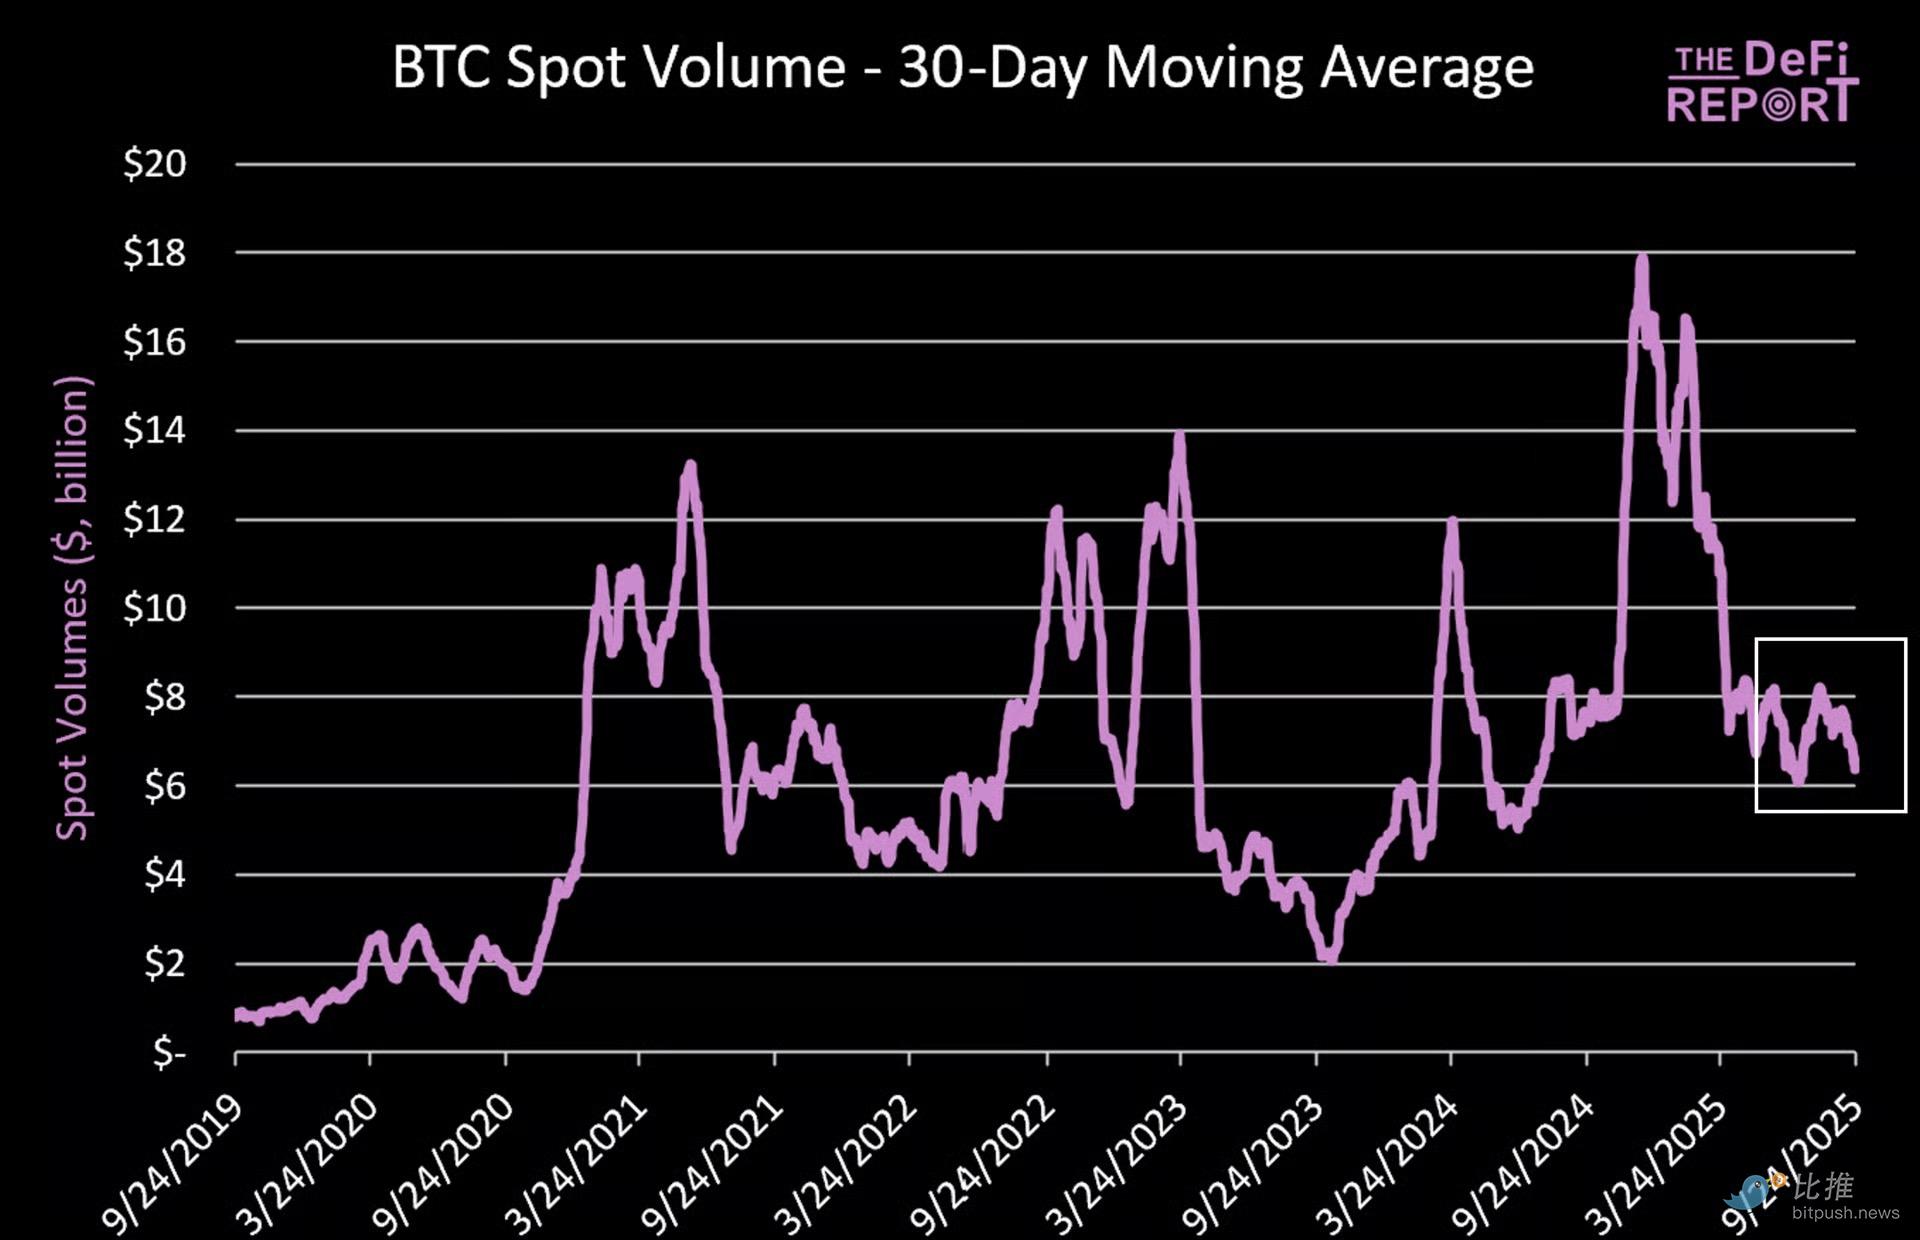
Trading volumes remain subdued after peaking earlier this year – suggesting a lack of significant “new money” entering the market over the past six months.
What’s next for BTC?
At the time of writing, BTC is currently trading at $109,000, which is below its 50-day moving average ($114.3k) and 100-day moving average ($113.8k). It is still above its 200-day simple moving average ($103.8k).
We definitely lost momentum.
However, when we look for topping signals, we prefer to focus on the longer-term 50-week moving average.
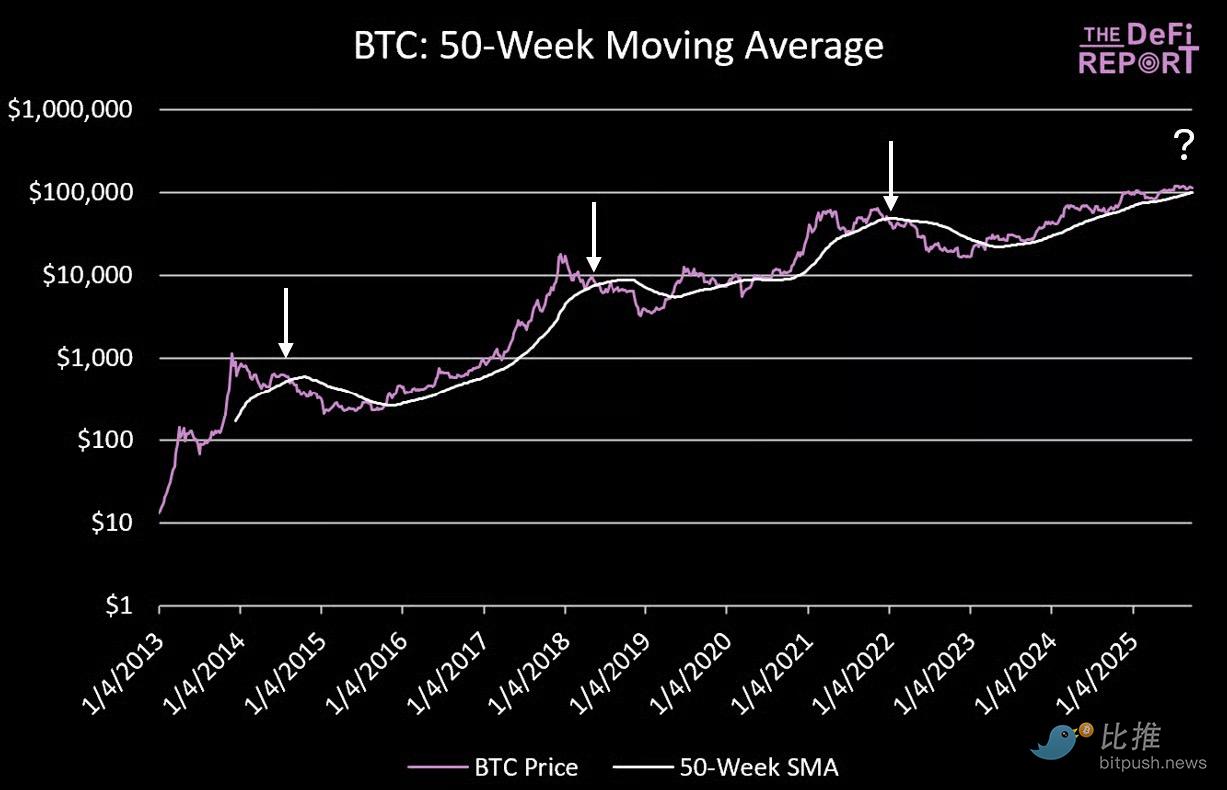
Why 50 weeks?
In the past three cycles, when BTC saw a weekly close below the 50-week Simple Moving Average (SMA) in year 4 of the cycle, it marked the beginning of a bear market.
Bitcoin’s 50-week moving average is currently at $99,000.
Altcoin
Altcoin Index
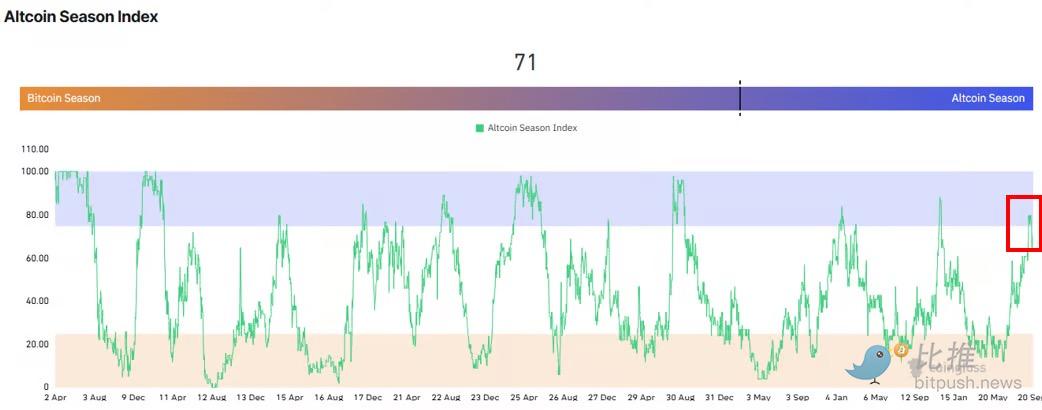
We can visually see the “Summer Altcoin Season” from the chart.
If you were expecting a 2021-style “rising tide lifts all boats” scenario where all currencies rise, you might not think of this as “Altcoin season.”
This will not happen in this cycle. The key now is to choose the right asset and find the best entry point.
What are the “right” assets? Those with strong fundamentals, token economics, and mindshare/narrative (Treasury companies).
We were fortunate to see strong profits on some of the Altcoin in our portfolio before the correction.
Ethereum
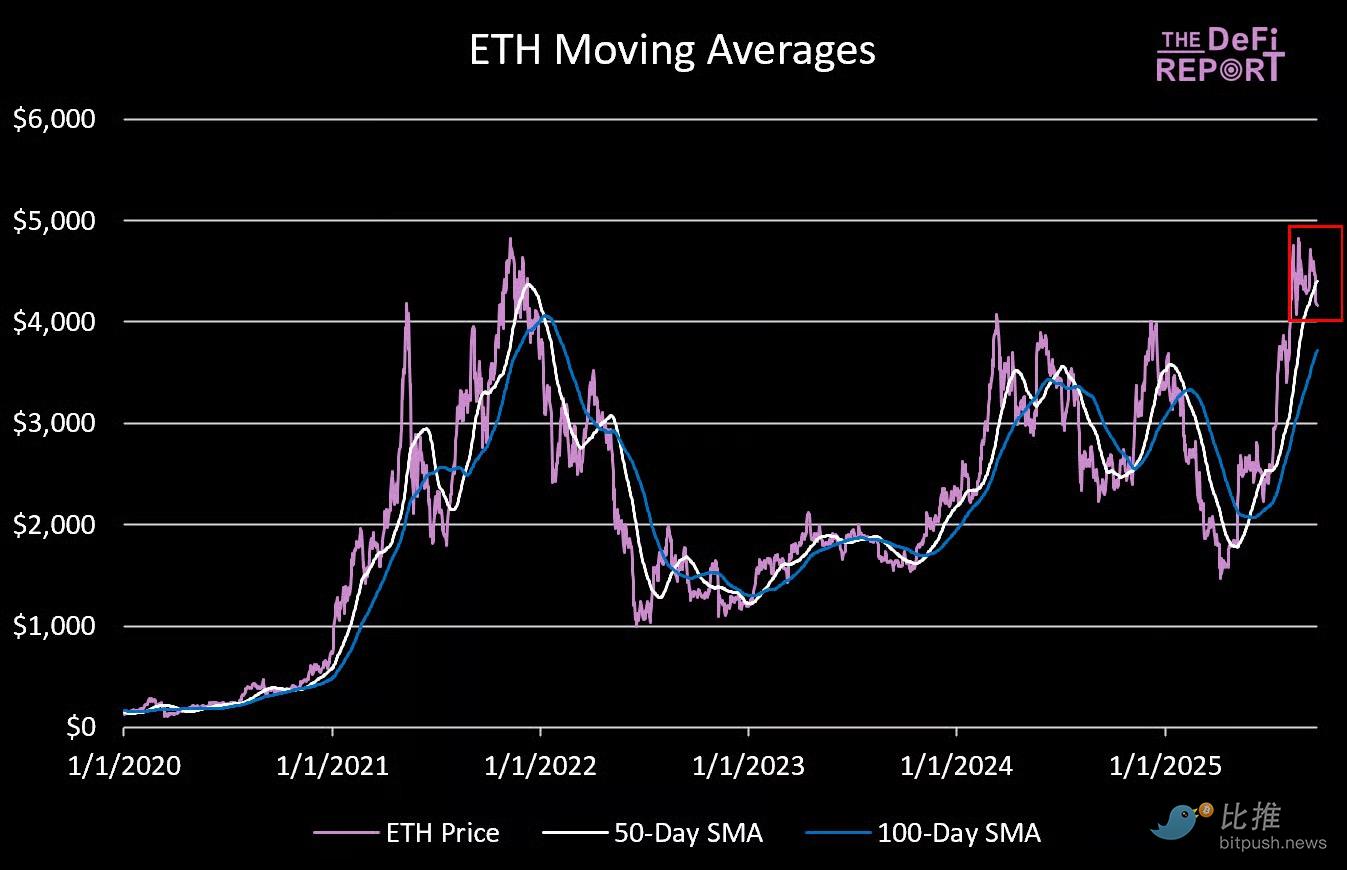
ETH has fallen below its 50-day moving average and is currently trading below the crucial $4,000 mark.
Further declines could take it to the 100-day moving average, at $3,700. But ultimately, if ETH is to break out to new all-time highs sustainably, it needs BTC to hold key support levels.
"Blue-Chip" Memes
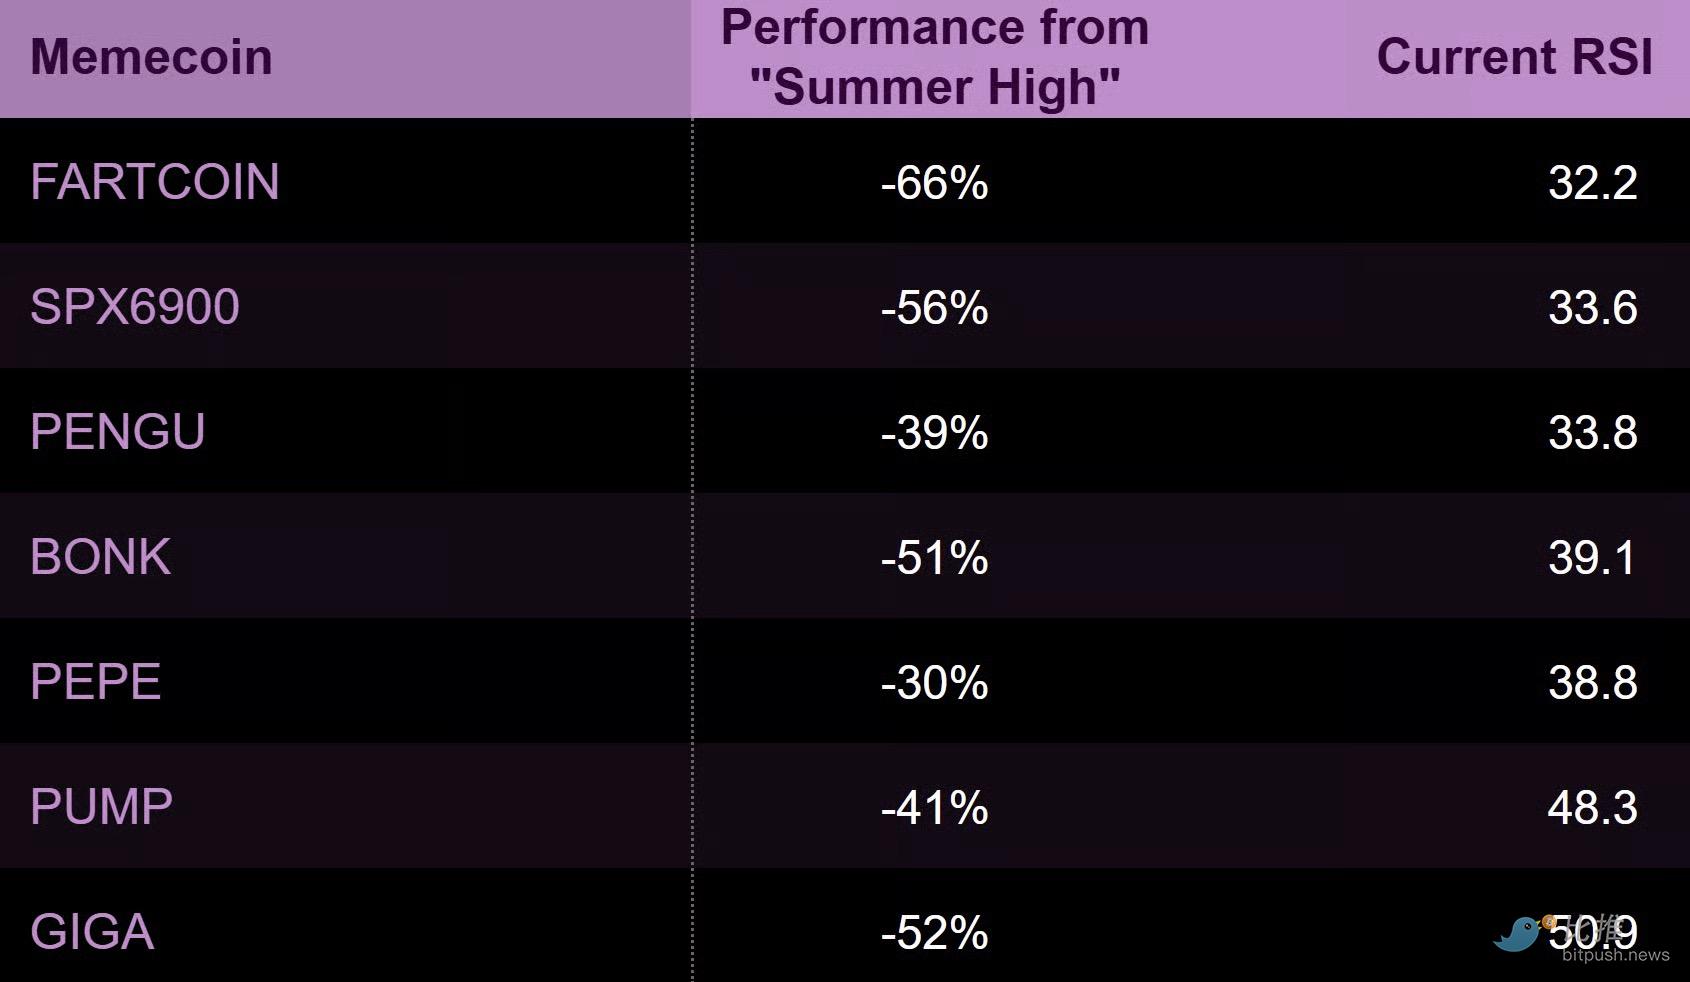
Memecoins are currently being hit the hardest as liquidity is withdrawn from the long end of the risk curve.
If we assume the cycle still has room to run (more on this below), some of these tokens could present good entry points.
Funding Rates
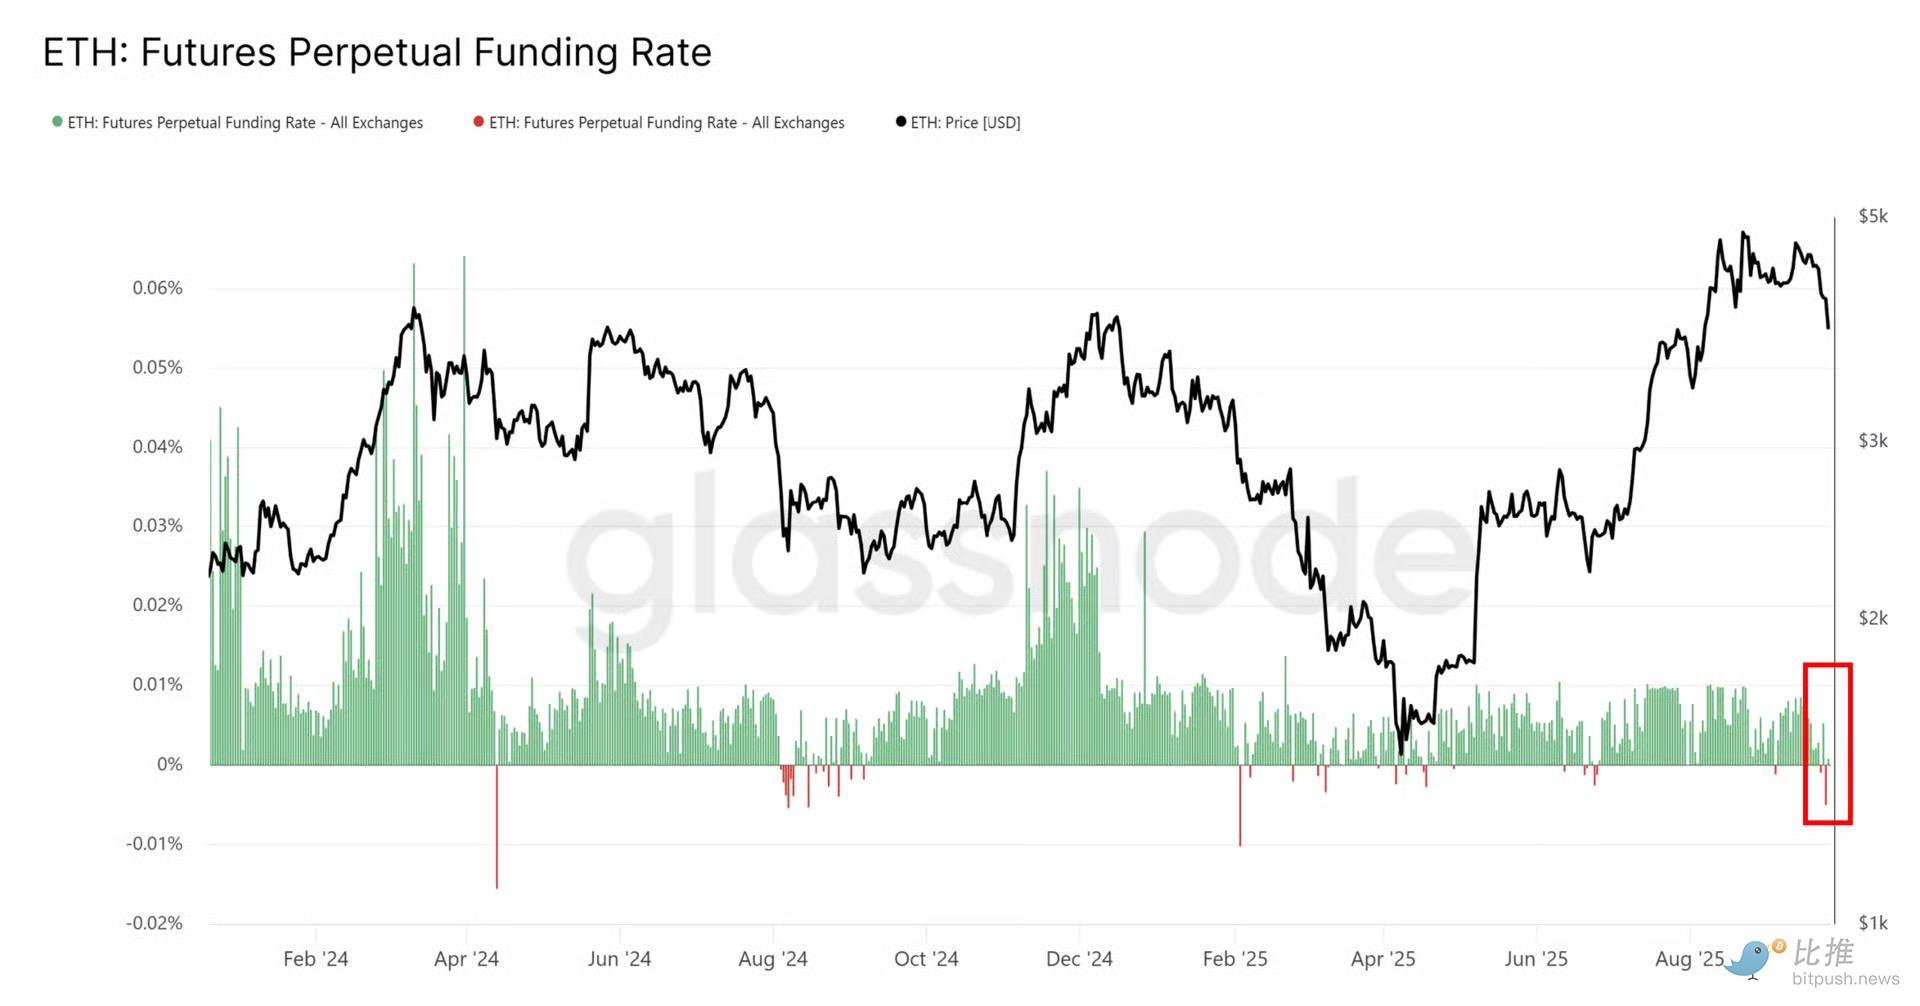
As momentum weakens, ETH funding rates in the futures market have turned negative.
Looking at the current ideal setup, further bearish positioning needs to form among traders, followed by a shift in sentiment and short covering to reignite the bull run.
Summary and Thoughts
Is it likely to peak?
It is certainly possible, but we do not believe this is the top. In our view, the recent sell-off was a healthy correction/purge and the bull market structure remains intact.
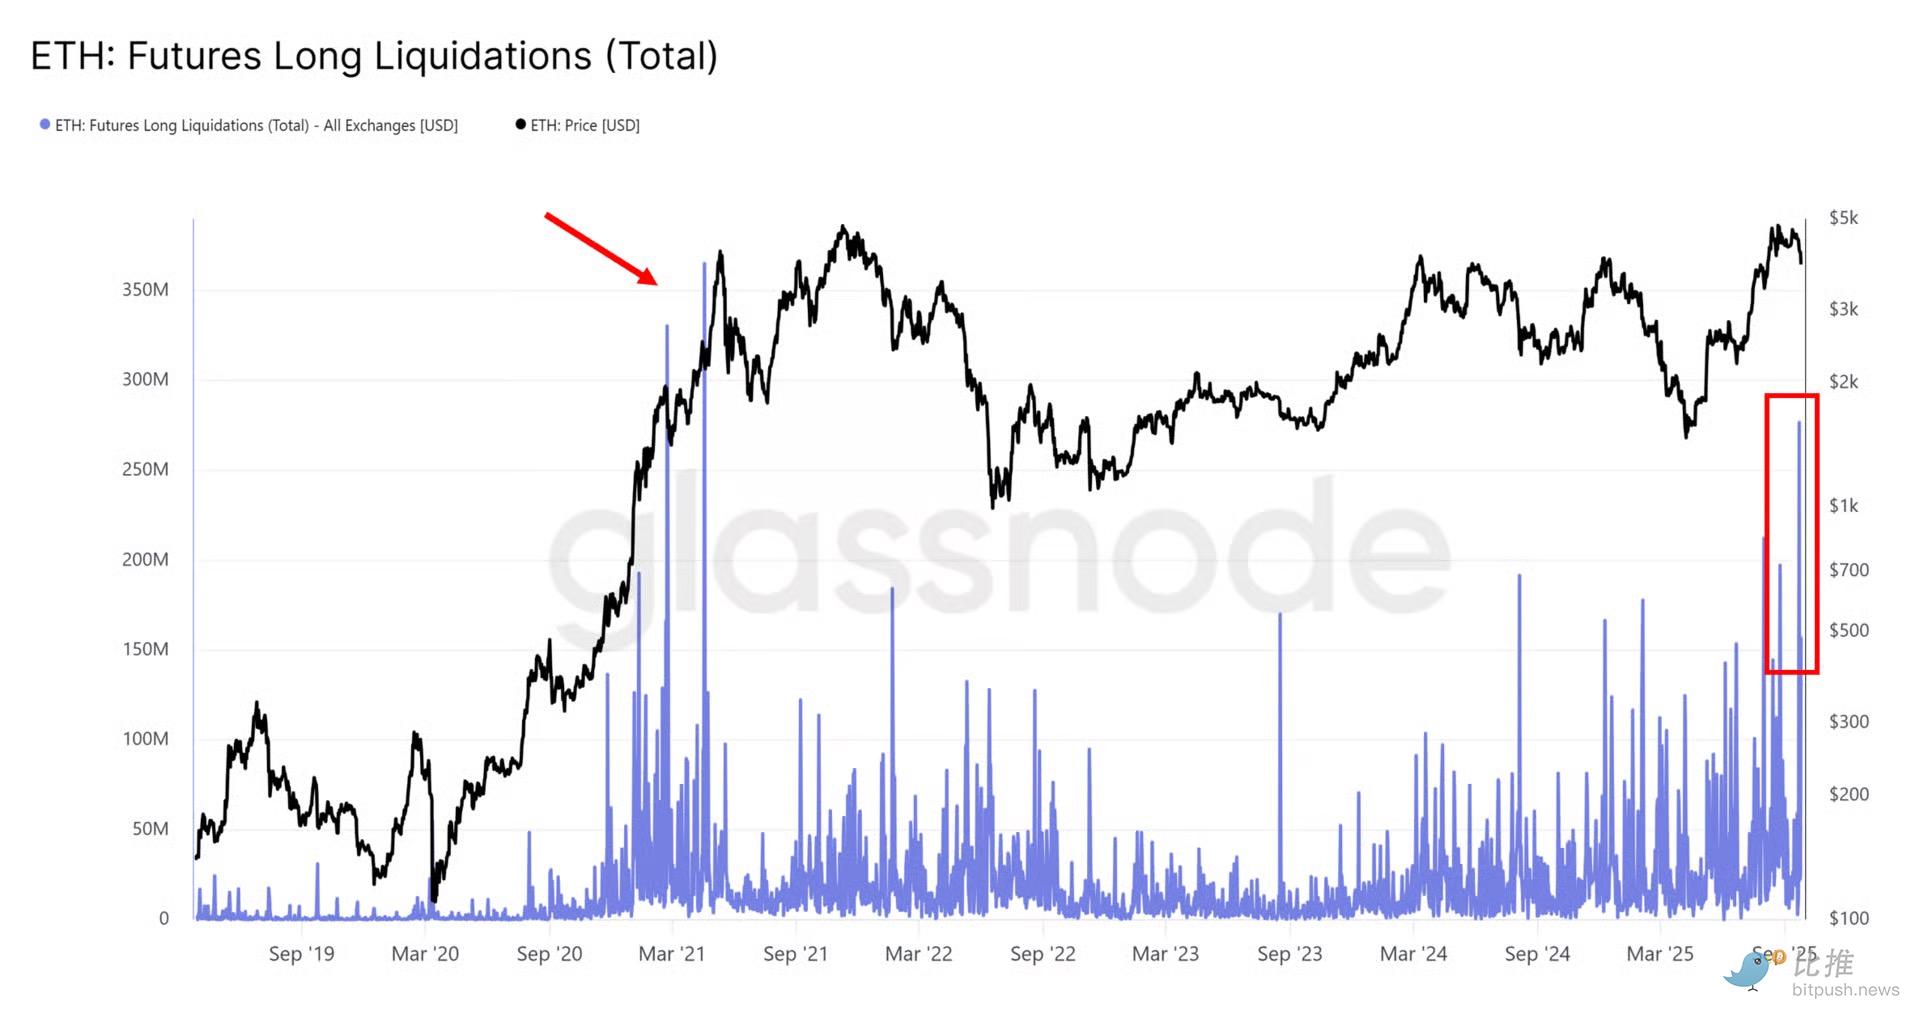
We believe excessive leverage and complacency in the perpetual swaps market, particularly in Altcoin, are to blame. Over the past few days, ETH has experienced $480 million in futures long liquidations on centralized exchanges—the most since April 2021. Billions more are believed to have been lost on Hyperliquid and other perpetual swap decentralized exchanges.
When that happened in 2021, it turned out to be just a minor setback on the road to record highs.
In many ways, we are seeing many similarities to last year – when the market briefly rallied after the Fed’s September rate cut, then corrected, before seeing even bigger gains in October and November.
We view the setup as positive from a macroeconomic and business cycle perspective:
Profits are rising
Banks are lending
The Fed is cutting interest rates
Capital is still rotating across the risk curve (small caps are outperforming right now)
Long-term yields rose modestly (as they should, given that growth remains strong)
Yesterday's initial jobless claims data showed unemployment remains low.
The ISM appears poised to enter expansion territory
That being said, we did see some liquidity being withdrawn from the market as the U.S. Treasury replenished its “checking account.” Over the past few weeks, approximately $500 billion was added back to the TGA (U.S. Treasury General Account).
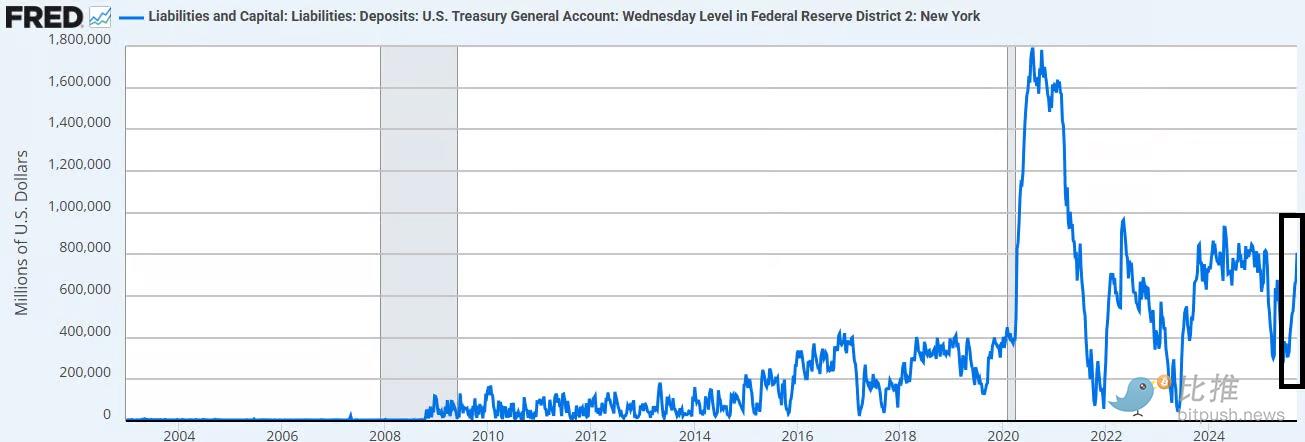
We believe this is one of the reasons for the cryptocurrency sell-off (along with excessive leverage).
The good news?
This is now in the past as TGA has returned to target levels.
Looking to the future
To confirm the continuation of the bull market, we are watching the following points:
BTC is holding onto its previous highs in the $105,000-$107,000 range. A breakout above this area would ultimately require a hold on the 50-week moving average (currently $99,000). A break below this level would make a bear market more likely than a bull market.
ETH rebounded and recaptured the $4,000 mark. If broken, we expect a rebound towards the 100-day SMA ($3,700).
Generally speaking, the market caught many investors off guard at the end of the cycle in 2021. In our view, this "trauma" is evident in current market sentiment.
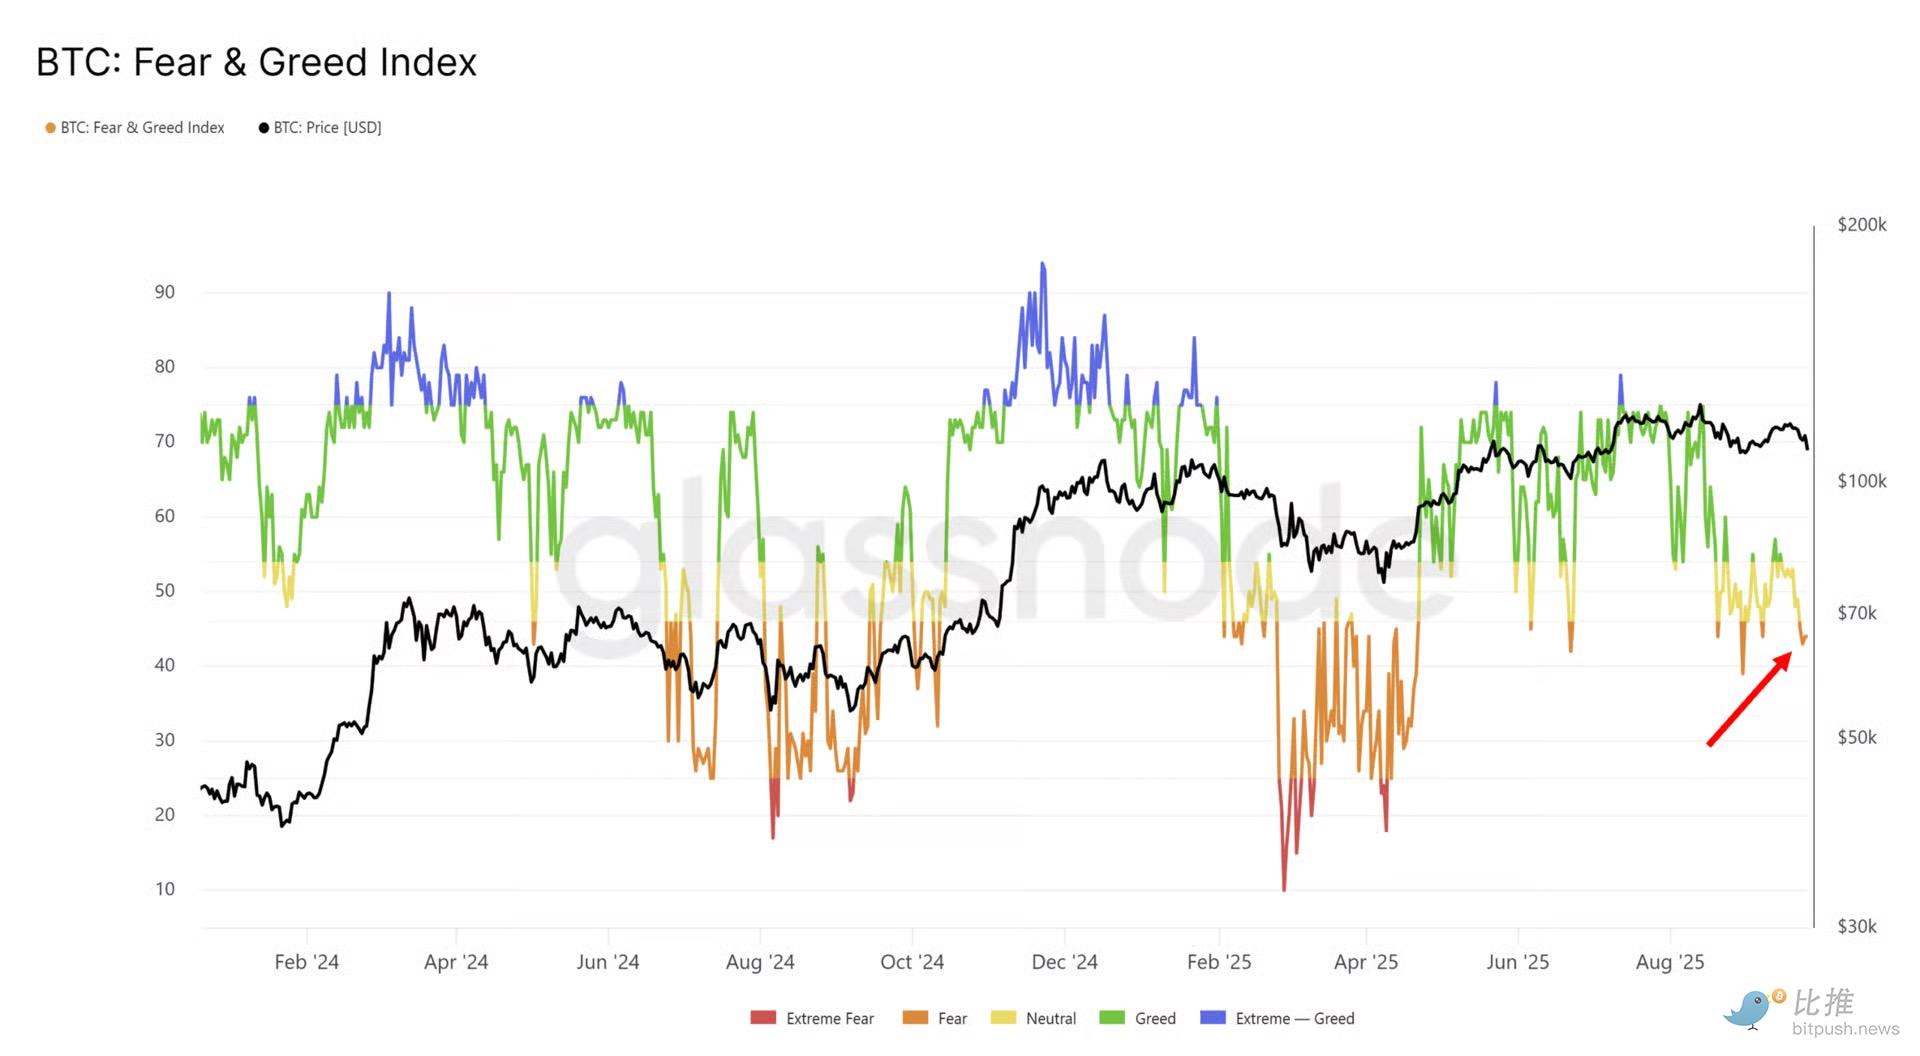
Not only are markets currently at panic levels, but we are also seeing a lot of "top" chatter on social media.
The reality is that when the real top arrives, few people will cry out for it.
This is how market psychology works.
Please stay curious.


