

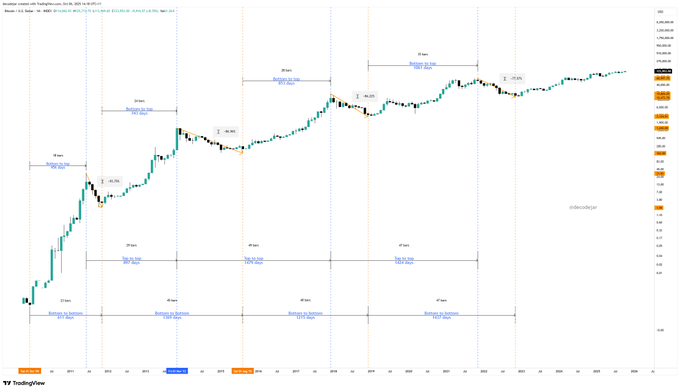
How to draw the 4 year Bitcoin cycle:
Don't use the Trading View Index; the only chart that aggregates all of Bitcoin's price data.
Ignore the two short cycles on the Bitcoin chart prior to Nov '13, clearly delineated by a 94% drawdown.
Ignore the fact Bitcoin made a new low in Aug '15, clearly visible on the Index and on the Bitfinex chart.
I couldn't be bothered to change my chart to one with less price history, so I've just used bits that fit the theory best.
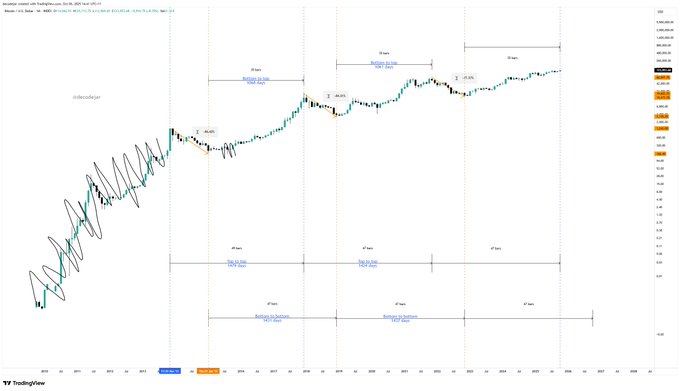
Then I started again, and drew everything accurately from the price highs and lows.
There are some approximate 4 year cycles by some measures in more recent price history, but it's not exact or consistent across all price history.
Consistent across all price history is that bottom to top is taking longer.
After reading the comments I realised that people didn't get my dead pan humour. The point here is to mock those claiming there is a clear 4 year cycle, when actually you have to ignore a lot of facts to make it work.
Sector:
From Twitter
Disclaimer: The content above is only the author's opinion which does not represent any position of Followin, and is not intended as, and shall not be understood or construed as, investment advice from Followin.
Like
Add to Favorites
Comments
Share
Relevant content


