Ripple continues to consolidate beneath a critical descending resistance, forming a tightening structure that suggests a potential breakout is imminent. The asset is showing signs of strength above key moving averages, yet remains capped by a significant multi-month trendline that has repeatedly rejected price advances.
XRP Price Analysis: Technicals
By Shayan
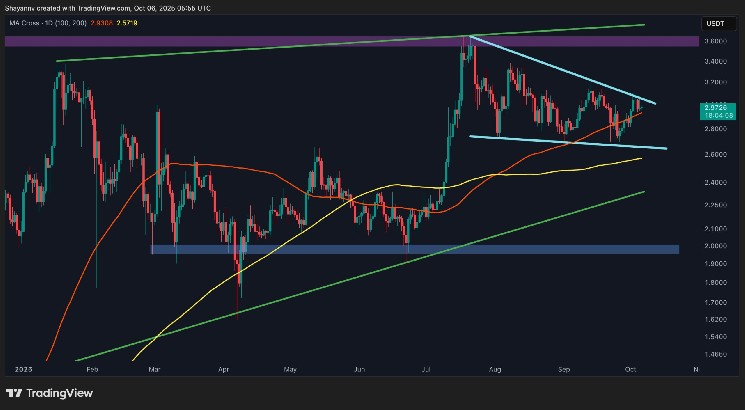
The Daily Chart
On the daily timeframe, XRP is trading within a converging wedge pattern, defined by a descending resistance line from the yearly high and a rising trendline acting as dynamic support. The price has reclaimed both the 100-day and 200-day moving averages and completed a pullback, reflecting improving bullish sentiment after weeks of sideways action.
Currently, the market is retesting the upper boundary of this wedge near $3.05–$3.15, which aligns with a key supply zone that has repeatedly rejected previous attempts at continuation. A confirmed breakout above this confluence could open the path toward $3.35 and eventually $3.60, where the higher-timeframe liquidity pool and major resistance await.
However, failure to break through may result in another short-term pullback toward the $2.75–$2.80 range, coinciding with the lower boundary of the pattern and near the 200-day MA, a key area that must hold to preserve the bullish market structure.
The 4-Hour Chart
On the 4-hour chart, XRP continues to trade within a well-defined descending structure. The recent rejection from $3.10 to $3.15 marks another test of the descending trendline resistance, keeping short-term traders cautious.
Despite this, the mid-range structure remains constructive. The price has formed higher lows since late September, suggesting that demand continues to support the market each time it dips below $2.80. The current price action appears to be coiling tightly, which often precedes a strong directional expansion.
If the price successfully breaks and holds above the $3.15 level, this could trigger a momentum-driven leg toward the next resistance at $3.35, followed by a liquidity sweep near $3.60. Conversely, if the rejection holds, a corrective move back toward $2.70–$2.75 remains possible, a zone that aligns with the lower boundary of the channel and prior accumulation.