

Bitcoin (BTC) has been trading mostly sideways this week, hovering around $121,300 after a slight 1% gain for the week. On the surface, Bitcoin’s price action may seem unremarkable, but a closer XEM at key chart structures and investor behavior suggests that the next major breakout may require another correction before it occurs.
Several key indicators — both on the chart and on chain — are now pointing to a deeper correction forming beneath the surface, even as a new long-term target is taking shape.
Chart patterns suggest a cooling period before further growth
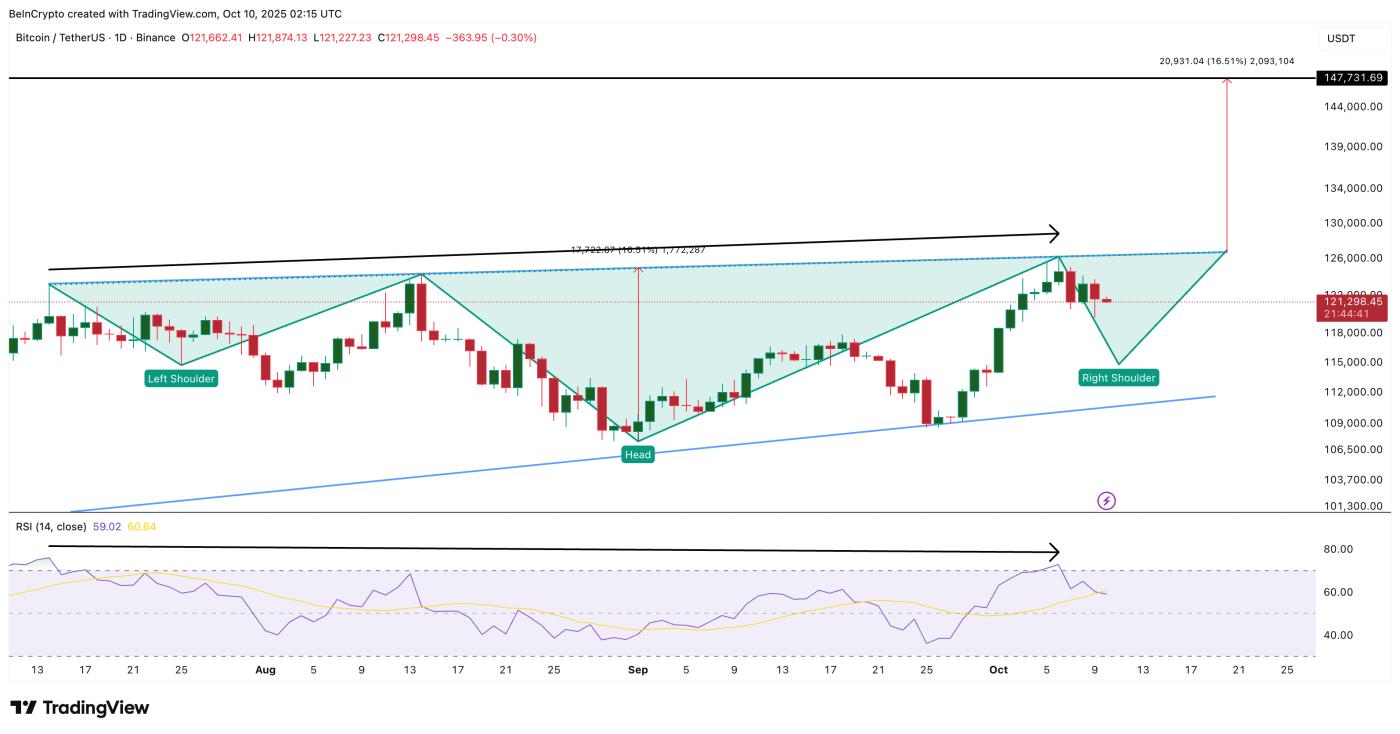
Bitcoin's current setup is forming a classic reversal structure that has led to major rallies in the past. The inverted head and Vai pattern, which is still developing, shows early signs of symmetry between the left and right halves — suggesting that the market may be building a foundation for the next rally.
 Bitcoin Price Model: TradingView
However, short-term traders are tracking a developing, slightly bullish sloping pattern (forming a rising wedge-like structure), suggesting potential exhaustion near the top and a short-term downtrend.
Want more information on Token like this? Sign up for Editor Harsh Notariya's daily Crypto Newsletter here .
At the same time, the Relative Strength Index (RSI), which measures market momentum, began to diverge from the price. From July to early October, Bitcoin's price made higher highs, while the RSI made lower highs — a bearish divergence that typically signals weakening buying power.
This combination—a maturing chart pattern and a Falling Wedge like structure combined with waning momentum—suggests that Bitcoin price could test lower levels before fully forming a right side before attempting a breakout.
Whales and long-term investors increase selling pressure
On chain data supports the technical setup. The Exchange Whale Ratio, which measures the ratio of inflows to exchanges from the 10 largest addresses, spiked to 0.54 — its highest level since August 1, 2024. This signals an increase in whale deposits to exchanges, which is often associated with short selling or portfolio rebalancing.
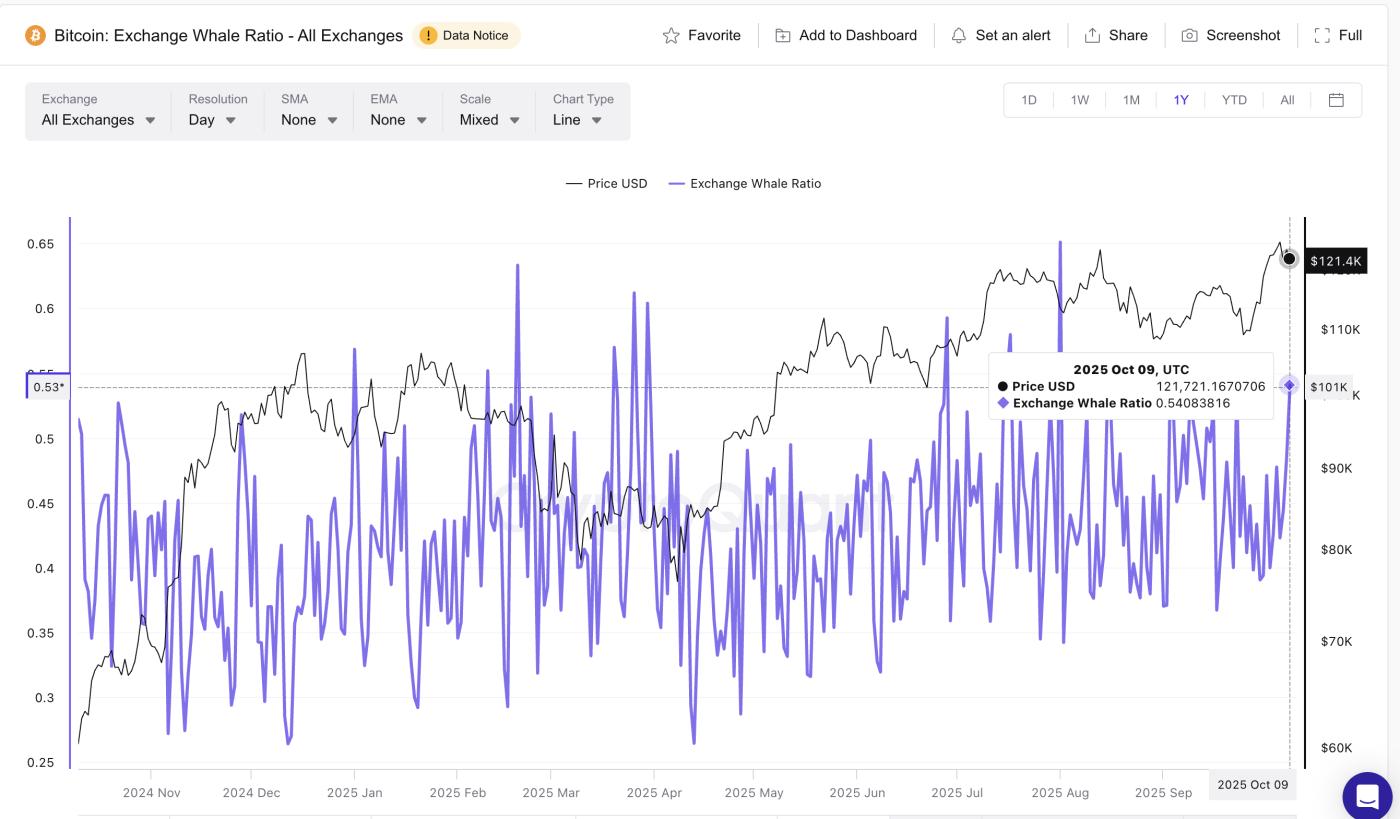 Bitcoin Whale Moves: CryptoQuant
Meanwhile, long-term investors have turned net sellers. Hodler Net Position Change, which tracks monthly accumulation or distribution, has dropped sharply from +3,082 BTC on September 28, 2024, to -23,461 BTC on October 9, 2024. This change of more than 26,000 BTC clearly shows profit-taking by long-term holders.
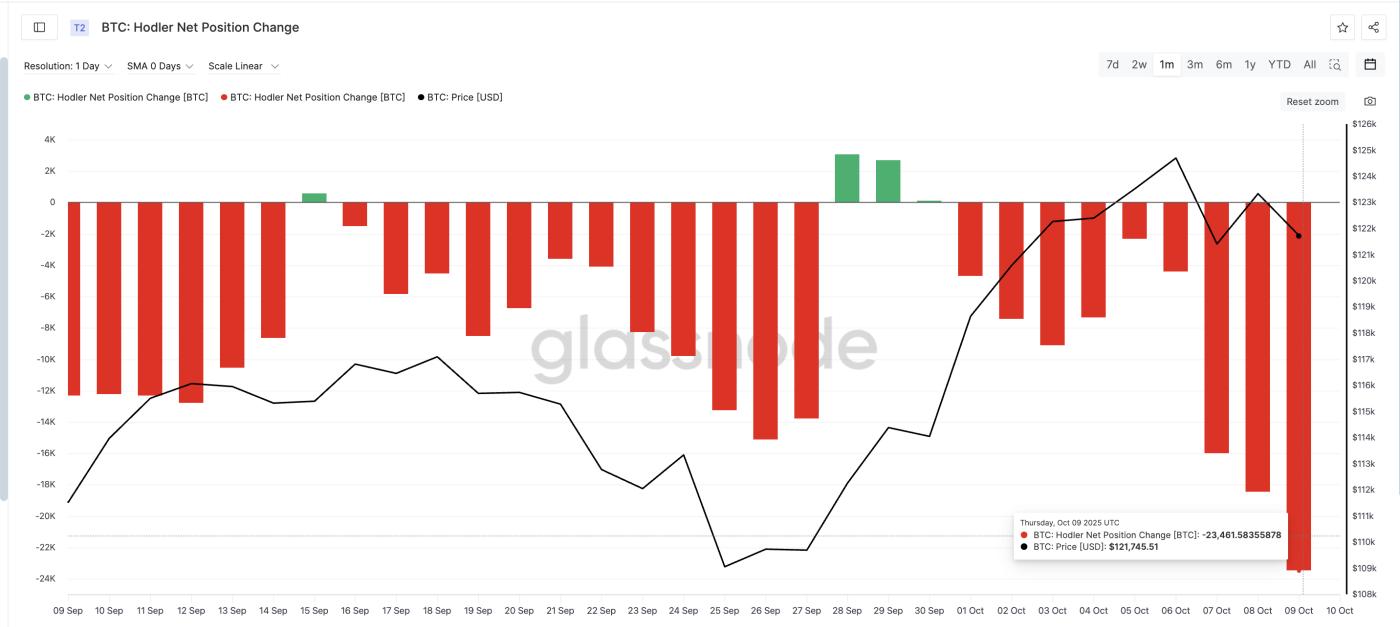 Bitcoin HODLer Selling: Glassnode
The combination of whale flows and long-term selling suggests that large players anticipate short-term volatility before confidence returns — fitting the picture of an evolving pattern rather than a completed one.
Important Bitcoin Price Levels to Watch
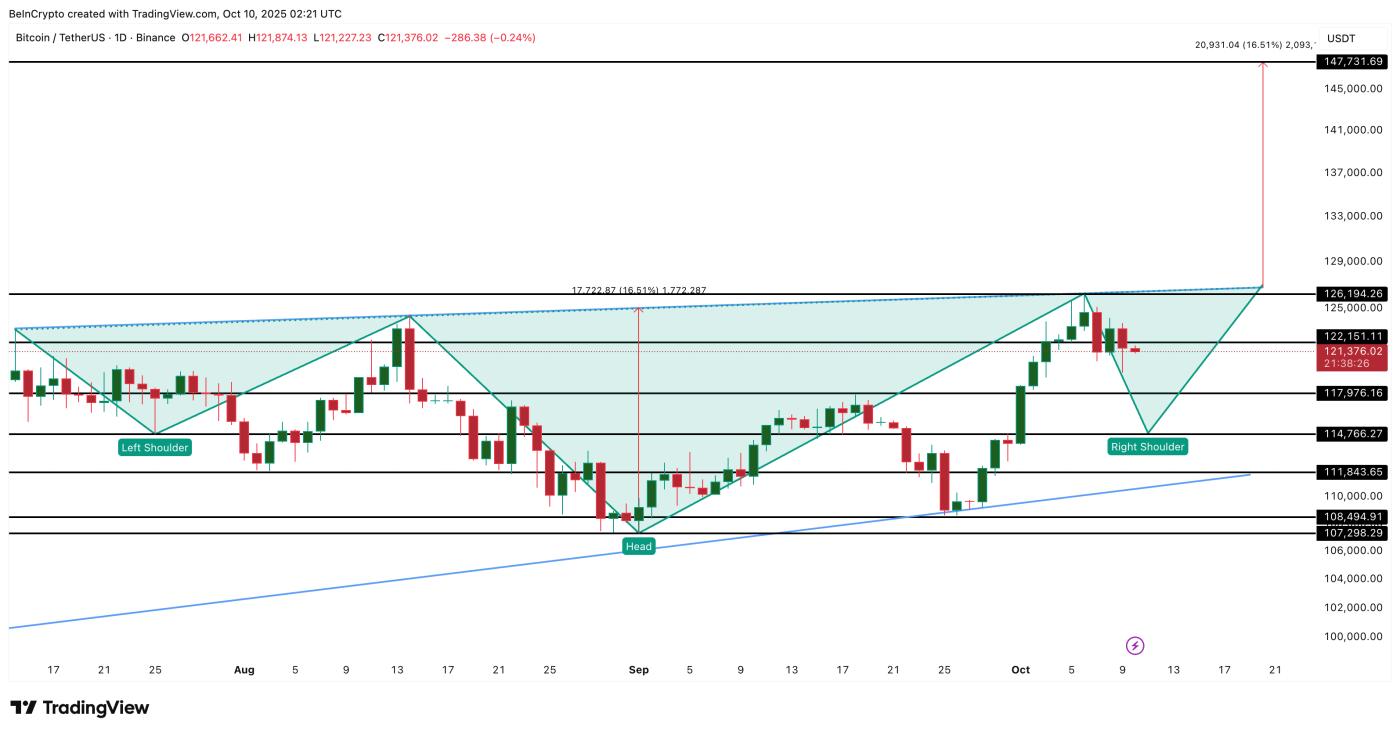
Bitcoin’s broader structure is still targeting around $147,700, based on the current setup. For that move to happen, the market must first stabilize and break clear above $126,100 (the All-Time-High), which is close to the neckline of the ongoing inverse head and Vai pattern.
Until then, short-term support lies between $117,900, $114,700, and $111,800. Holding these levels would keep the structure intact. A drop below $107,200 would invalidate the bullish forecast, while reclaiming $126,100 could trigger a move towards $147,700 — marking the start of Bitcoin's next bullish phase .
 Bitcoin Price Analysis: TradingView
For now, the message is simple: there may be a correction before the price goes up. The structure is still bullish, but patience may determine who catches the next breakout. To reiterate, Bitcoin's price structure, based on this model, will continue to tilt bullish unless BTC falls below $107,200.


