

While bearish sentiments have engulfed the broader crypto market, historical data indicates Bitcoin has again retested a crucial support trendline.
Notably, these bearish sentiments have emerged amid the discouraging performance within the crypto market. Specifically, after the sudden Oct. 10 crash, which led to liquidations totaling $19 billion, Bitcoin (BTC) and the rest of the market staged a recovery push, with BTC eventually reclaiming $116,000 three days later.
However, this rebound effort met resistance, and the market has now observed renewed bearish price action. As a result, Bitcoin recently collapsed to a 4-month low around $103,000, triggering investor angst, with miners increasingly depositing to Binance.
Specifically, the first test of this support occurred in December 2022 following the FTX implosion in November of that year. The impact of the collapse pushed BTC to a low of $16,293 in December 2022, leading to a test of the support trendline. Following this test, BTC recovered, soaring to a high of $31,818 by July 2023.
After the $31K peak, BTC again corrected, reaching a low of $24,920 by September 2023. Another recovery ensued from here, as Bitcoin jumped to a peak of $73,794 by March 2024.
This marked the largest stretch of upward push, but resistance capped the rally at $73K, with the correction leading to a low of $49,577 in August 2024. Bitcoin again recovered from this low, as it jumped to $126,000 earlier this month. Now, another correction has ensued, as the firstborn crypto attempts to maintain the $100K psychological mark.
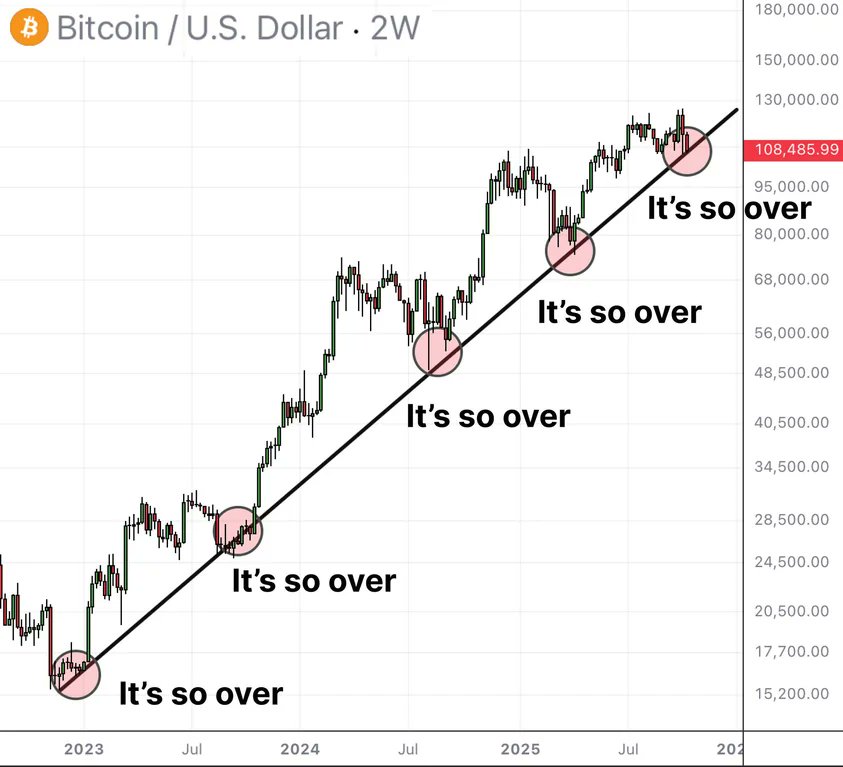
Bitcoin Rallied Each Time It Retested the Ascending Trendline
Data from Altcoin Daily’s chart shows that each time Bitcoin collapsed, it found support when it retested the ascending trendline. In addition, whenever such a retest occurred, bearish sentiments engulfed the crypto community, with chants of “it’s so over.”
However, in each case, Bitcoin has fully recovered to new heights. This time, similar bearish sentiments have emerged. If history repeats, BTC could embark on another upward push once the dust settles and buying pressure returns.
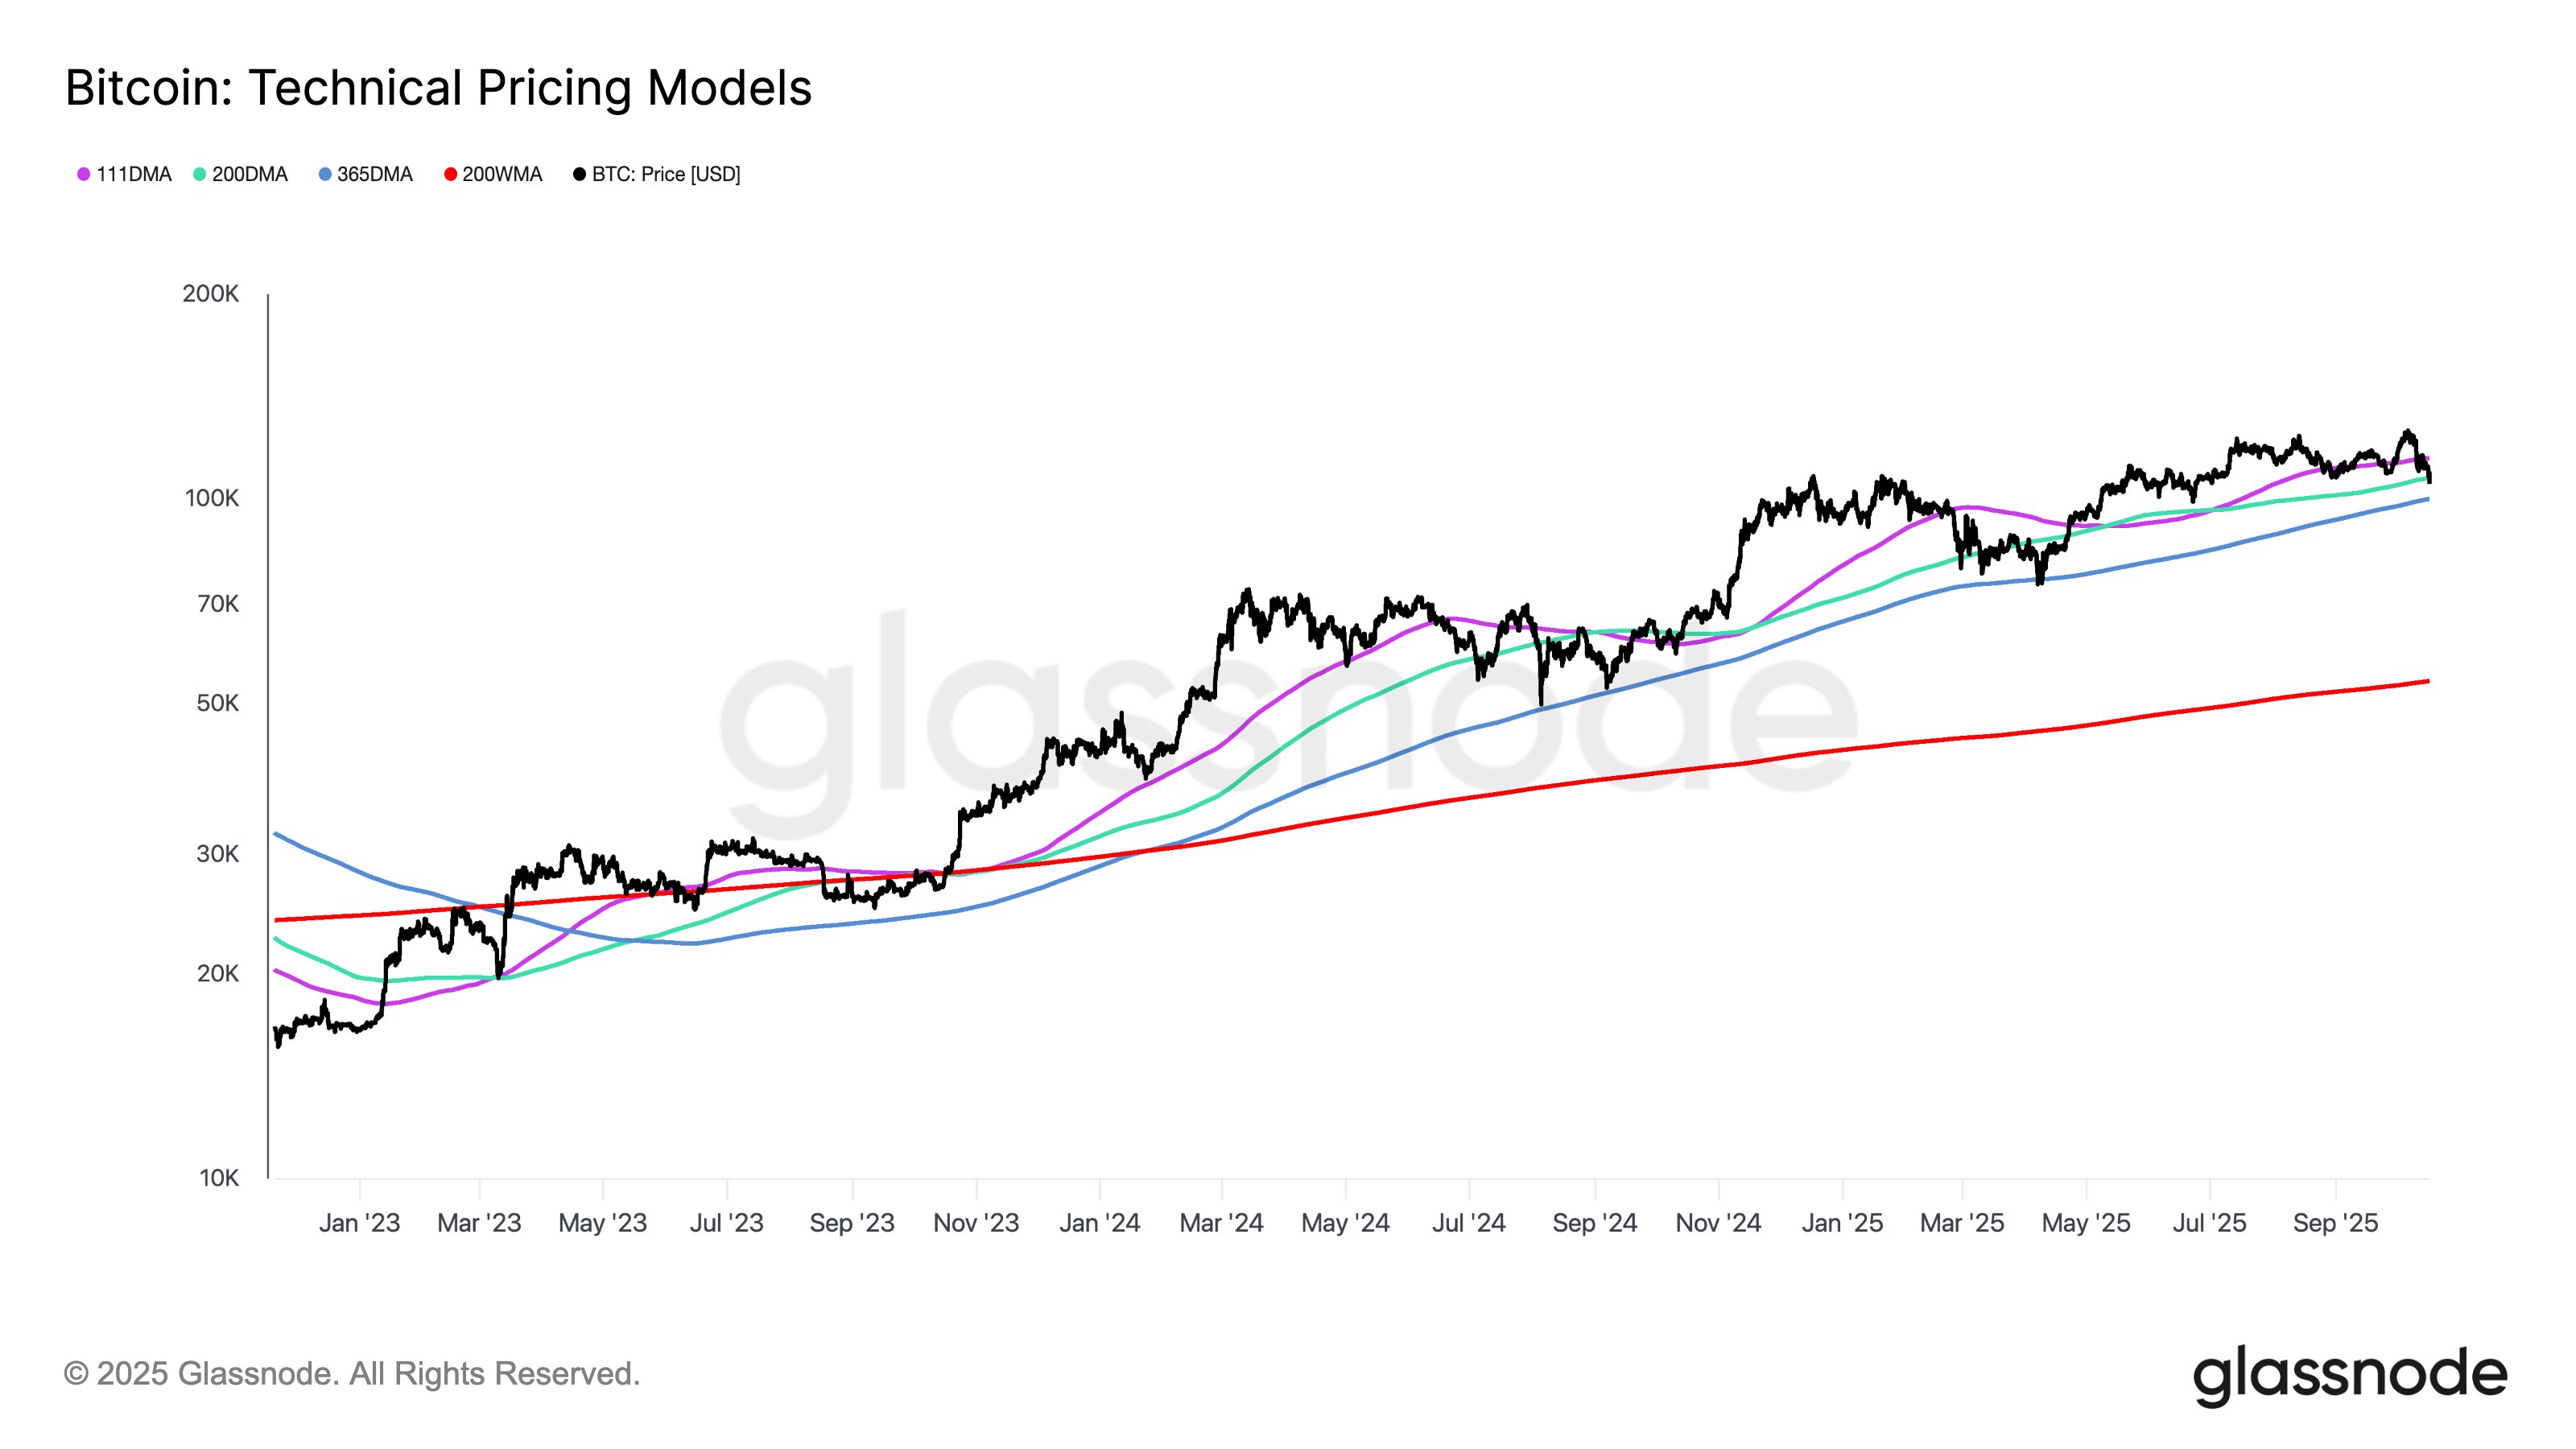
Speaking on the recent price action, Glassnode confirmed today that BTC currently rests between two important levels.
Right now, the token lies below the 200-day moving average at $107,400, but above the 365-day moving average at $99,900. They noted that it needs to continue holding above the 365-day MA, as a drop below it could lead to steeper declines.
Meanwhile, analyst BitBull believes BTC wicking to the $103,000 to $104,000 range could be beneficial for the market. According to him, such a drop would liquidate the last remaining long positions, giving the market the chance to reset. He expects this to trigger a trend reversal and a push to new ATHs for Bitcoin.
This could be the max pain scenario for $BTC now.
Filling the wick it created last week.
A sweep of $103,000-$104,000 level will liquidate the last remaining bulls.
After that, a reversal and a new ATH. pic.twitter.com/VctPG427dz
— BitBull (@AkaBull_) October 17, 2025


