

Pi Coin (PI) is testing traders' patience again. Despite a 7.2% drop in the past 24 hours, the Token is still up 19% on the week — showing that there is still buying power. But on a broader view, the monthly chart tells a different story: Pi Coin's price is still down nearly 10%, showing that the main trend has not reversed. However, a bounce is possible.
The latest recovery from today’s drop looks strong, but the charts suggest it could be just a short-term bounce before another leg down. Indicators suggest a short-term setup that could lift PI a bit before sellers regain control.
Short-term crossover could trigger a short-term pullback
The 12-hour chart shows Pi Coin is about to form a short-term bullish cross — a pattern that often triggers small rallies.
This occurs when the 20-period Exponential Moving Average (EMA) crosses above the 50-period EMA. EMAs track price trends over time, with more weight given to recent candles. When the fast line (20 EMA) crosses above the slow line (50 EMA), it signals a reversal in short-term momentum. This pattern is also known as a “Golden crossover.”
 Golden crossover imminent: TradingView
Want more Token analysis like this? Subscribe to editor Harsh Notariya's daily Crypto Newsletter here .
If that crossover is completed, Pi Coin price could bounce to the $0.26–$0.29 range, with $0.26 representing an 8.6% upside target. Breaking above $0.26 would also mean reclaiming the 100-period EMA, which could give traders a bit more confidence.
But short-term momentum alone is not enough. Without strong cash flow or whale support, this bounce could quickly run out of steam.
Weak cash flow makes recovery scenario fragile
Chaikin Money Flow (CMF) — an indicator that tracks large money flows into and out of an asset — has been declining since October 26, 2025.
From 26/10/2025 to 29/10/2025, Pi Coin made higher Dip , but the CMF line turned down and fell below 0. This divergence shows that large wallets and institutions are not backing the rally. Instead, it is possible that small traders are leading this movement.
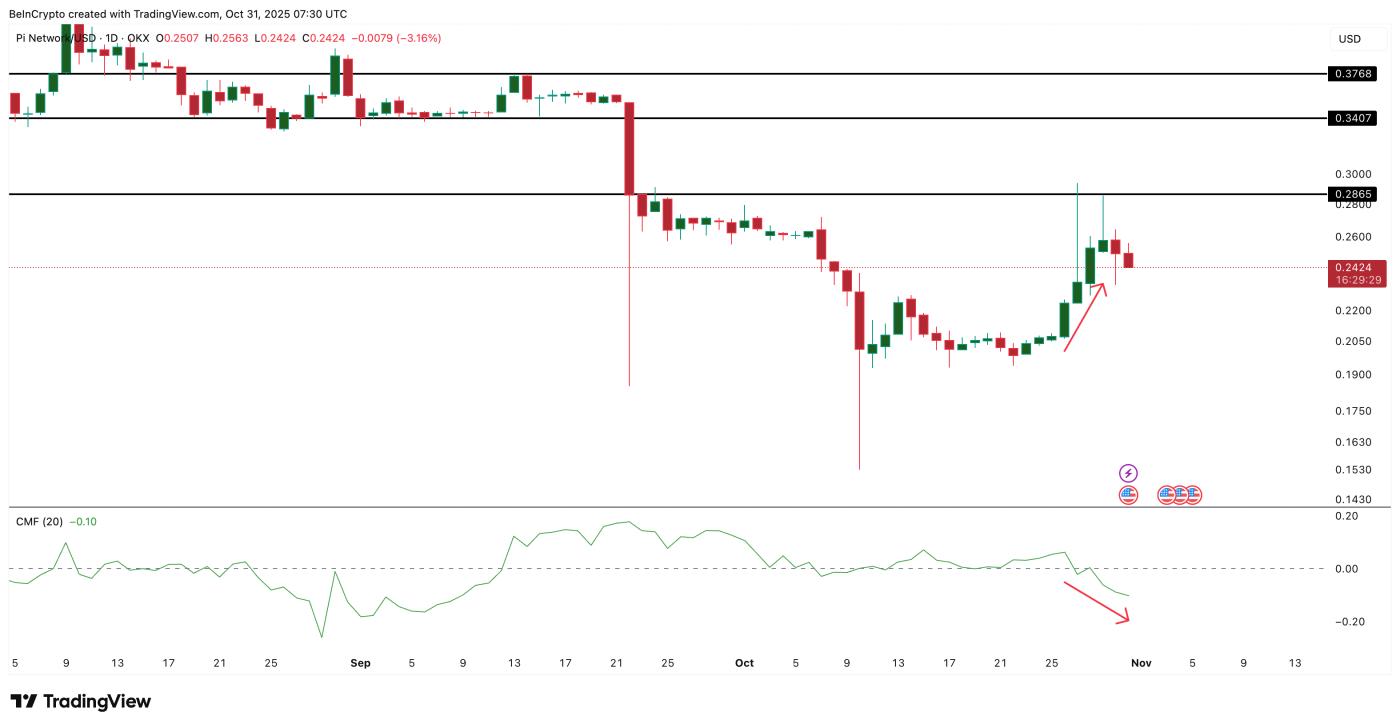 Pi Coin Whales Not Interested: TradingView
When the CMF falls below zero, it typically signals that large sellers are stronger than large buyers — even when the price looks stable.
So, while the EMA suggests a bounce, the lack of whale participation will limit the upside. Pi Coin's bullish momentum could fade near resistance, setting up the next correction.
Hidden Bearish Divergence Signals Next Pi Coin Price Drop
The daily PI chart shows why traders should be cautious. Between September 13, 2025 and October 29, 2025, Pi Coin made a lower high. The Relative Strength Index (RSI) — a measure of buying and selling momentum on a 0–100 scale — made a higher high.
That's a hidden bearish divergence, a technical signal that suggests a broader downtrend could resume as the short-term rally fades.
Pi Coin is currently trading near $0.24, right on a key support level. Holding this level could trigger a small pullback to $0.26 and $0.28. However, losing $0.24 could drag the price down to $0.22 or even $0.18.
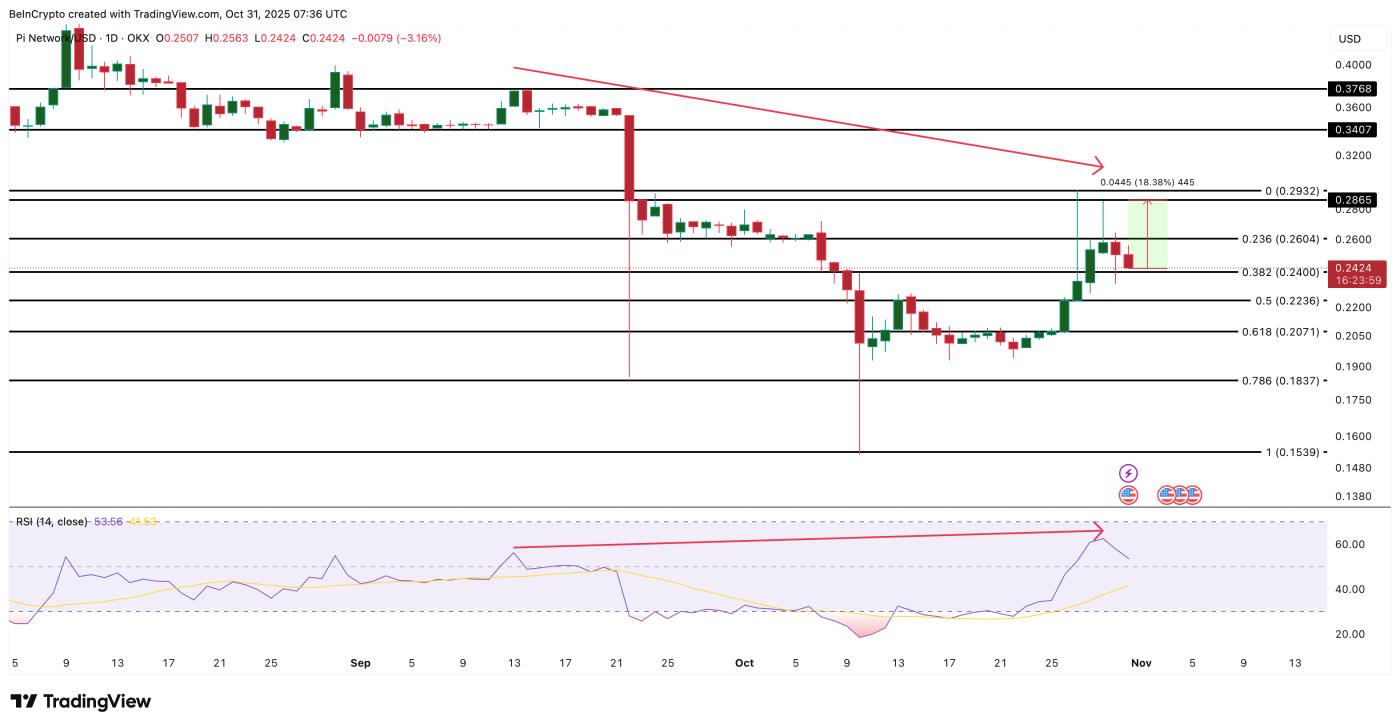 Pi Coin Price Analysis: TradingView
If selling pressure increases, $0.15 could also be the next downside target for Pi Coin price. However, if CMF returns to positive territory while the crossover is complete, the rebound of Pi Coin price could be stronger. In that case, the bearish conclusion for the price movement would be negated.


