Bitcoin's start to November has disappointed traders again. The price has fallen 2.4% in the past 24 hours and is down 6.2% over the past week.
While the market is stuck in a pattern of short-term recovery and deeper correction, on-chain data now points to another, potentially significant, pullback before the next bullish phase begins.
NUPL shows that the market Dip has not been fully reached.
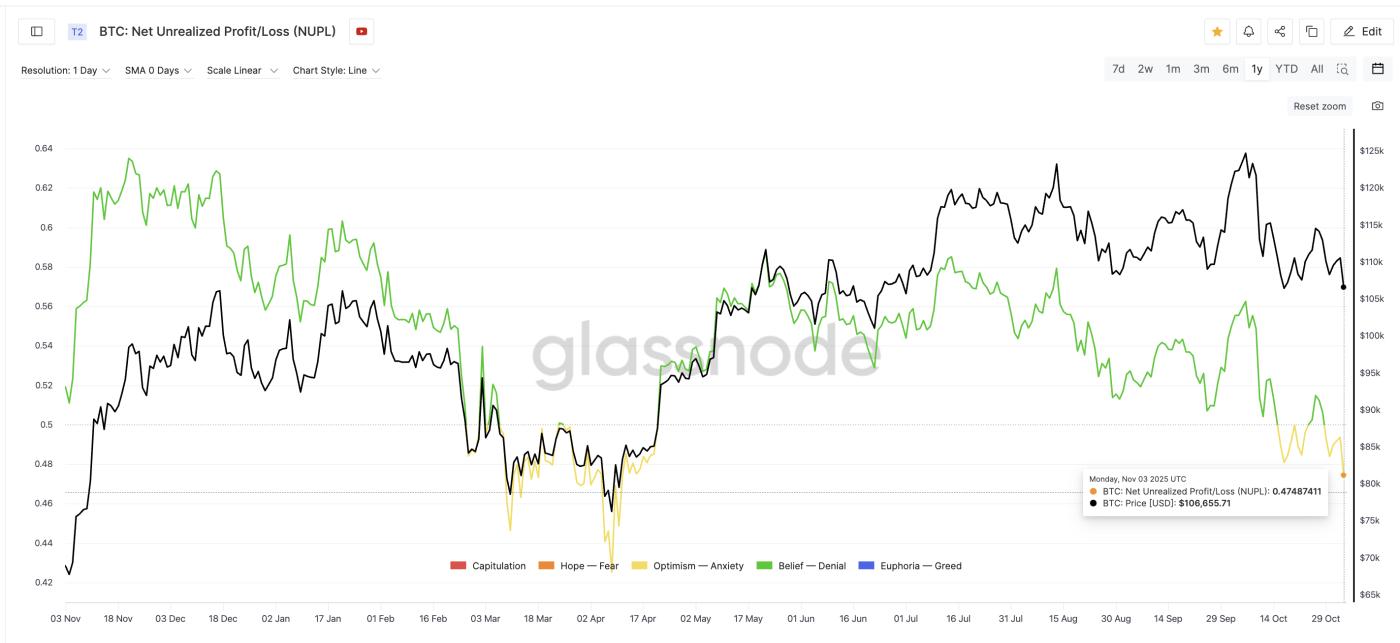
The Unrealized Profit/Loss (NUPL) shows the profits or losses thatBitcoin investors are holding. When NUPL values drop sharply, it signals that holders are losing the incentive to sell — often establishing the next Dip .
Bitcoin's NUPL is currently at 0.47, its lowest level since April 8, when it fell to 0.42. In the previous cycle, Bitcoin's NUPL fell three times — 0.48 on February 26, 0.44 on March 10, and 0.42 on April 8 — before Bitcoin rose from $76,000 to above $125,000.
 Bitcoin NUPL Needs to Drop Lower: Glassnode
Want to know more about Token like this? Sign up for Editor Harsh Notariya's daily Crypto Newsletter here .
This time, the index started falling in late October. And the current reading matches the first phase of the previous decline, the level on February 26. If this structure repeats, the next phase of decline — towards 0.42–0.44 — could come in early to mid-December, marking a consolidation period before a recovery takes place.
As NUPL falls, this could lead to a steady BTC price drop. This seems very likely, right now!
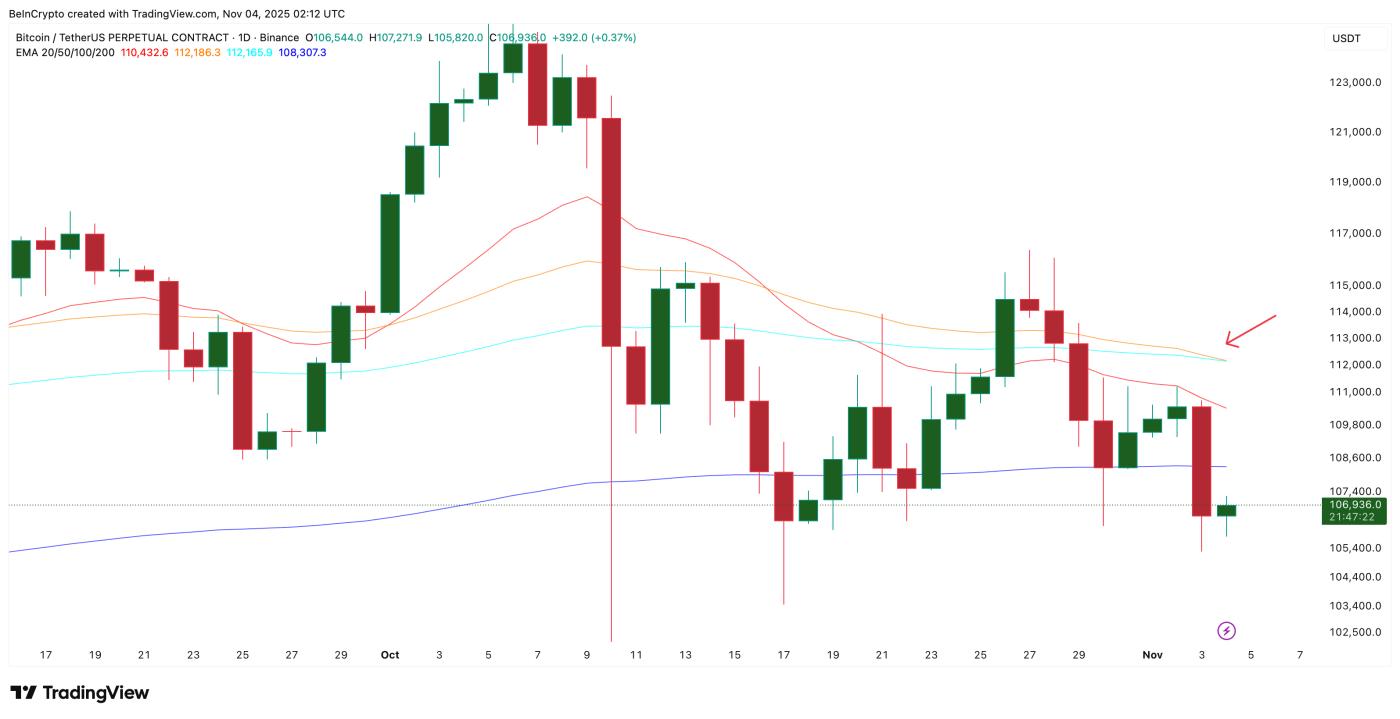
A bearish cross could be a trigger signal — and it's happening right now
A “bearish crossover” occurs when a short-term exponential moving Medium , or EMA (like the 50-day), crosses below a longer-term one (like the 100-day). On Bitcoin’s daily chart , this crossover is forming right now — and it’s significant.
Exponential Moving Average (EMA) is a short-term trend indicator that tracks price movements by giving priority to recent movements. It helps identify whether buyers or sellers are in control of the current market.
From a buyer-seller perspective, this indicates that short-term sellers are gaining ground over long-term holders. This reflects a shift in control: recent buyers are exiting, while long-term investors are hesitant to buy until they see a clear return to strength.
 Bitcoin's Next Bearish Trigger: TradingView
This setup often triggers panic selling, forcing weak investors out of the market before a new consolidation begins. If the 50-day EMA breaks below the 100-day EMA completely and the price fails to recover quickly, this could trigger a short, sharp liquidation, pushing NUPL down to its last base (0.42–0.44).
Important Bitcoin Price Levels to Watch
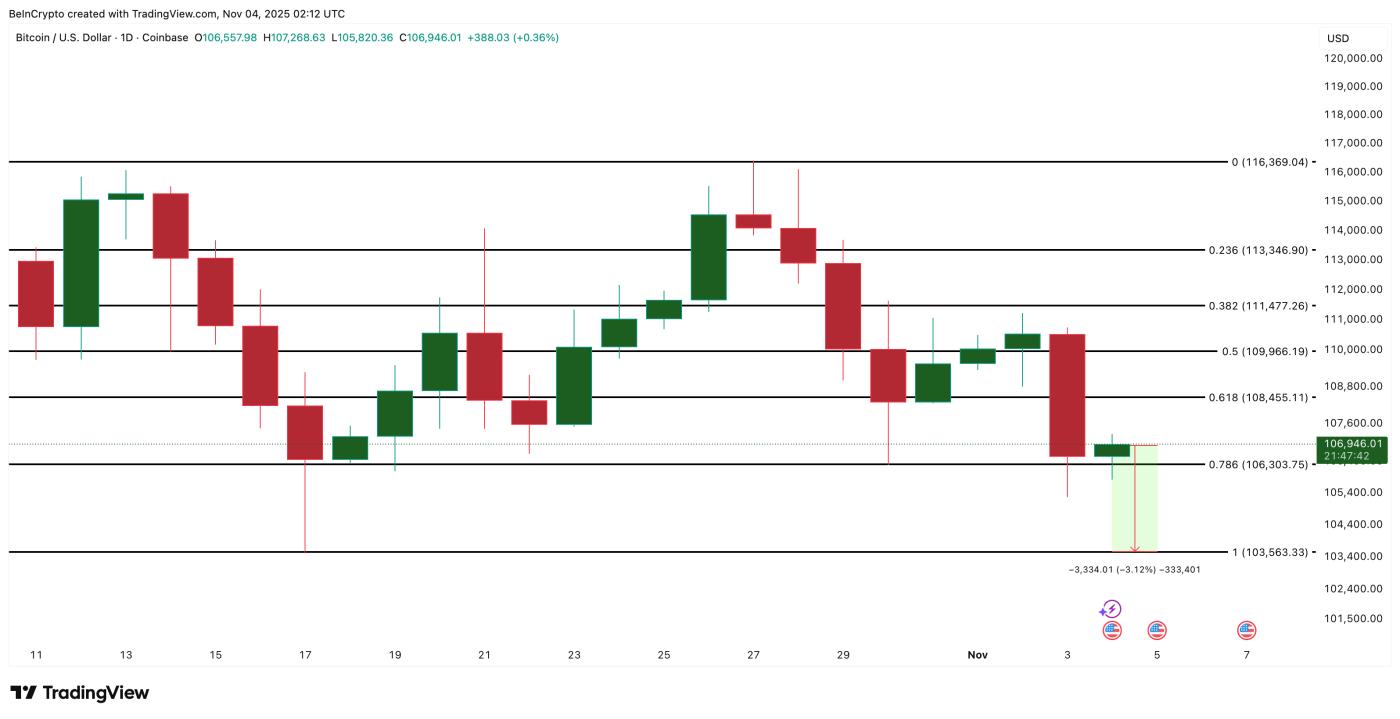
Bitcoin is currently hovering near $106,900, just above the 0.786 Fibonacci retracement level at $106,300. This level Vai as short-term support in October. If this level breaks, the next target is near $103,500. This could lead to a 3%–4% pullback and then push NUPL down. If that level breaks, BTC could fall further.
 Bitcoin Price Analysis: TradingView
However, a strong daily close above $111,400 would see the short-term structure revert to an uptrend. This level has Vai as resistance since October 30. A break above this level would invalidate the bearish cross effect and open the way to the $113,300 region. However, such a strong Bitcoin rally would also invalidate the NUPL-based Dip theory, at least for now.


