Author: Matt Crosby, Chief Analyst, Bitcoin Magazine Pro; Translated by: Shaw Jinse Finance
While many remain focused on how high Bitcoin can go in the current bull market (though given the current price action, the rally may be unsustainable), it's equally important to prepare for what's to come. Here, we'll explore some data and mathematical models to help estimate where the bottom of Bitcoin's next bear market might be. This isn't a prediction, but rather a framework built on past cycles, on-chain valuation metrics, and even Bitcoin's fundamental valuation.
Cycle Main Chart
One of the most stable and accurate models for identifying Bitcoin's cyclical bottoms is what we call the Bitcoin Cycle Master Chart , which aggregates a number of on-chain indicators to create a range around the price with specific valuation levels.
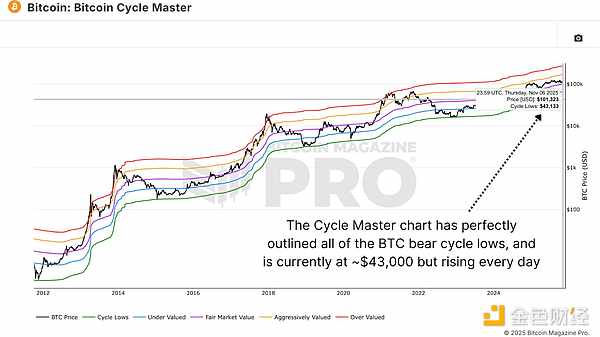
Figure 1: The cycle low line on the main Bitcoin cycle chart is precisely aligned with the bear market cycle low.
Historically, this green "cycle low" line has almost perfectly marked Bitcoin's macro bottoms. From $160 in 2015 to $3,200 in 2018, and then to $15,500 at the end of 2022. Currently, this range is around $43,000 and is rising daily, providing a useful benchmark for estimating the potential decline in Bitcoin during its next full cycle.
The pullback has decreased.
Additionally, we can look at the raw MVRV ratio, which measures the ratio between Bitcoin's market price and its realized price (the average cost basis of all Bitcoins). Historically, during deep bear markets, Bitcoin's price has tended to fall to 0.75 times its realized price, meaning the market price is approximately 25% lower than the network's total cost basis .
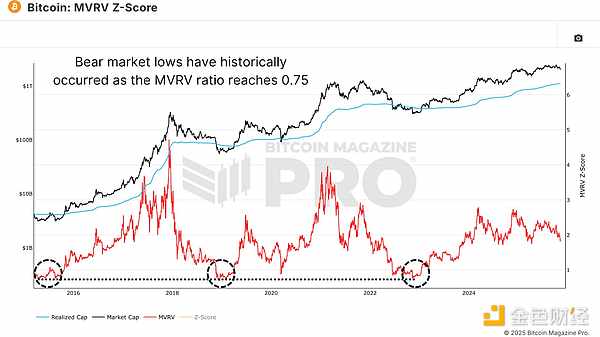
Figure 2: Historically, a bear market low has occurred when the MVRV ratio drops to 0.75.
This repeatability provides a strong benchmark, combined with a trend of gradually narrowing declines, to estimate potential downside risks. While Bitcoin's early cyclical declines reached as deep as 88%, this figure has been steadily compressing, reaching 80% in 2018 and 75% in 2022. If this trend continues, the next bear market correction is expected to be around 70% lower than the cyclical high .
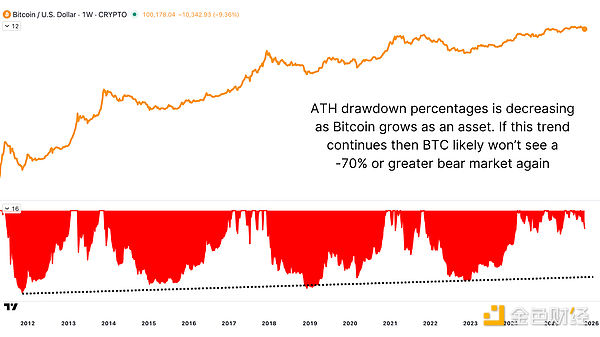
Figure 3: The trend of gradually decreasing retracement in a bear market cycle suggests that the next pullback from the cycle high will not exceed 70%.
Before predicting the next low, we need to make reasonable assumptions about the potential peak of this bull market. Based on historical MVRV multiples and realized price growth trends, Bitcoin has recently tended to peak at around 2.5 times its realized price . If this relationship remains unchanged and the realized price continues its upward trend, then this suggests that the price of Bitcoin could reach a peak of approximately $180,000 per coin by the end of 2025.
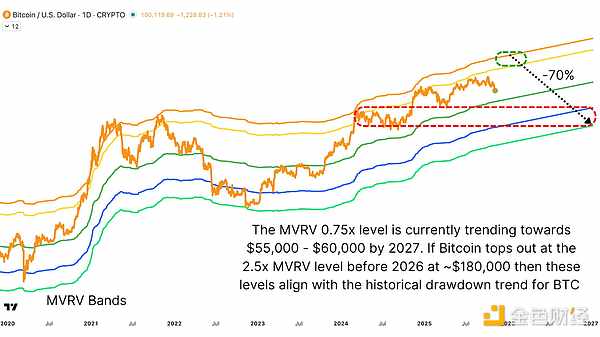
Figure 4: By applying MVRV multiples and realized price forecasts, we can see that the cycle top is around $180,000, followed by the bear market cycle bottom in 2027 around $55,000 to $60,000.
If this is indeed the case, and Bitcoin follows its historical pattern by entering a year-long bear market in 2027, then a 70% pullback from the current price would place the next major cycle low between $55,000 and $60,000. This coincides with the consolidation range of Bitcoin's fluctuations last year , creating a certain resonance on a technical level.
Production costs
One of the most reliable long-term valuation metrics for Bitcoin is its production cost, which is the estimated electricity cost required to mine one Bitcoin . Historically, this metric has been closely correlated with the lowest points of Bitcoin bear markets. After each halving, the production cost doubles, creating a rising structural support level below the price over time.
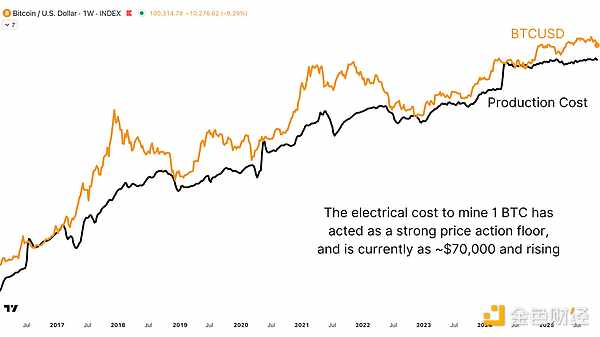
Figure 5: The estimated electricity cost to produce 1 Bitcoin is approximately $70,000, which constitutes a strong lower bound for price volatility.
When Bitcoin trades below its production cost, it indicates pressure on miners and often signifies a prime opportunity to accumulate wealth. Since the April 2024 halving, the new cost base has risen significantly, and each time Bitcoin's price has approached or slightly fallen below this level, it has marked a local bottom followed by a substantial rebound. Currently, this figure is around $70,000, but it fluctuates daily.
in conclusion
Each Bitcoin cycle is accompanied by a wave of frenzy, with people proclaiming, "This time it's different." But the data proves otherwise. While institutional adoption and broader financial integration have indeed altered Bitcoin's structure, they haven't eliminated its cyclical nature.
Data suggests that the next bear market may be relatively mild, reflecting a more mature market and a more significant liquidity-driven factor. A price pullback to the $55,000 to $70,000 range does not signify a collapse, but rather marks the continuation of Bitcoin's historic expansion and reset cycle .


