History doesn't simply repeat itself, but it often rhymes. In this episode by renowned YouTuber David Lin , Gareth Soloway, a 27-year veteran trader who witnessed the dot-com bubble and the 2008 financial crisis, will analyze the similarities between the current market and historical market tops. He believes that driven by the AI concept, market valuations have severely overdrawn the future, and a crucial turning point has arrived; a 10% to 15% correction is just the beginning.
Gareth not only issued warnings about the stock market, but also expressed caution about the short-term trends of Bitcoin and gold. He systematically explained, from multiple perspectives including macroeconomics, industry insights, and technical charts, why he believes investors urgently need to prepare for the upcoming market turmoil.
The Relationship Between the AI Bubble and the Labor Market and Monetary Policy
Host: There's no doubt the market is currently in a very interesting period. I noticed an article where Kevin Hassett, a former senior economic advisor to Trump, suggested that artificial intelligence might be leading to a "calm period" in the labor market. He mentioned that despite strong GDP growth in the second quarter of 2025, companies might reduce their need to hire college graduates because AI improves the productivity of existing employees. I've also seen reports of large consulting firms like McKinsey losing business as clients have moved to cheaper, leaner AI consulting firms. Do you think AI is a major driver of the stock market rally, but at the same time causing a slowdown in the labor market?
Gareth: First, AI has undoubtedly contributed to the stock market rally. Data shows that 75% of the S&P 500's gains over the past two years have been directly related to AI-related stocks, with AI stocks consistently leading the market higher . However, I don't agree that the current weakness in the labor market is partly due to the AI boom. AI will inevitably have a greater impact on employment sooner or later , but the real reason right now lies in the significant uncertainty within the business sector.
Of course, the stock market appears to be rising, but the reality is that people are still suffering from inflation, and I believe the actual inflation is higher than reported, causing consumers to slow down their spending (as seen in the performance of companies like Cava and Chipotle). This decrease in consumer spending has forced these companies to pause hiring.
Host: The Federal Reserve is about to end quantitative tightening (QT) and may inject more liquidity through continued interest rate cuts. Do you think this will further boost the overall stock market? In other words, will the AI bubble get even bigger?
Gareth: I think the AI bubble is at an inflection point. I believe the stock market has peaked and will see at least a 10% to 15% pullback. In fact, I mentioned before that a 10% pullback might begin in October, and the market did indeed peak at the end of October. While the decline from all-time highs hasn't been significant, I do believe a downward trend has begun. I want to discuss some of the reasons for this, as they are very noteworthy.
First, there's the valuation metric. Current valuations are incorporating revenue from the next 5 years (until 2030) or even further into the stock price, meaning the price is priced in unrealized gains, which carries significant risk.
Secondly, we must discuss how the funds flowed back and forth . For example, AMD received billions of dollars in investment from OpenAI, but in return, AMD gave OpenAI warrants to buy 100 million shares of AMD stock. Nvidia also gave OpenAI money so that OpenAI could buy or borrow chips from Nvidia. This is, in a way, a classic "Ponzi scheme" designed to maintain this positive momentum, while the reality is that the ecosystem is not as stable as it seems. Many companies also admit that "AI is great, but currently difficult to monetize."
I do believe that AI is the future, but the question is, at this point in time, is it really worth such a high valuation?
Another significant issue is data centers . Data center construction is currently stalled. Remember, the surge in AI stocks is largely due to the need to build all these data centers, and the need for chips. But the key point is that Microsoft has halted construction on two data centers, and Micron has halted one. Why? Because there isn't enough power. They need to obtain power, and they can't simply draw from the existing grid, because doing so would likely triple residents' electricity bills. So, if you were to feed all the energy into these data centers, it would actually overwhelm the average consumer.
Finally, hyperscale data center companies are using a seven-year depreciation period to calculate the value of their chips . This is absurd. Data shows that due to rapid technological advancements and two consecutive years of high-intensity operation, a chip purchased at full price is worth only 10% of its original value after two years. When you spread depreciation over seven years, the annual depreciation becomes extremely small, making their reported profits appear higher. In reality, however, these hyperscale companies are severely overestimating their profits.
Host: The questions you've raised have indeed been ongoing for some time, but nobody knows how long this situation will last or when it will stop. So, as a trader, how do you make actual investment decisions based on this information? After all, most people might agree with you, but would also say, "We don't know when the music will stop."
Gareth: That's the scary part. If you ask ordinary people, most of them will say we're in a bubble, but they're still buying because they don't want to miss out on the rise and believe they can get out before the market reverses. This mentality was especially evident when the cryptocurrency market and other assets peaked in 2021.
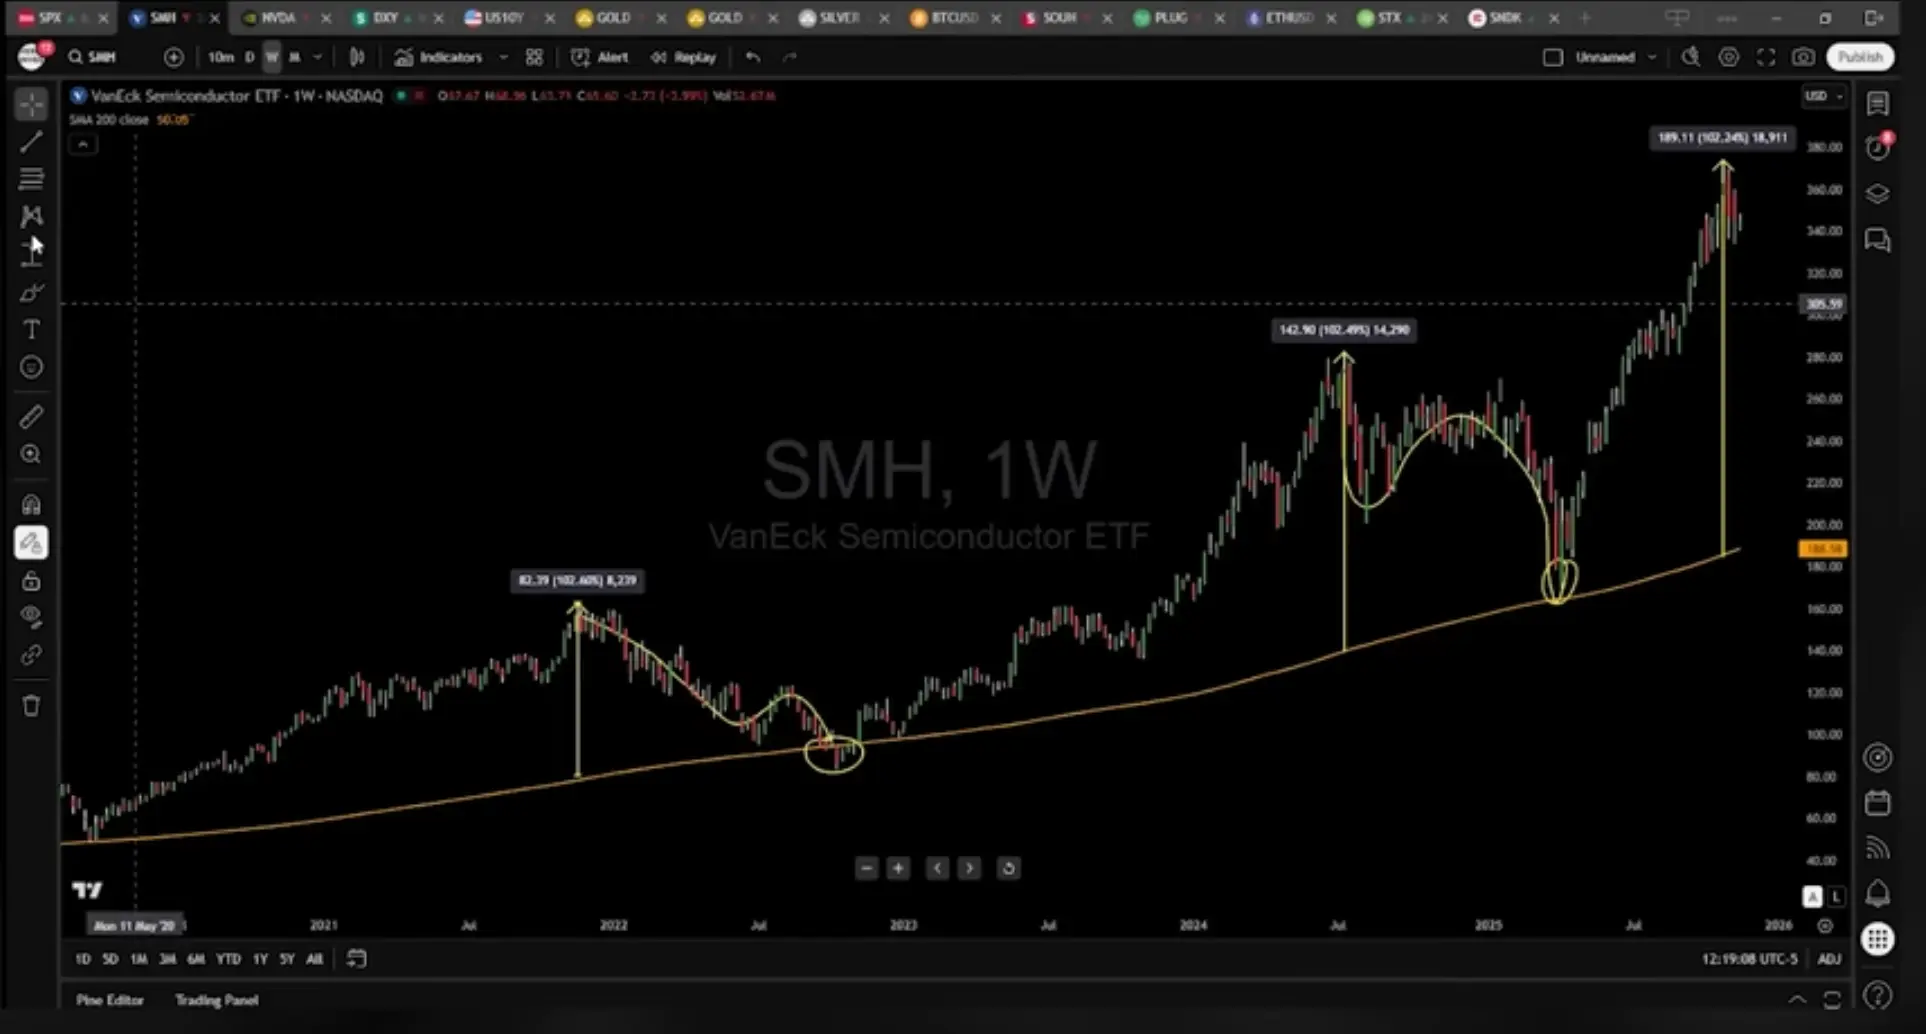
Looking at the weekly chart of the SMH (VanEck Semiconductor ETF), it basically covers all major semiconductor companies such as Broadcom, Nvidia, and AMD. The yellow line is the 200-week moving average. Looking back at 2020 and 2021, we can see a pattern in the deviation from the 200-week moving average: at past highs, the deviation from the 200-week moving average was as high as 102%, followed by a significant 45% pullback.
In 2024, the deviation also reached 102%, followed by a 40% correction in the industry. Recently, the SMH (Semiconductor Manufacturing System) again reached a deviation of 102% a few weeks ago, indicating that the market may face new adjustment pressure. The 200-week moving average acts as the market's "base camp," eventually returning to its previous level when stock prices deviate too far. Based on current data, the semiconductor industry may be about to experience a significant correction.
Market Correction and Bitcoin Analysis
Host: That's certainly worrying, because as you mentioned earlier, the semiconductor industry is closely linked to other stocks in the technology sector and the broader economy, creating a kind of circular financing effect. I suspect that if any one of the large semiconductor stocks falls, it could drag down the entire market. Do you agree?
Gareth: 100% agree. When 75% of the S&P 500's gains over the past two years have come from AI stocks, if those stocks fall, they will inevitably drag down the entire market. Furthermore, you have to consider other factors. Currently, 90% of GDP growth expectations are based on capital expenditures by these large tech companies. Now imagine if these big companies were to slightly cut their capital expenditures, the US economy could potentially fall into recession. So, we are on the verge of a correction that could trigger a larger-than-expected pullback. This market shakiness, especially in the tech sector, has already begun in the past few weeks. You've seen several very bad sell-offs; just last Friday, we experienced the biggest single-day sell-off since April.
Host: You mentioned a 10% to 15% downside expectation earlier, and some leaders of major banks have expressed similar views. Goldman Sachs CEO David Solomon also stated in Hong Kong a few weeks ago that the stock market is likely to experience a 10% to 20% correction within the next 12 to 24 months. Morgan Stanley's CEO agreed, believing we should welcome this possibility because a 10% to 15% correction is a natural part of the cycle and not driven by some kind of macroeconomic cliff effect. They seem to think that even in a bull market, corrections of this magnitude are common. So, structurally speaking, are you still bullish?
Gareth: As a short-term trader, I 'm more bearish recently, and I've been short stocks like Nvidia and SanDisk.
Let me show you this chart of the S&P 500 index, and I'll show you why we may have already reached a top. A clear trend line forms from the 2020 COVID-19 low to the 2022 bear market low, and the S&P 500 has now touched the upper trendline, which is parallel to the 2021 bull market high. Historical data shows that when the market touches the upper trendline of this channel, a bear market-level pullback has occurred.
Based on this, I believe a correction has begun, and the S&P 500 has topped out. The market is currently fluctuating because "buy the dip" investors have been brainwashed by large institutions and governments into believing that the market will never fall by more than 2% to 3% . When a 10% to 15% correction actually occurs, they will be very surprised.

Host: Which tech stock do you think is most overvalued? You mentioned that you are short Nvidia.
Gareth: I'm more inclined to short the semiconductor sector broadly. I think short Nvidia ahead of its earnings report is a bit risky, as it always has the potential to rise $10 or $20 after the report and then fall back down. There's a significant risk of pullback in the long term, both in terms of valuation and technicals.
I'm also short and observing stocks like SanDisk that have moved very vertically last year/this year—these weekly charts suggest a reasonable pullback of 20%–30%. I'm not denying the fundamentals of these companies, but their technicals, valuations, and market structure make them very risky in the short term.
Another important point to remember is that funds don't completely withdraw at the very beginning of a market top . In the early stages of a top formation, such as in 2007, we typically see a pullback, followed by a strong rally, then another pullback, and another rally, as buyers are trained to buy on dips. The biggest drops occur towards the end of the cycle, when everyone gives up and panics. Therefore, the initial formation of a top is usually slow because there's still buying pressure, but as prices fall, the rate of decline accelerates.
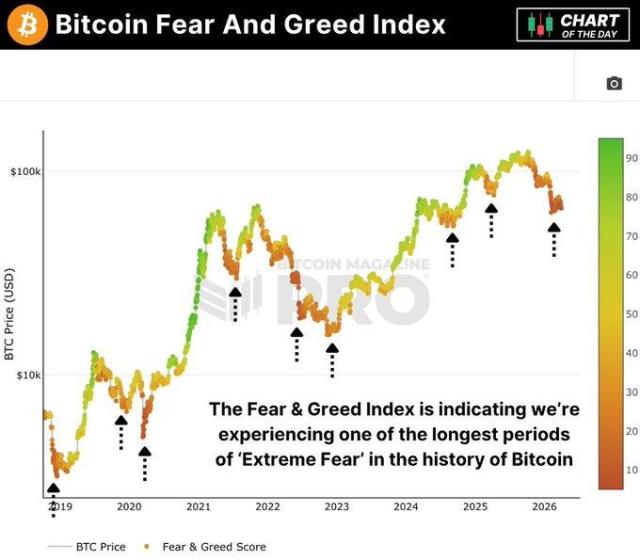
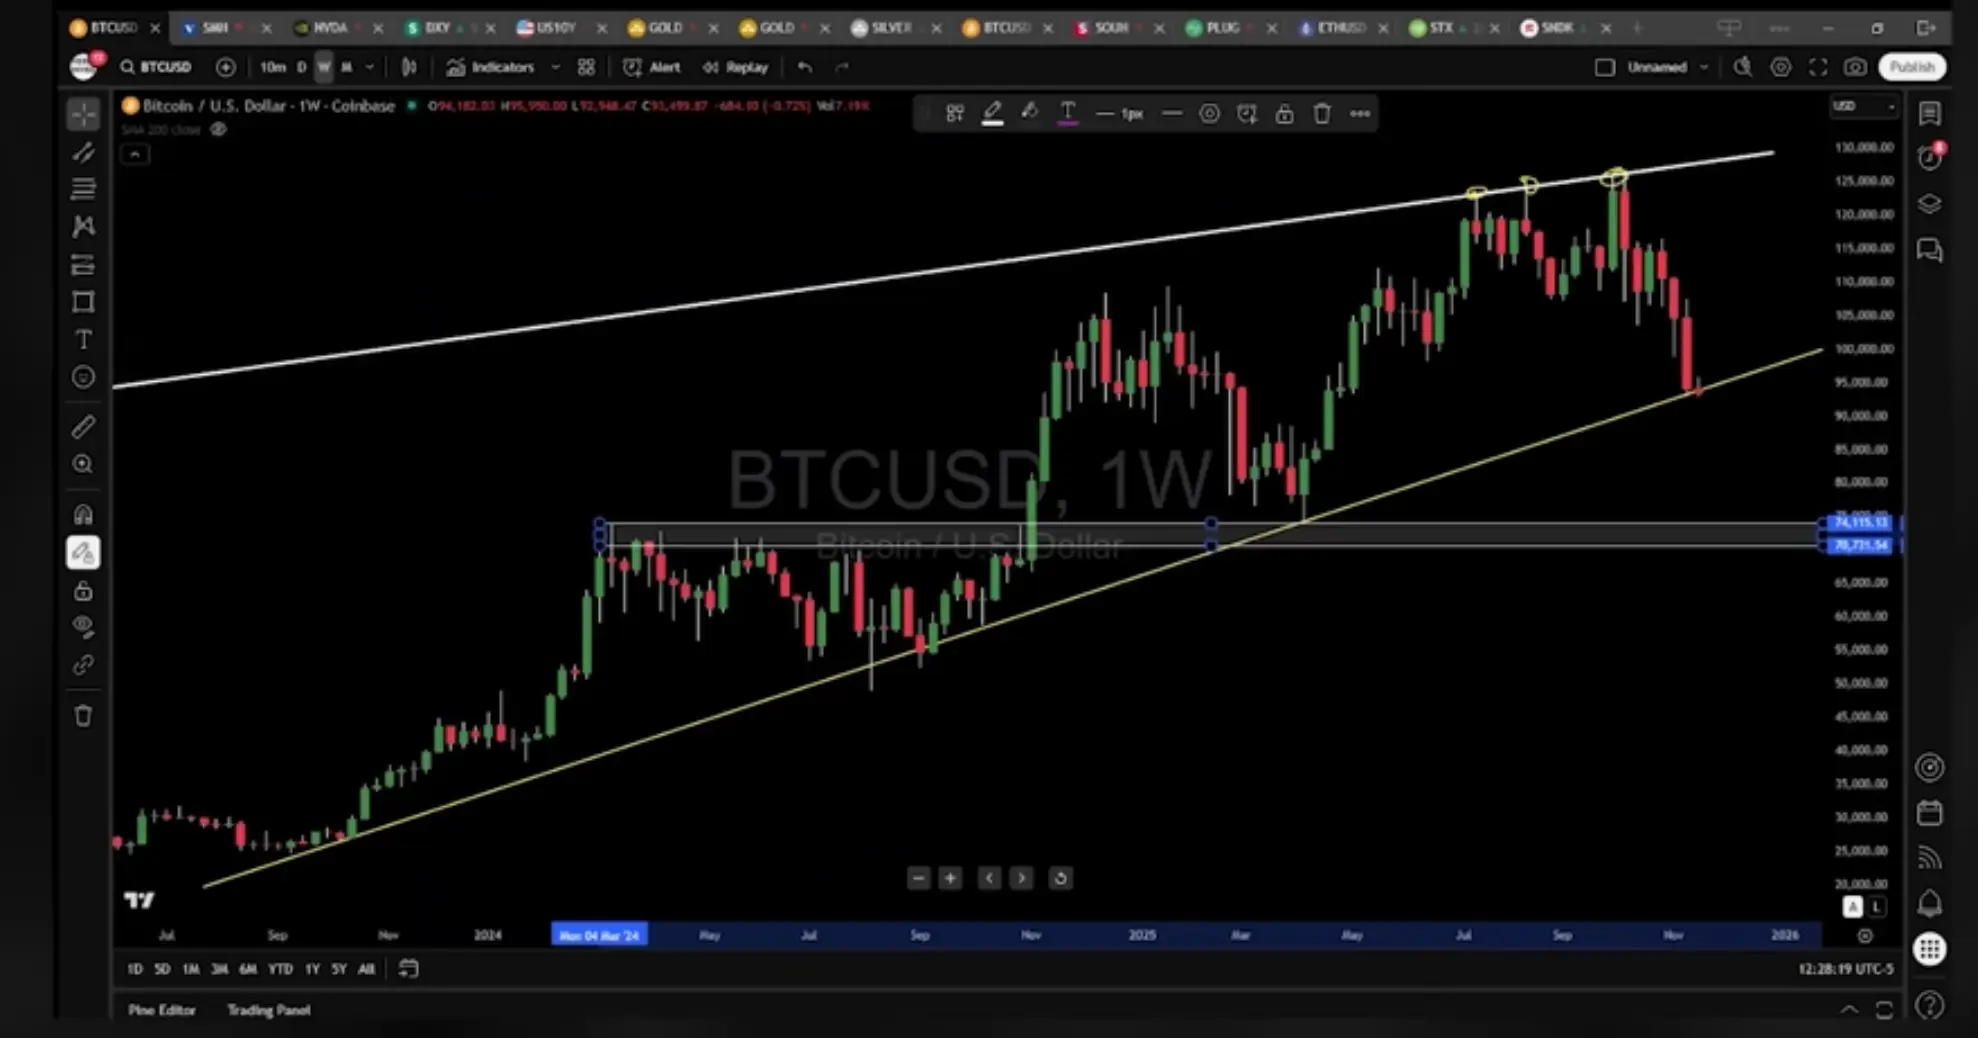
Host: Okay, let's turn to Bitcoin. We'll be back later to ask Gareth for his year-end forecast for the S&P 500. Bitcoin has seen a significant pullback, falling below $100,000 and now below $95,000. What are your thoughts on Bitcoin now and the key support levels to come?
Gareth: From a professional perspective, this high point was actually quite easy to identify. We discussed this a few months ago: if you connect the 2017 bull market high with the first high in 2021, this trend line perfectly predicted every recent top.
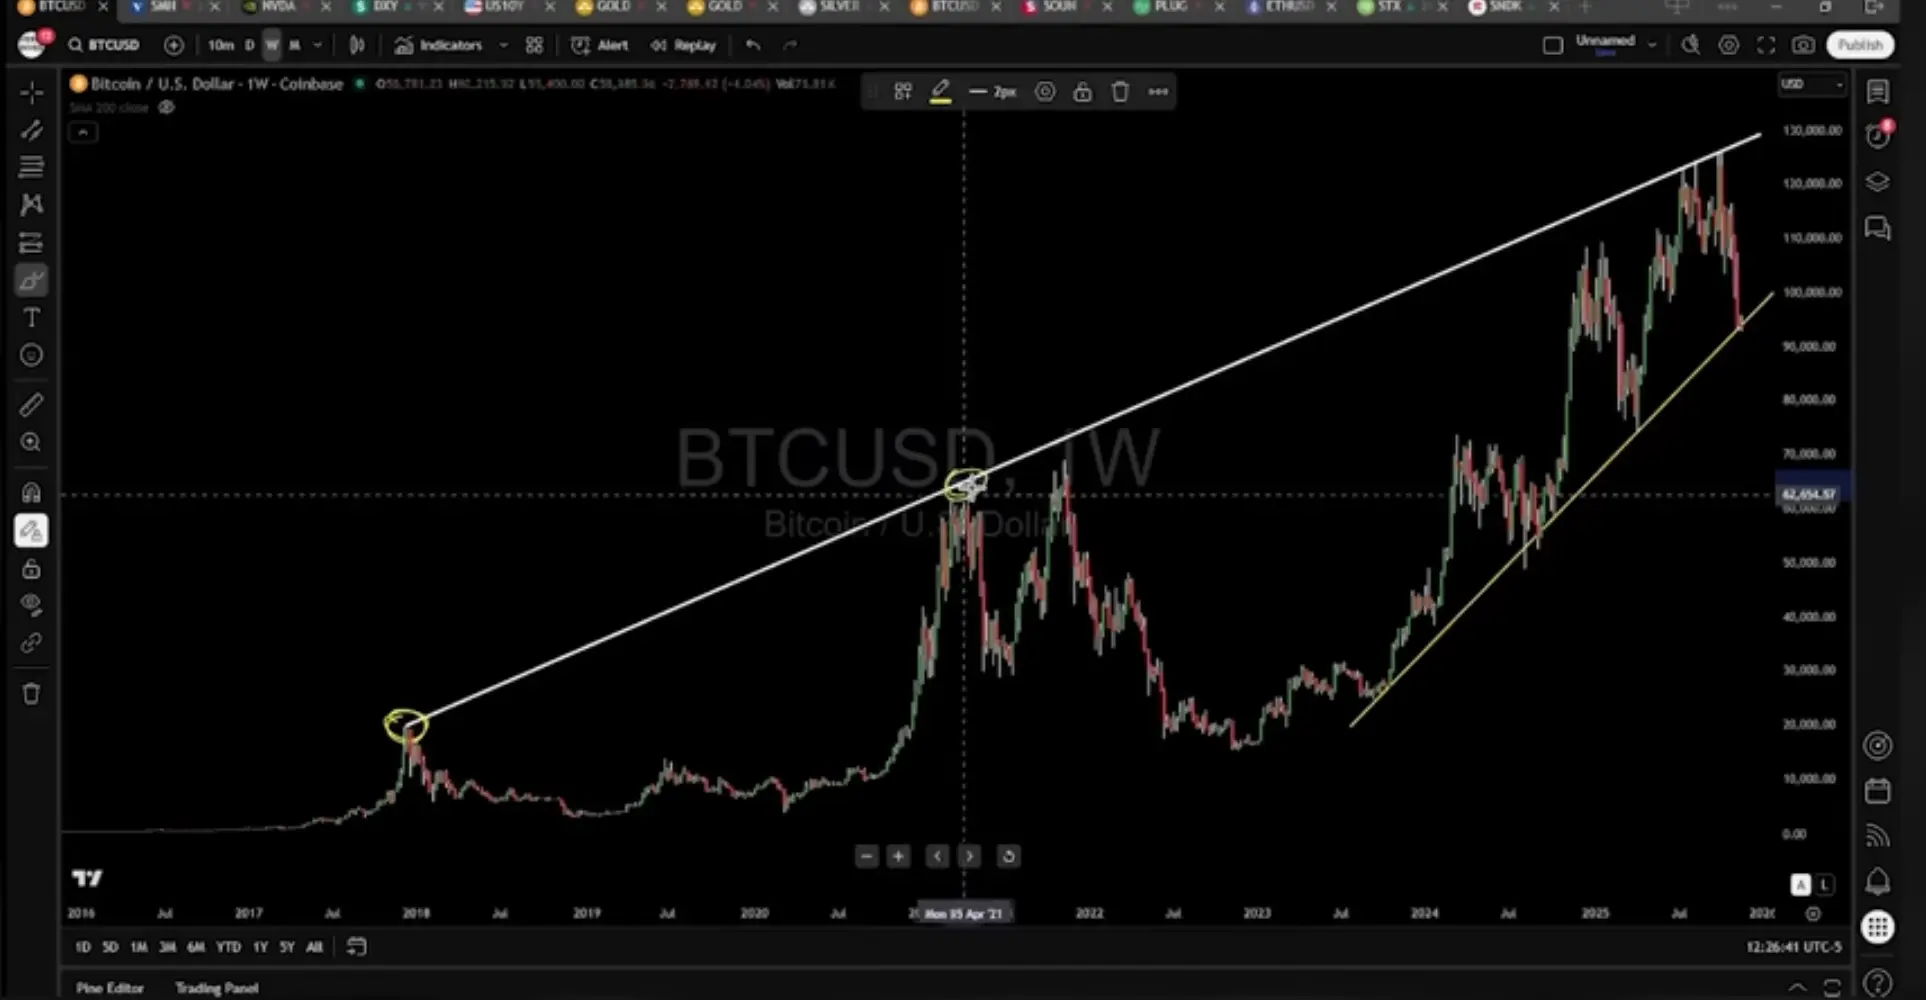
So it's clear that the white line represents a resistance level. Only if we can rise again and break through this line will the arguments of those calling for absurdly high prices perhaps become valid.

If the stock market falls and triggers panic, people will unfortunately sell Bitcoin. Currently, key support for Bitcoin is around $73,000 to $75,000 (many tops/breakouts have found support in this area) . If the bears win the battle, Bitcoin could return to $73,000 to $75,000, or even lower. If the bulls can hold this line, we could see a return to $127,000, $128,000, or even $130,000.
Host: You mentioned the risks in the semiconductor sector, and we know that Bitcoin and tech stocks are interconnected. Why do you think Bitcoin has underperformed many semiconductor stocks and the tech sector as a whole this year? Bitcoin has essentially flat this year, while the Nasdaq is still rising.
Gareth: There are several reasons:
- Bitcoin has recently become a "boring" asset . I know it sounds crazy, but when you see some chip stocks rising 30%, 40%, or even 100%, they look like the new "Altcoin" with absurd gains. By comparison, Bitcoin seems less "sexy."
- Another factor is that we're starting to see institutional buying power isn't as aggressive as it used to be . Some crypto companies that previously established Bitcoin reserves are now facing financing difficulties, leading to reduced buying activity. We're even seeing this with MicroStrategy. Due to changes in lending conditions, MicroStrategy can no longer borrow the same level of funds to make large-scale purchases as it did in the past. So MicroStrategy is still buying, but its orders are much smaller than before.
- The final factor is de-risking . If you look back, risky assets tend to peak before the stock market. Bitcoin peaked in December 2017, and the stock market peaked in January 2018. Bitcoin peaked in November 2021, and the stock market peaked at the end of December of the same year. When people start de-risking, at least for large institutional funds, they first focus on the riskiest assets, namely cryptocurrencies. So, the de-risking process starts there and then spreads to the stock market like a cold. I think we're on the verge of seeing this happen.
Host: Historically, Bitcoin and tech stocks have had a very close correlation, and Bitcoin has outperformed the stock market during past bull markets, but this time it hasn't. Does this mean Bitcoin is undervalued?
Gareth: I still believe Bitcoin will eventually outperform the stock market because it remains a reserve-like digital gold asset. So when panic hits and de-risking begins, the price will be impacted. But once the dust settles, people will find that the stock market needs to fall further, and Bitcoin can be a recipient of some of that flow. To be clear, I still think Bitcoin could fall to $73,000-$75,000, or even lower , but I will gradually buy during the decline to build a long-term holding position.
Host: Are you more optimistic or less optimistic about the Altcoin market?
Gareth: I'm cautious about Altcoin . They're always changing, and there are always new hot technologies emerging. In my opinion, Ethereum needs to drop a bit more. My swing trading buy price for ETH is between $2800 and $2700 , which is a key support level.
Gold, Risk Comparison and Long-Term Outlook
Host: Let's talk about gold. Gold is currently holding firmly above $4,000 and is consolidating. Interestingly, I've noticed that videos about gold on my channel are starting to lose popularity. A month and a half ago, when gold prices surged above $4,000, people were very excited. Now it's basically formed a bottom around $4,000, and my interpretation is that people have accepted this as the "new normal." Is this the new normal? Is $4,000 now the bottom?
Gareth: I personally believe gold still has some downside potential because it hasn't shaken out the weak hands yet. Markets typically tend to weed out these wavering holders before starting the next bull run . Comparing the gold price movements of 1979 and 2025 reveals almost identical patterns: an initial surge, followed by consolidation, and then several consecutive weeks of gains (9 consecutive weeks of green candle in 1979 and 2025 also saw 9 weeks of gains). Historically, in 1979, the consolidation retraced to key support levels before initiating a new upward trend.
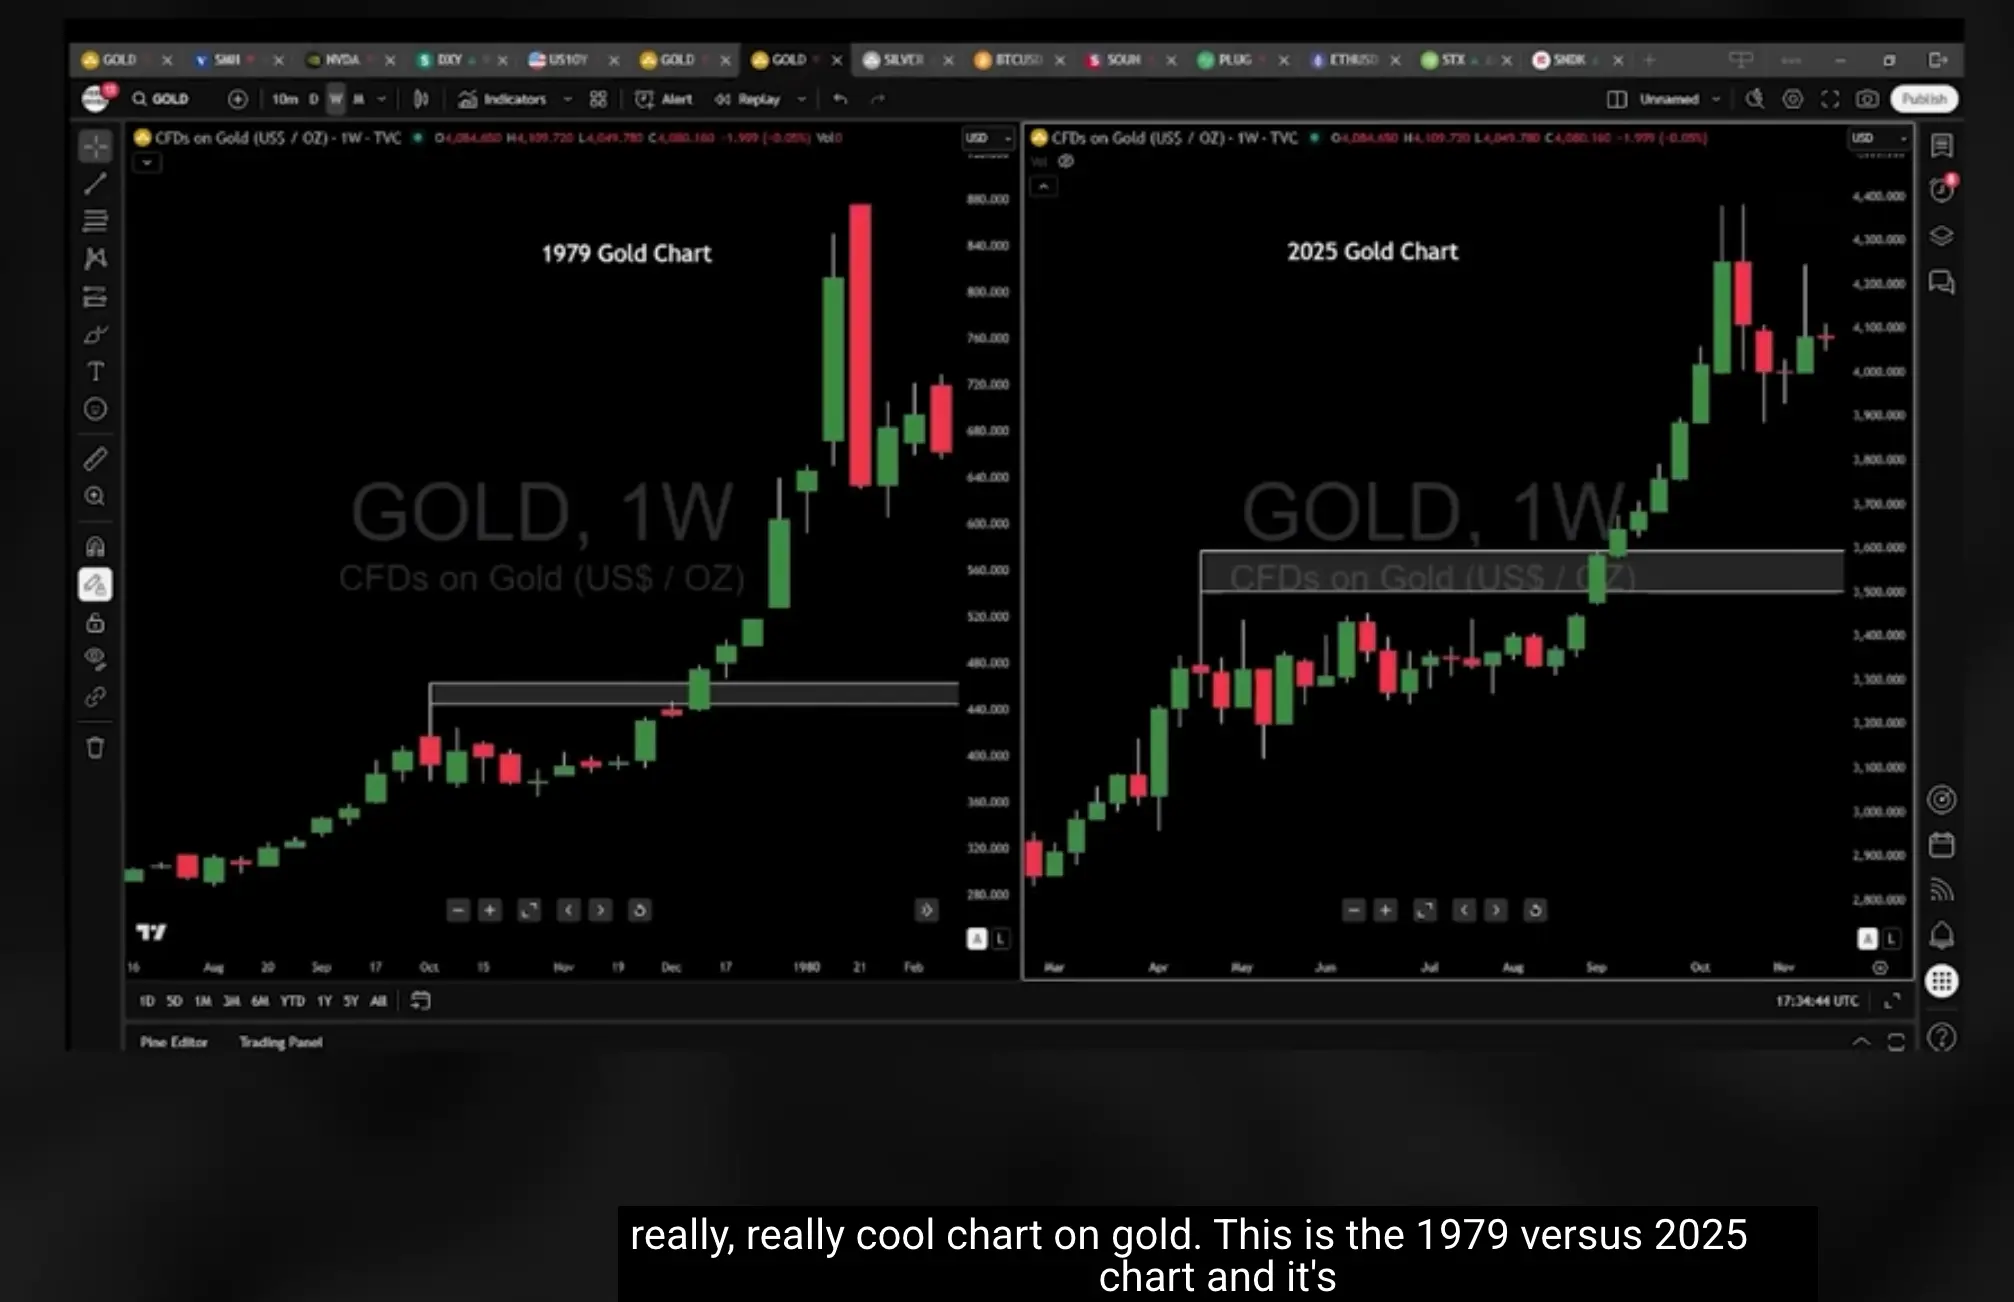
Based on this analogy, I think gold might pull back to $3,600–$3,500 before starting its next major rally. But importantly, this time is different from 1979. In 1979 and the 1980s, then-Federal Reserve Chairman Volcker was raising interest rates. Now, Powell is cutting rates. In 1979, the debt-to-GDP ratio was 32%; now it's 130%. The current government is spending recklessly. So the difference is that in 1979, it took us 20 to 30 years to see new historical highs again. This time, I think we'll return to historical highs by next year. Reaching $5,000 next year is beyond my doubt.
Host: In the short term, which asset—gold, Bitcoin, or stocks—faces the greatest downside risk? And in percentage terms, which should fall the most?
Gareth: In percentage terms, Bitcoin has the highest volatility and the greatest short-term downside risk. If Bitcoin falls to my target price of $75,000 or $73,000, that would be a drop of about 23% from current levels. If gold falls to my target level of around $3,600, that would be about a 12% drop. Regarding the stock market, we've discussed a 10% to 15% pullback. This pullback would take us back to around 6,100, which is the previous pivot high that has now become technical support. The stock market is the most uncertain for me; it may be at a cyclical high, and we could see as much as 30% to 40% downside over the next few years, although I believe there will be a rebound after a 10% to 15% pullback. In terms of allocation, I would favor gold at these discussed target prices because it is relatively the least risky, followed by Bitcoin.
Host: Structurally, you are more bullish on gold than on Bitcoin. Why?
Gareth: The main problem with Bitcoin is the sheer amount of leverage in the system. People can invest with huge sums of money. It worries me when entities like MicroStrategy hold so much Bitcoin and are using leverage. As someone who makes a living analyzing trading risk, it really makes me a little nervous. If they get into trouble and are forced to liquidate, they could cause a Bitcoin crash bigger than we've ever seen before.
Gold, on the other hand, is more diversified . Central banks around the world hold it, and they won't panic sell it, since they can print their own money anyway. So ultimately, at least for me, gold offers greater security.
Host: I'd like to share a post by Ray Dalio that echoes your earlier point about "stimulating the market within a bubble." He mentions that the Federal Reserve announced the end of quantitative tightening (QT) and the start of quantitative easing (QE), which, however described, is an easing measure. How do you think this will affect the market?
Gareth: I agree with Dalio's point: the Fed's technical shift in operations (stopping balance sheet reduction and implementing quantitative easing or similar actions) is injecting liquidity into a system that already has a bubble . The historical pattern of increasing debt during expansion and deleveraging during recession hasn't materialized in this cycle—we've been continuously accumulating debt, creating an even bigger bubble, and a bigger bubble means a bigger crash. The current situation may be even more severe than the financial crisis, and I think many people are struggling to fully grasp its scale. The US is approaching or entering a problem of a century-long cycle, which will "educate" many young investors who haven't experienced a major crash. It's often said that someone in every generation has to experience something like this. Most of those who experienced the Great Depression are no longer alive, and we seem to have forgotten those lessons— prudent financial management, avoiding overconsumption, and not accumulating huge debts.
Host: What cautionary advice would you give to young traders who haven't yet experienced a major downturn or bubble burst?
Gareth: Stay vigilant. Many new investors entered the market after the COVID-19 pandemic, and since then, we've only seen a V-shaped recovery, with the market hitting new highs within a month. They may assume the market can only go up. I've been trading since 1999, and I remember the Nasdaq taking over 15 years to reach a new high. But history isn't like that, and the market may take much longer to recover. Protecting your capital is key—trade with discipline, manage risk, and be aware of the systemic risks posed by the current monetary and debt situation. At least 60-70% of American households are likely already in recession , and the market rally has masked this reality; once the stock market falls and high-end consumption slows, in my view, regardless of the amount of capital expenditure on AI, the economy will decline.