Source: VanEck
Authors: Patrick Bush, Matthew Sigel
Original title: VanEck Mid-November 2025 Bitcoin ChainCheck
Compiled and edited by: BitpushNews
The Bitcoin sell-off was driven by medium-term holders, not long-term whale , and the futures market showed deep oversold conditions following tariff-driven liquidation.
(Note: VanEck has exposure to Bitcoin.)
Key points
Long-term whale are still holding the tokens, and tokens with an age of 5 years or more continue to grow.
The sell-off was concentrated on mid-term holders, rather than the oldest wallets.
The futures market appears to have been cleaned up, with funding costs and open interest at oversold levels.
Bitcoin (BTC) investors are fearful.
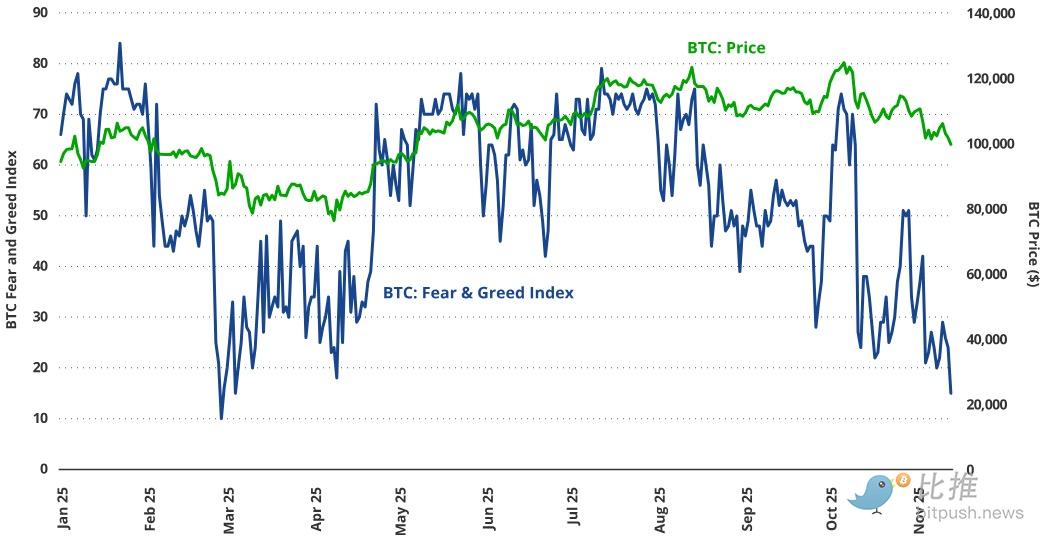
Source: Glassnode, as of November 13, 2025. Past performance is not indicative of future results. This is not intended as a recommendation to buy or sell any of the securities mentioned in this article.
ETP outflows drive early weakness
The price action over the past 30 days has been particularly unfriendly to holders, with BTC falling by 13% amid strong selling pressure.
Since October 10, 2025, 49,300 BTC have flowed out of the BTC ETP balance, representing approximately -2% of total assets under management (AUM), as weak holders who bought near price peaks chose to capitulate amid uncertainty surrounding interest rate cuts and the shattering of the AI narrative.
Even more worrying is that many people attribute the weak price to early BTC whale.
For example, a "Satoshi-era"whale sold $1.5 billion worth of BTC in the week of November 14, 2025, emptying his entire wallet. Many believe that seasoned whale often foreshadow BTC's long-term trend by buying and selling BTC at key moments. As a result, the cryptocurrency community became bearish, and the Fear/Greed Index fell to its lowest level since March 2025 when tariff panic began.
Smaller whale accumulate capital over 1-2 years, while the largest whale sell; recent net change remains flat.
Whale positions have decreased in the long term and increased in the short term.
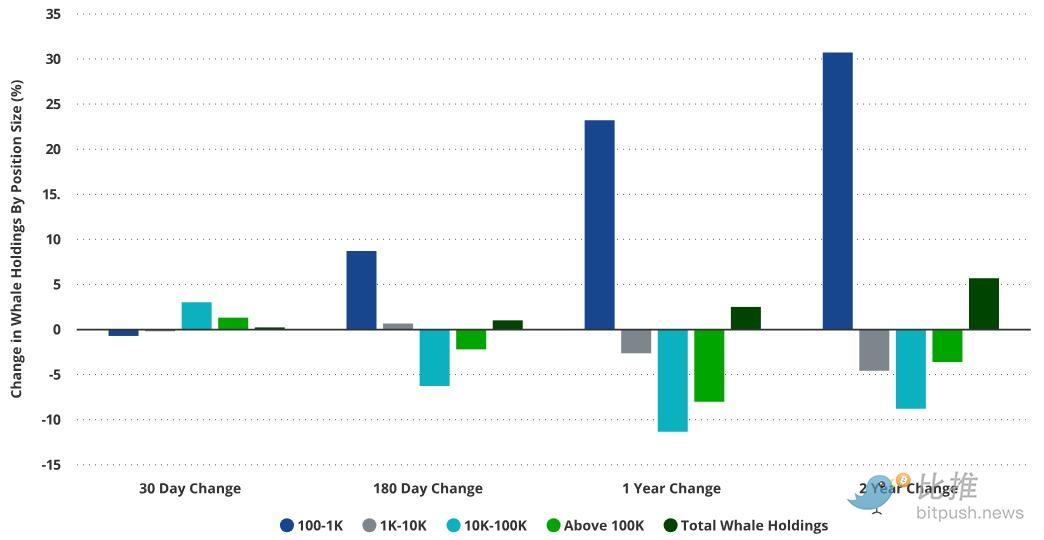
Source: Glassnode, as of November 13, 2025. Past performance is not indicative of future results. This is not intended as a recommendation to buy or sell any of the securities mentioned in this article.
Instead of assuming that the recent weakness is due to selling by large holders, it is better to examine the complete distribution of cross-group fund flows.
The on-chain situation reveals a more subtle rotation than a simple "whale sell-off." If we look at the holdings of whale with more than 1,000 BTC, we can clearly see that they have been reducing their BTC exposure since November 2023.
In fact, whale holding 10,000-100,000 BTC have reduced their supply by -6% and -11% over the past 6 and 12 months, respectively. This supply has been absorbed by smaller investors holding 100 to 1,000 BTC. These smaller investors have increased their holdings by +9% and +23% over the past 6 and 12 months, respectively. For background reference, BTC itself has risen by approximately 170% over the past two years.
Bitcoin futures (BTC) open interest rose 6% in November.
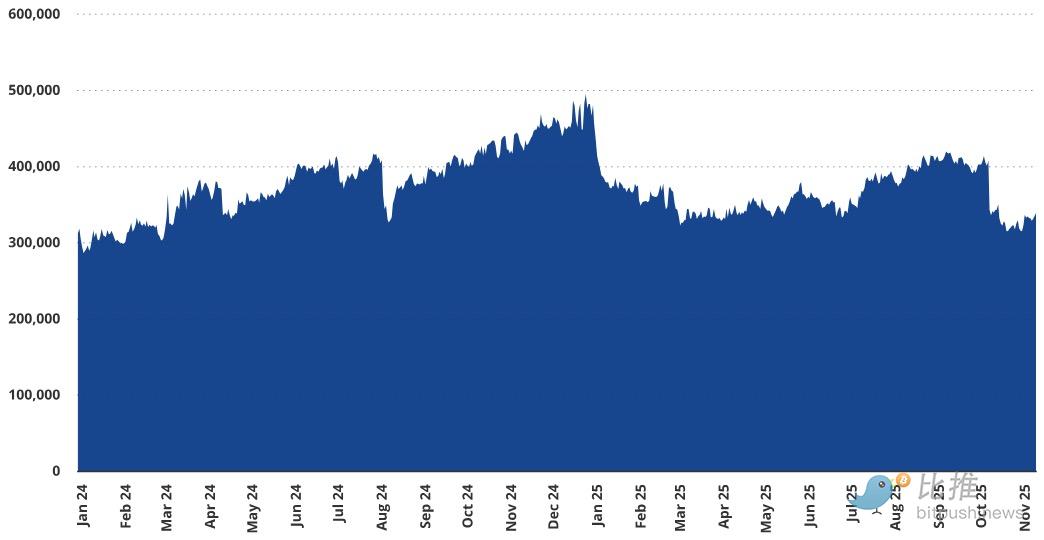
Source: Glassnode, as of November 13, 2025. Past performance is not indicative of future results. This is not intended as a recommendation to buy or sell any of the securities mentioned in this article.
Short-term whale turn into net buyers
Short-term data tells a different story: some whale groups have been accumulating. Those holding 10K–100K BTC have increased their positions by approximately +3%, +2.5%, and +84 basis points (bps) over the past 30, 60, and 90 days, respectively. This likely reflects a tariff-driven sell-off and subsequent liquidation, which reduced BTC futures open interest by approximately 19% within 12 hours and pushed prices down by over 20%.
The oldest BTC whale are holding while mid-term traders are selling.
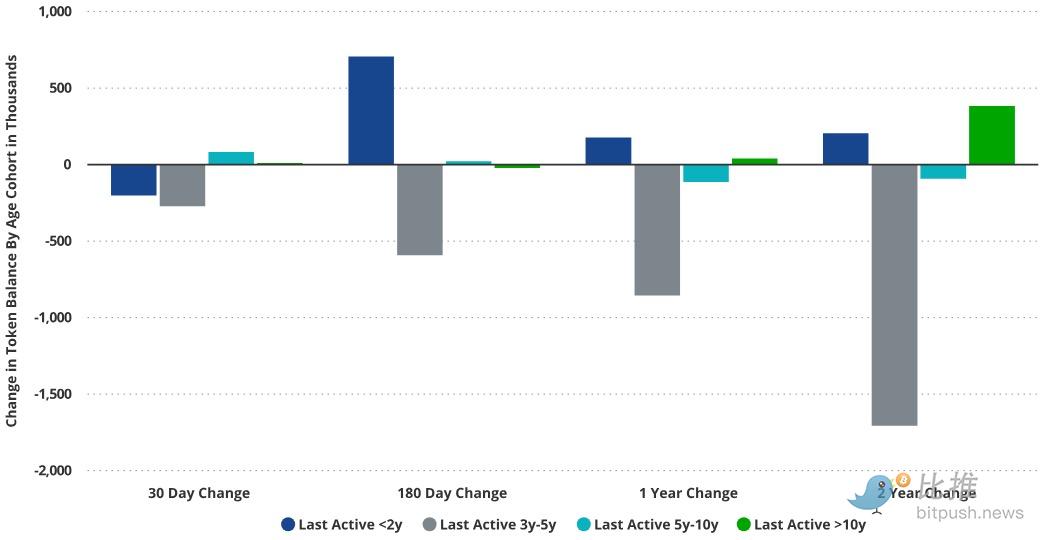

Source: Glassnode, as of November 13, 2025. Past performance is not indicative of future results. This is not intended as a recommendation to buy or sell any of the securities mentioned in this article.
Mid-term holders are the real sellers.
However, analyzing "whale data" solely by holder size provides an incomplete picture. This perspective overlooks the rotation phenomenon where experienced, older whale transfer their tokens to new, novice holders. To deepen our understanding, we examine Bitcoin balances by "last active transfer time," a metric indicating the time elapsed since the last token transfer. The implication of these transfers is that these tokens were likely sold to different holders.
Over the past 30 days, selling pressure has been concentrated on tokens with an age of less than 5 years, while older tokens have mostly maintained or increased their holdings. Interestingly, over the past 6 months, ownership has shifted from the 3-5 year group to the 6-month-2 year group, marking a shift of funds from mid-term holders to new participants.
Among the older group—those whose tokens last moved more than 5 years ago—token turnover remains relatively low compared to other groups. In contrast, the largest outflow occurred with tokens last moved 3-5 years ago, a group that has consistently declined throughout each study period. Over the past two years, the supply of this segment of tokens has decreased by 32% as they have been sent to new addresses. Given that many of these tokens may have been accumulated during the downturn of the previous Bitcoin cycle, their holders appear to be opportunistic cyclical traders rather than long-term investors.
Meanwhile, tokens last moved more than 5 years ago saw a net increase of +278K BTC (compared to two years ago). This growth reflects younger tokens aging into the 5+ year category rather than re-accumulation, but it still demonstrates the continued conviction of long-term whale. While more granular analysis may yield additional insights, the overall trend remains encouraging: the longest-term holders continue to accumulate and hold.
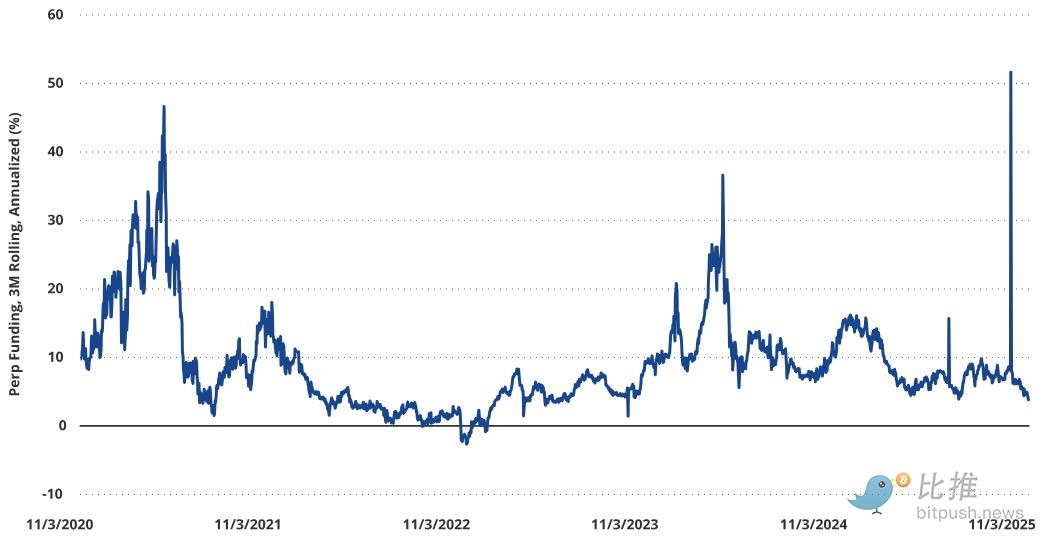
BTC futures basis is at its lowest level since fall 2023.
Source: Glassnode, as of November 13, 2025. Past performance is not indicative of future results. This is not intended as a recommendation to buy or sell any of the securities mentioned in this article.
Futures market shows speculative activity reset
One of the best indicators of speculative sentiment is the annualized basis cost paid by traders willing to long on Bitcoin perpetual futures. Because perpetual contracts never take delivery, their price is aligned with the spot price by charging interest to one side of the transaction. If the perpetual contract price is higher than the spot price, the long side must pay the short side an interest rate corresponding to the magnitude of the spot/perpetual price difference. Due to the asymmetric upside potential of cryptocurrencies, the perpetual contract basis is almost always positive.
During periods of low demand for cryptocurrencies like BTC, basis rates collapse. Recently, we've seen a sharp drop in open interest for Bitcoin perpetual contracts, falling -20% in BTC terms and -32% in USD terms since October 9, 2025. This partially explains the sharp collapse in funding rates. Of course, if people are bullish on BTC, this rate will quickly rise.
In the past, when Bitcoin was about to begin a long-term decline, there was usually a clear signal: the funding rate for perpetual contracts would surge, sometimes reaching an average of 40% on certain days. But this time is different. Since March 2024, we have not seen such a crazy increase in funding rates.
Here's an interesting anecdote—innovative protocols like Ethena, along with professional trading institutions, are engaging in large-scale arbitrage operations of "spot buying + perpetual contract short." Ethena alone reached a scale of $14 billion in October 2025, although it later shrank to $8.3 billion. However, such a large arbitrage operation has actually lowered funding rates, making this traditional indicator somewhat "distorted."
Even so, the current plunge in funding rates, combined with the large-scale liquidation of open positions in perpetual contracts, does indicate that the market has indeed overshot its mark. Another key indicator, NUPL (which can be understood as the average profit and loss level of all holders across the network), also shows that the current oversold condition is similar to that of the tariff panic in the spring of 2025 and the yen collapse in August 2024.
For investors, after a month of violent market correction, they can now more calmly look for entry points. Market panic often presents a good opportunity to position themselves.
Bitcoin On-Chain Changes Monthly Dashboard and Highlights
As of November 14, 2025
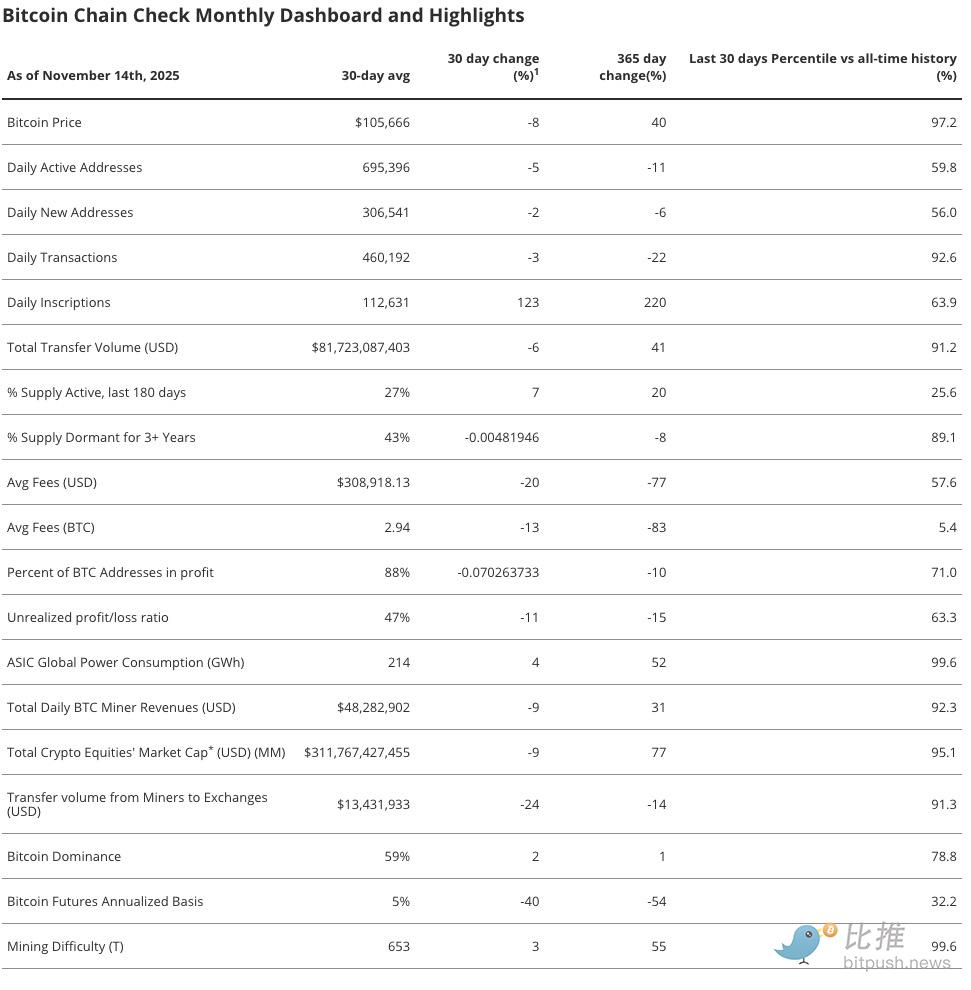
Note: The 30-day and 365-day changes are relative to the 30-day average, not absolute values.
Source: Glassnode, as of November 13, 2025. Past performance is not indicative of future results. This is not intended as a recommendation to buy or sell any of the securities mentioned in this article.
Twitter: https://twitter.com/BitpushNewsCN
BitPush Telegram Community Group: https://t.me/BitPushCommunity
Subscribe to Bitpush Telegram: https://t.me/bitpush


