

Bitcoin has fallen sharply in the past few days, hitting a six-month low as bearish momentum intensified. This drop pushed BTC below key psychological levels and left traders bracing for further downside.
However, despite the weakness, some indicators suggest that potential opportunities may emerge.
Bitcoin could repeat history
The Relative Strength Index (RSI) has entered oversold territory for the first time in nine months, indicating intense selling pressure. The last time Bitcoin was XEM oversold was in February, a period that preceded a notable recovery. Oversold conditions often suggest an impending reversal, but the exact timing remains unclear.
In the previous oversold event, Bitcoin fell another 10% before recovering. A similar pattern now could push BTC to $77,164 before buyers take control. If the decline is contained and this deeper drop is avoided, Bitcoin could recover sooner.
Want more insights on Token like this? Subscribe to editor Harsh Notariya's Daily Crypto Newsletter here .
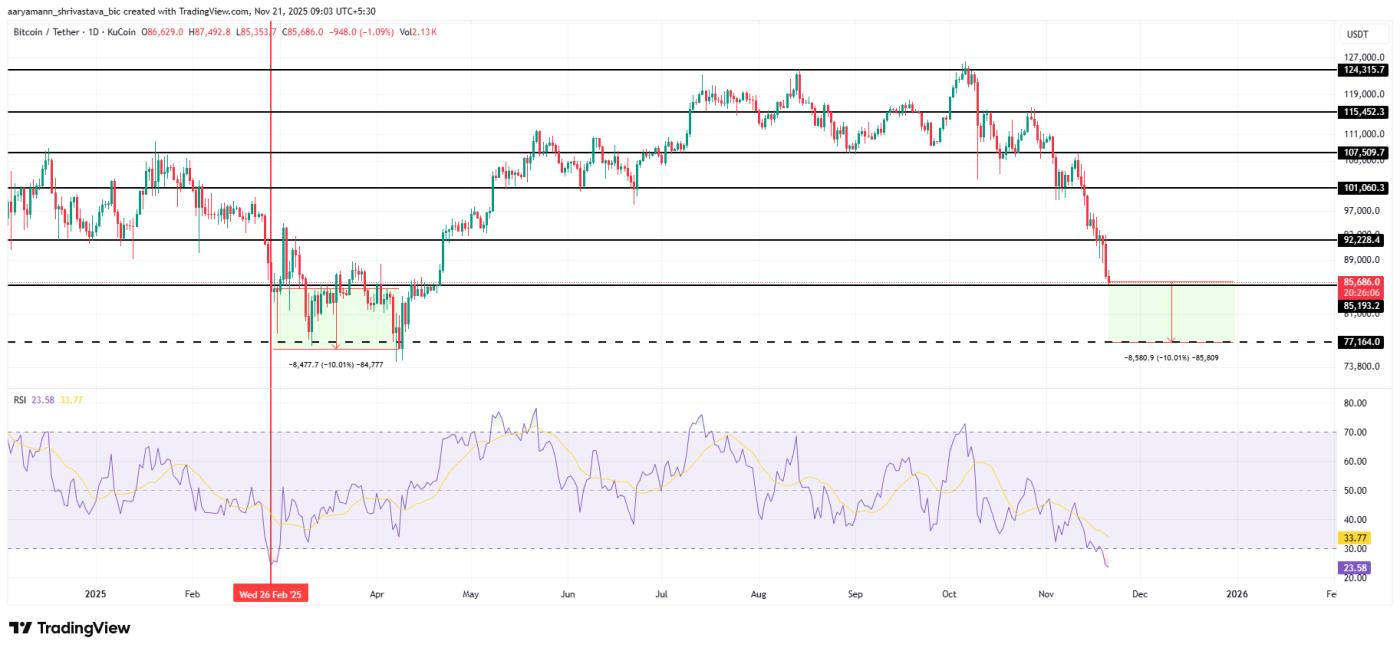 Bitcoin RSI. Source: TradingView
Macro momentum indicators are also pointing to undervaluation. Bitcoin's MVRV is at -14%, marking a three-year low. The 30-day MVRV shows two clear signals: investors are currently losing money, and BTC is undervalued by historical standards. This environment tends to slow selling and increase accumulation.
The area between -8% and -18% is historically known as the “opportunity zone”, where bearish pressure is typically saturated. Selling exhaustion typically leads to gradual consolidation, which in turn supports a recovery.
 Bitcoin MVRV Ratio. Source: Santiment
BTC price drops to $85,000
Bitcoin is trading at $85,860 at the time of writing and is holding above the key support level of $85,204. Based on current indicators, BTC could experience another minor decline before bouncing back, especially if oversold conditions increase.
A further decline could push Bitcoin to $77,164, which is consistent with the RSI's historical pattern. Another possible scenario is a drop to $80,000 if BTC loses support at $85,204 and then $82,503. Both possibilities reflect prolonged selling pressure before stabilizing.
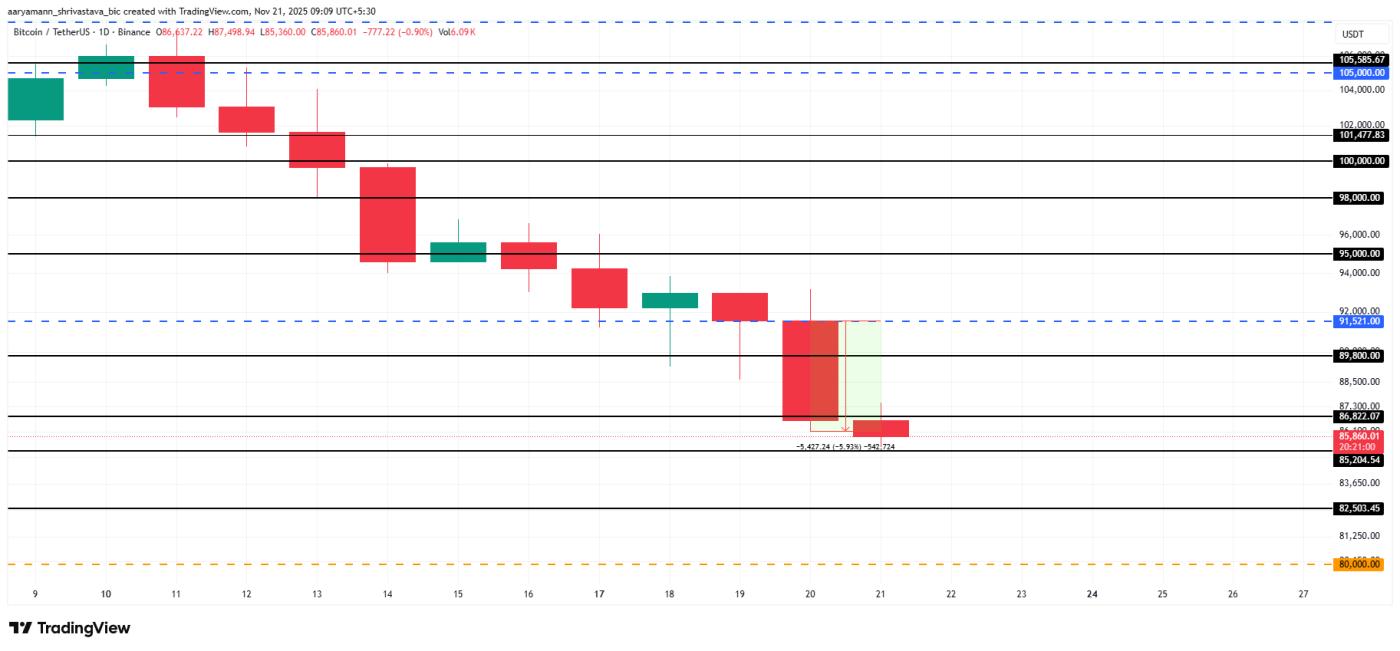 Bitcoin Price Analysis. Source: TradingView
If Bitcoin can bounce from current levels, it could surpass $86,822 and retest $89,800. If successful, BTC could aim to convert $91,521 into support and push towards $95,000. This would invalidate the bearish scenario and signal a stronger recovery.


