

In this piece we look at how the larger trend, intraday flows and volatility interact, and what that might mean for the next decisive move.
Summary
Summary
The broader crypto market has lost about 8% of total capitalization in 24 hours, indicating broad-based de-risking rather than an isolated move. Bitcoin now commands roughly 56% dominance, highlighting a flight to relative safety and putting additional pressure on large altcoins.
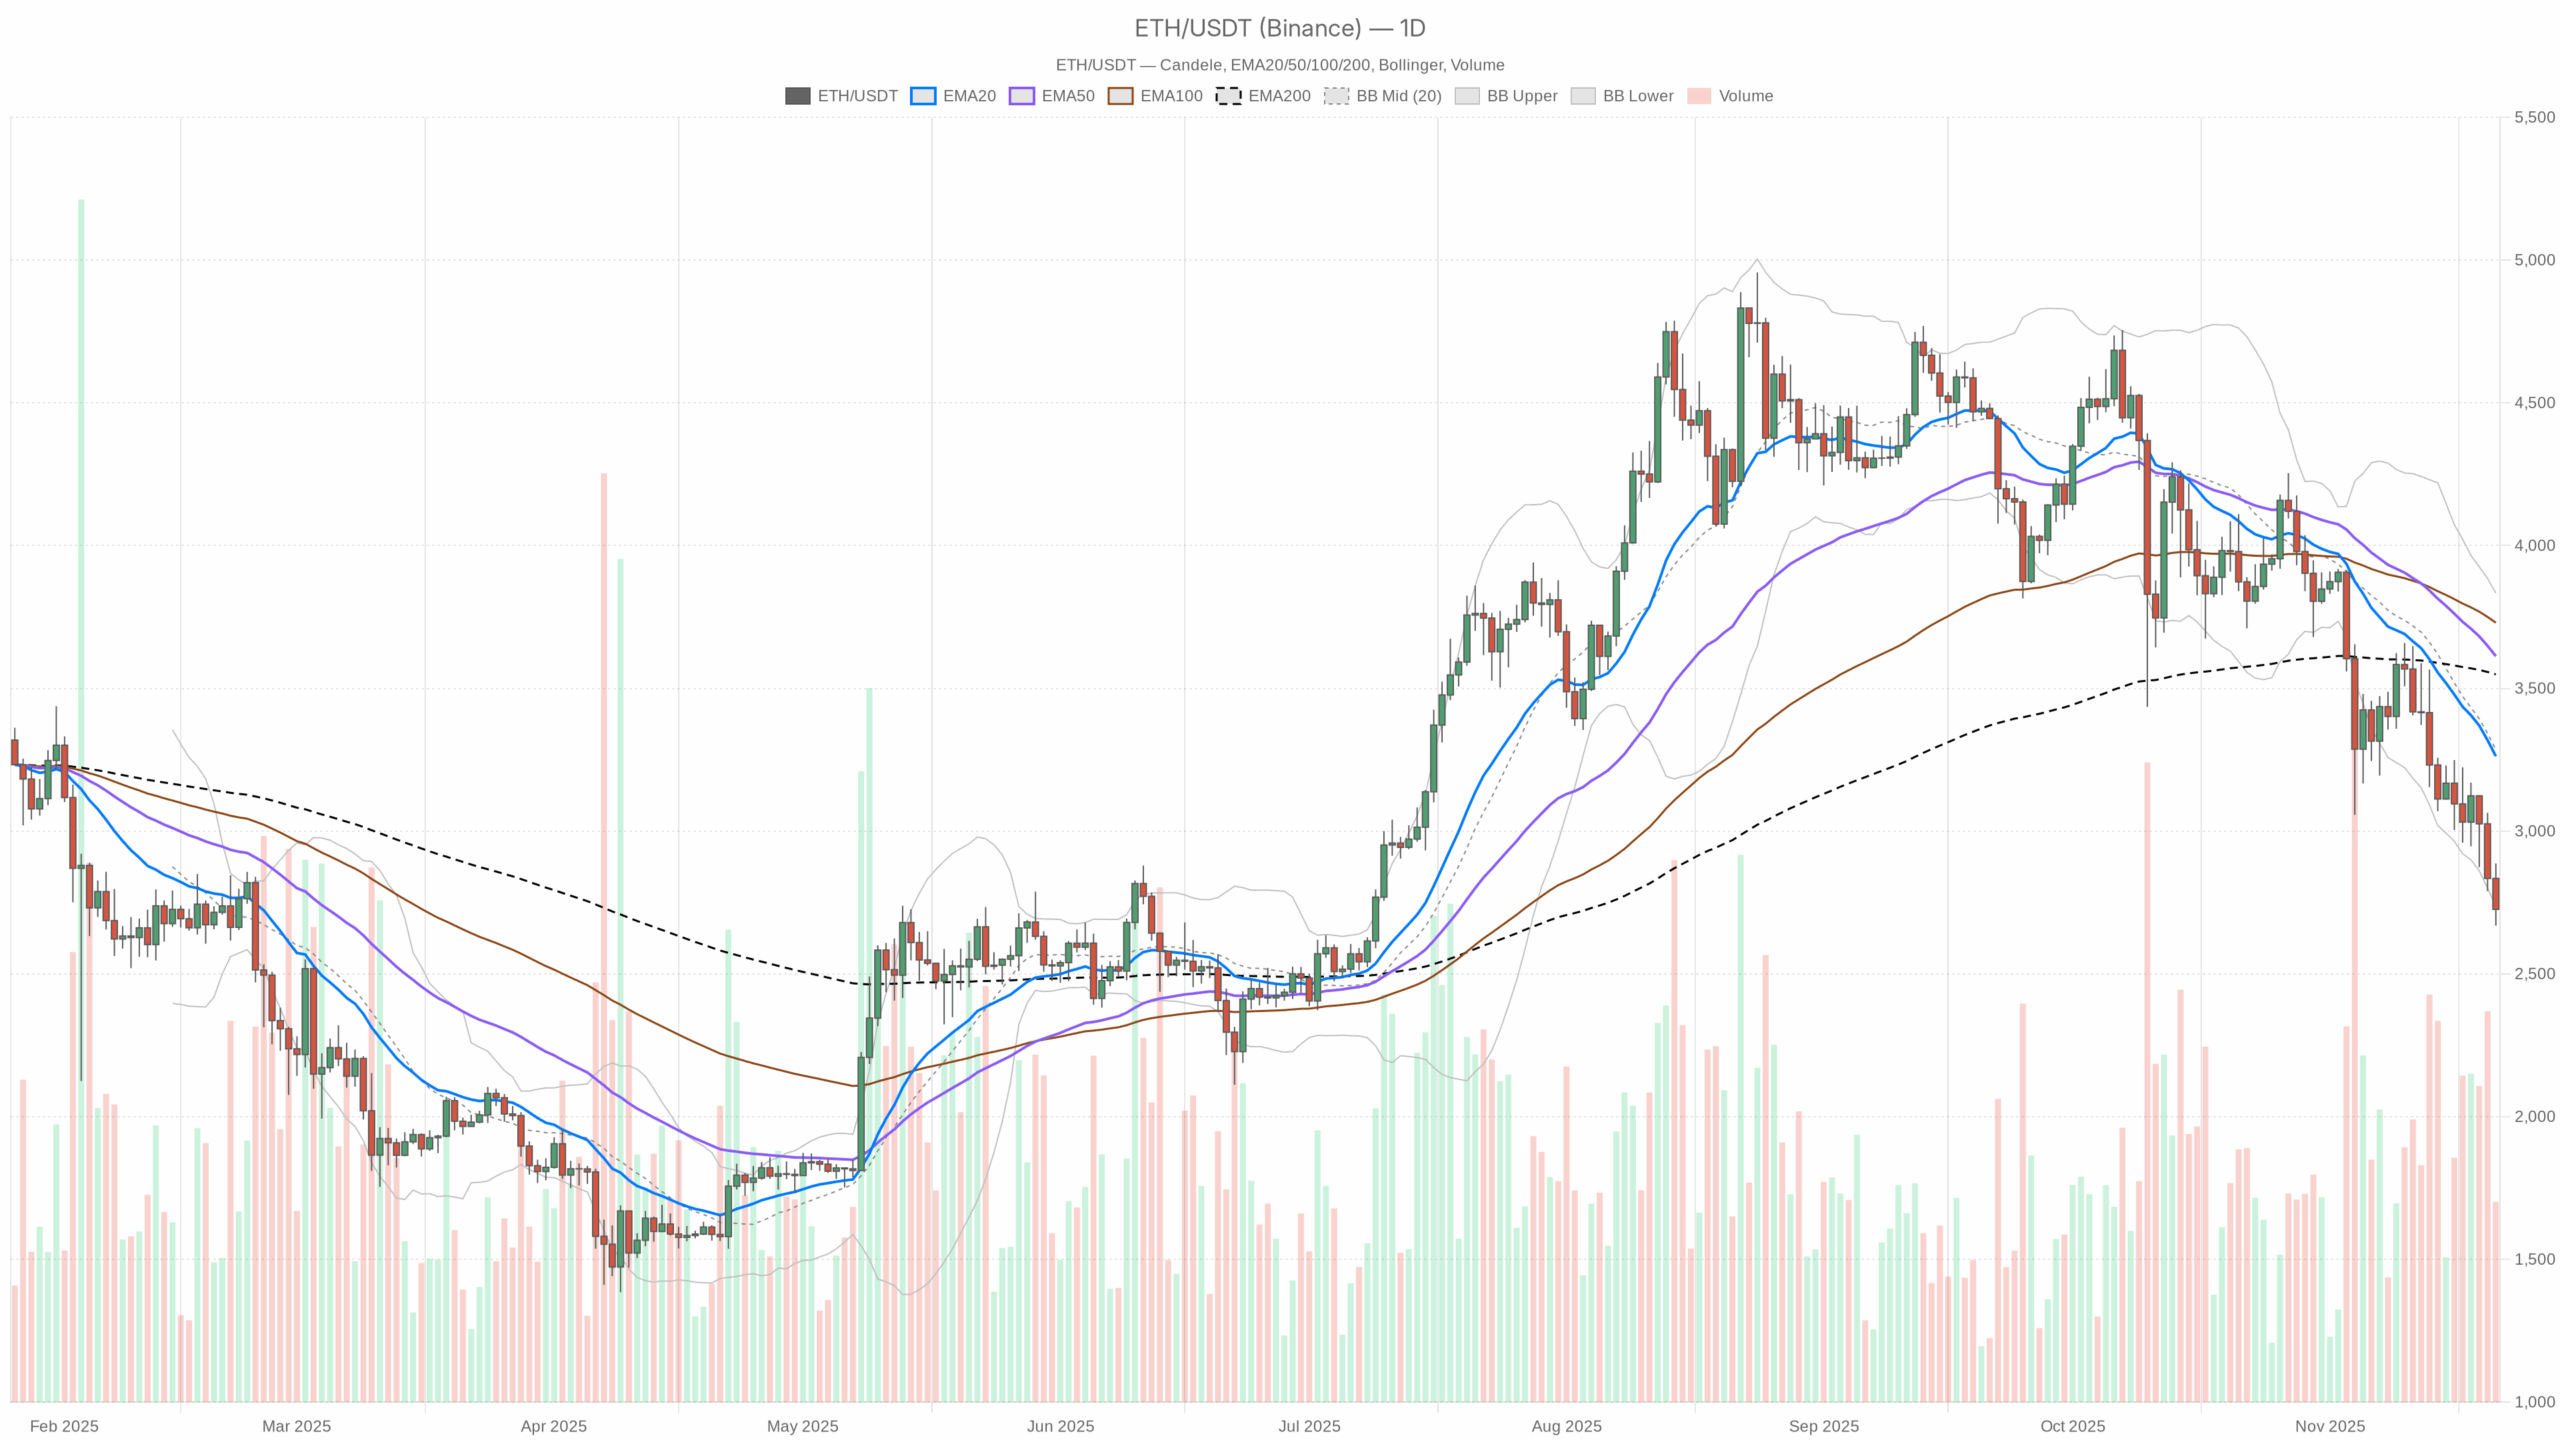
On the daily chart, ETH trades below all major EMAs with an RSI around 27, firmly in oversold territory. Momentum gauges such as MACD remain negative, but their downside acceleration is starting to slow.
Moreover, volatility is elevated, as shown by a wide Average True Range, yet prices are gravitating near the lower Bollinger Band. Overall, the main scenario on the daily timeframe is bearish, but increasingly stretched, with growing potential for a relief rebound.
Ethereum (ETH) USD: Market Context and Direction
The backdrop for this move is a global crypto market cap near 2.95 trillion dollars, with a sharp daily contraction of just over 8%. This kind of aggregate drawdown often reflects systemic risk-off behavior rather than token-specific news. Bitcoin’s market dominance, above 56%, confirms that capital is rotating away from higher beta assets and into the benchmark coin, which tends to happen in late stages of a sell-off or in the early phase of a prolonged downtrend.
Meanwhile, sentiment data reinforces this cautious tone. The Fear & Greed Index stands at 14, in Extreme Fear, indicating that retail and many discretionary participants are heavily risk averse. That said, such low readings often coincide with capitulation-like phases, where forced selling may be near exhaustion even as headlines look grim. For ETH, this means the prevailing direction is still down, yet the risk-reward for fresh shorts becomes less attractive as the market gets more crowded on one side.
Technical Outlook: reading the overall setup
On the daily chart, ETH closes around 2726, well below the 20-day EMA at 3262, the 50-day at 3613, and the 200-day near 3549. This wide separation shows a firmly established downside trend where sellers have dominated for weeks. Moreover, trading under the 200-day average keeps the longer-term structure under pressure, with any rebound likely facing supply on the way up.
The daily RSI at roughly 27 marks clear oversold conditions. In practice, this often signals that downside momentum is stretched and that the probability of at least a short-term bounce is increasing. However, oversold does not automatically mean reversal; it simply suggests that new aggressive selling may deliver diminishing returns for bears.
MACD on the daily timeframe remains negative: the line sits around -254, below its signal near -217, and the histogram is slightly negative. This configuration confirms that bearish momentum is still in control, but the modest histogram value hints that the strongest part of the impulse might already be behind us.
If the histogram starts to rise toward zero, it would indicate an early shift toward stabilization or consolidation rather than an immediate return to a strong uptrend.
Bollinger Bands add another layer: the mid-band is near 3285, with the lower band around 2737, close to the current price. Trading near the lower band after a sharp sell-off typically reflects volatility expansion to the downside, where prices hug the band during strong trends. That said, once candles stop closing decisively below this area, it often evolves into a base-building phase or a reactive bounce toward the middle band.
The ATR on the daily, at about 229, underlines a regime of elevated realized volatility. For traders, this means wider intraday swings, larger slippage risk, and the need for more generous stop placement. It also implies that any upcoming rebound or breakdown could move quickly through nearby levels.
Intraday Perspective and ETHUSDT token Momentum
On the hourly chart, ETH trades around 2725, below the 20, 50 and 200-period EMAs, which cluster between 2832 and 3102. This alignment indicates a short-term downtrend that is coherent with the daily weakness. As a result, intraday rallies into these moving averages are likely to encounter active selling, at least on the first test.
The hourly RSI near 31 reinforces a picture of short-term exhaustion, yet not as extreme as the daily. Meanwhile, the hourly MACD remains negative with a slightly contracting histogram, hinting that downside momentum is losing some force even if it has not flipped to bullish.
On the 15-minute chart, the story is similar: price below all EMAs, RSI around 31, and a bearish MACD, all consistent with a market still under pressure but potentially stabilizing.
Bollinger Bands on intraday timeframes show the price oscillating close to the lower bands, with the midlines well above. This structure fits an environment where short-term bounces are more likely to be corrective than trend-changing. Traders focusing on very short horizons may favor mean reversion from extremes, but they are swimming against the broader current.
Key Levels and Market Reactions for Ethereum
On the daily pivot framework, the central pivot sits around 2761. Price is currently just under this area, suggesting it is acting as a first intraday ceiling. A sustained move back above would signal that buyers are starting to regain minimal control and could open the door to a test of the first resistance near 2852.
On the downside, the initial support highlighted by the pivot structure lies close to 2634. A clean break and consolidation below that zone would confirm continuation of the prevailing bearish scenario and could trigger another leg lower, especially if accompanied by renewed volume and a fresh expansion in ATR.
Conversely, repeated failures by sellers to push decisively below this band would strengthen the case for a short-covering rally toward the mid-Bollinger region.
Ethereum Future Scenarios and ETH Investment Outlook
Overall, Ethereum (ETH) USD currently trades within a clearly bearish but increasingly stretched configuration. The combination of deeply negative EMAs, oversold RSI, and extreme fear in the broader market points to a tug of war between trend followers and contrarian buyers.
In the dominant scenario, the path of least resistance remains down or sideways until price can reclaim and hold above the faster moving averages on the daily chart. However, the oversold readings and heavy sentiment pessimism also increase the probability of a sharp, sentiment-driven relief rally that may catch late sellers off guard.
For longer-term investors, this environment rewards patience and careful scaling rather than all-in decisions. For active traders, risk management is paramount: position sizes should reflect the heightened volatility regime, and plans should consider both the potential for sudden rebounds and the still-active downtrend. Until technicals show convincing trend confirmation of a new upside phase, every bounce is best treated with caution.
This analysis is for informational purposes only and does not constitute financial advice.
Readers should conduct their own research before making investment decisions.


