A market correction is the most likely scenario for most of the coins, according to CoinStats.
BTC/USD
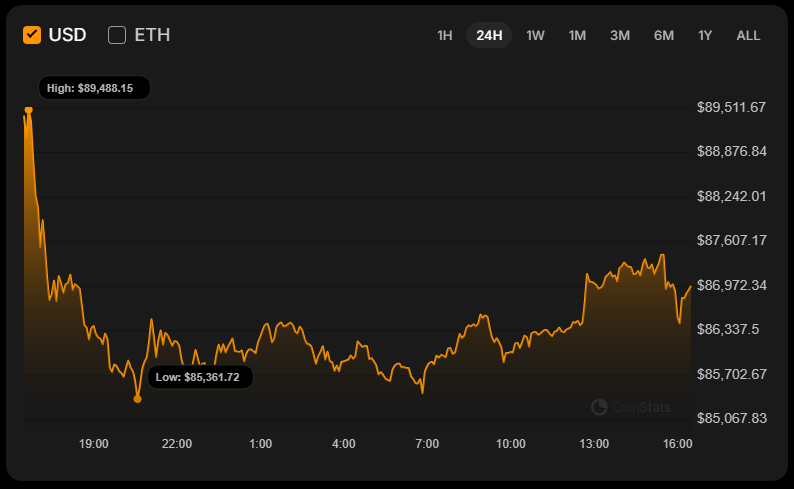
The price of Bitcoin (BTC) has fallen by 2.64% over the last day.
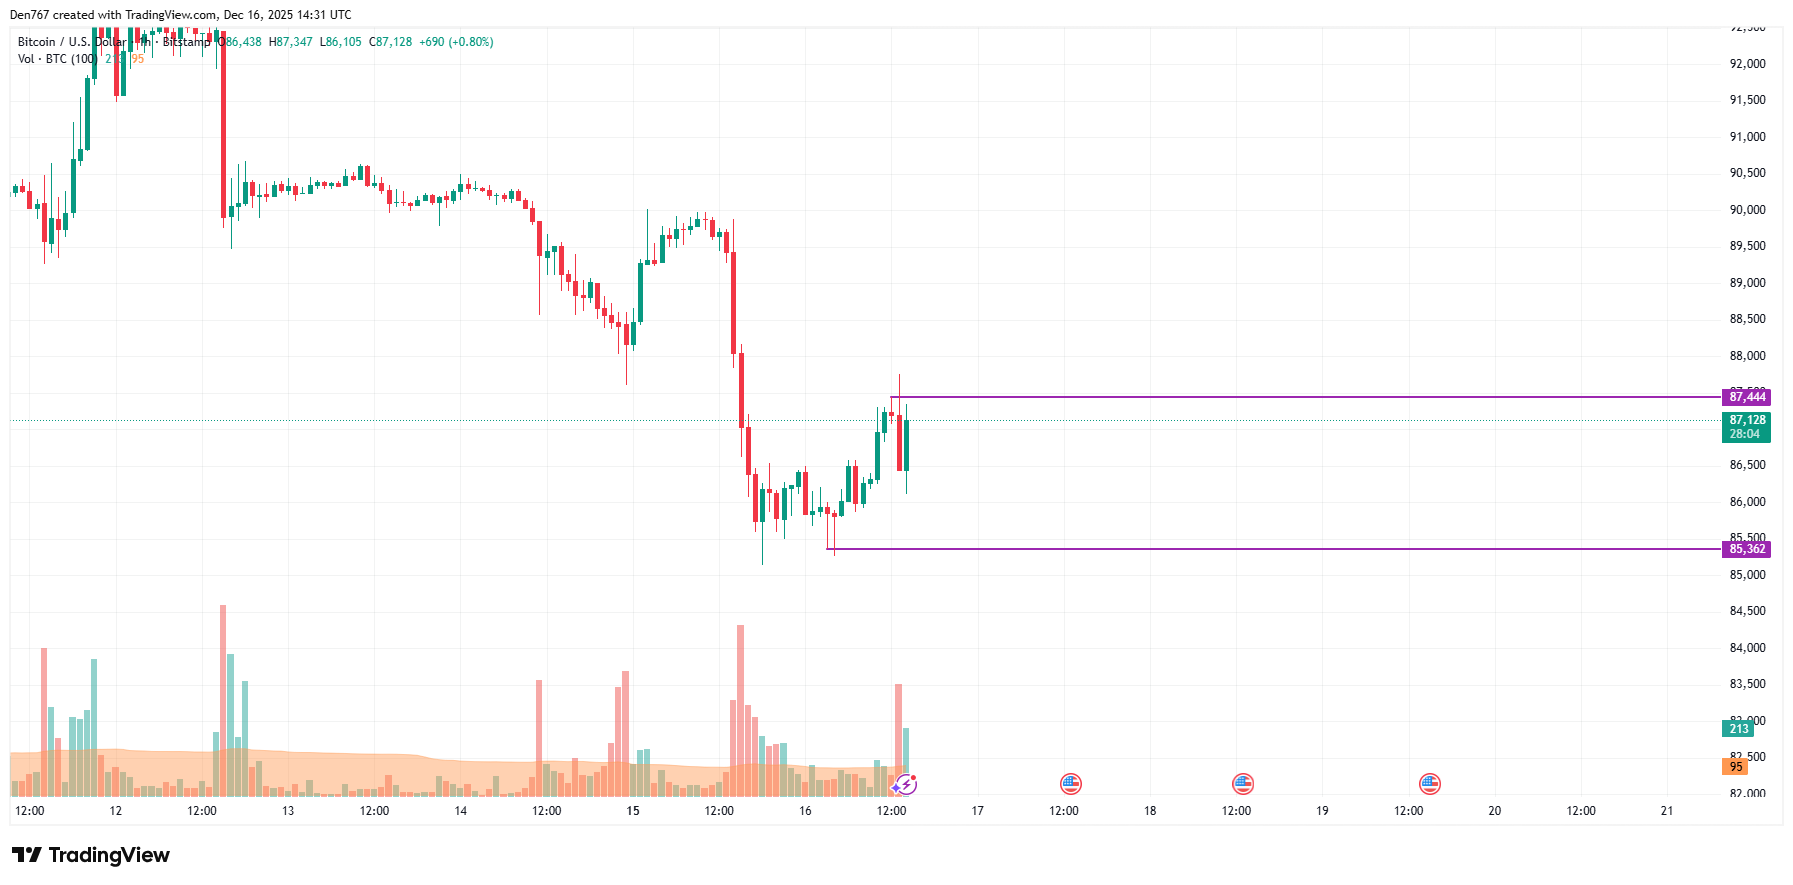
On the hourly chart, the rate of BTC is coming back to the local resistance of $87,444. If its breakout occurs, growth is likely to continue to the $88,000-$88,500 range soon.
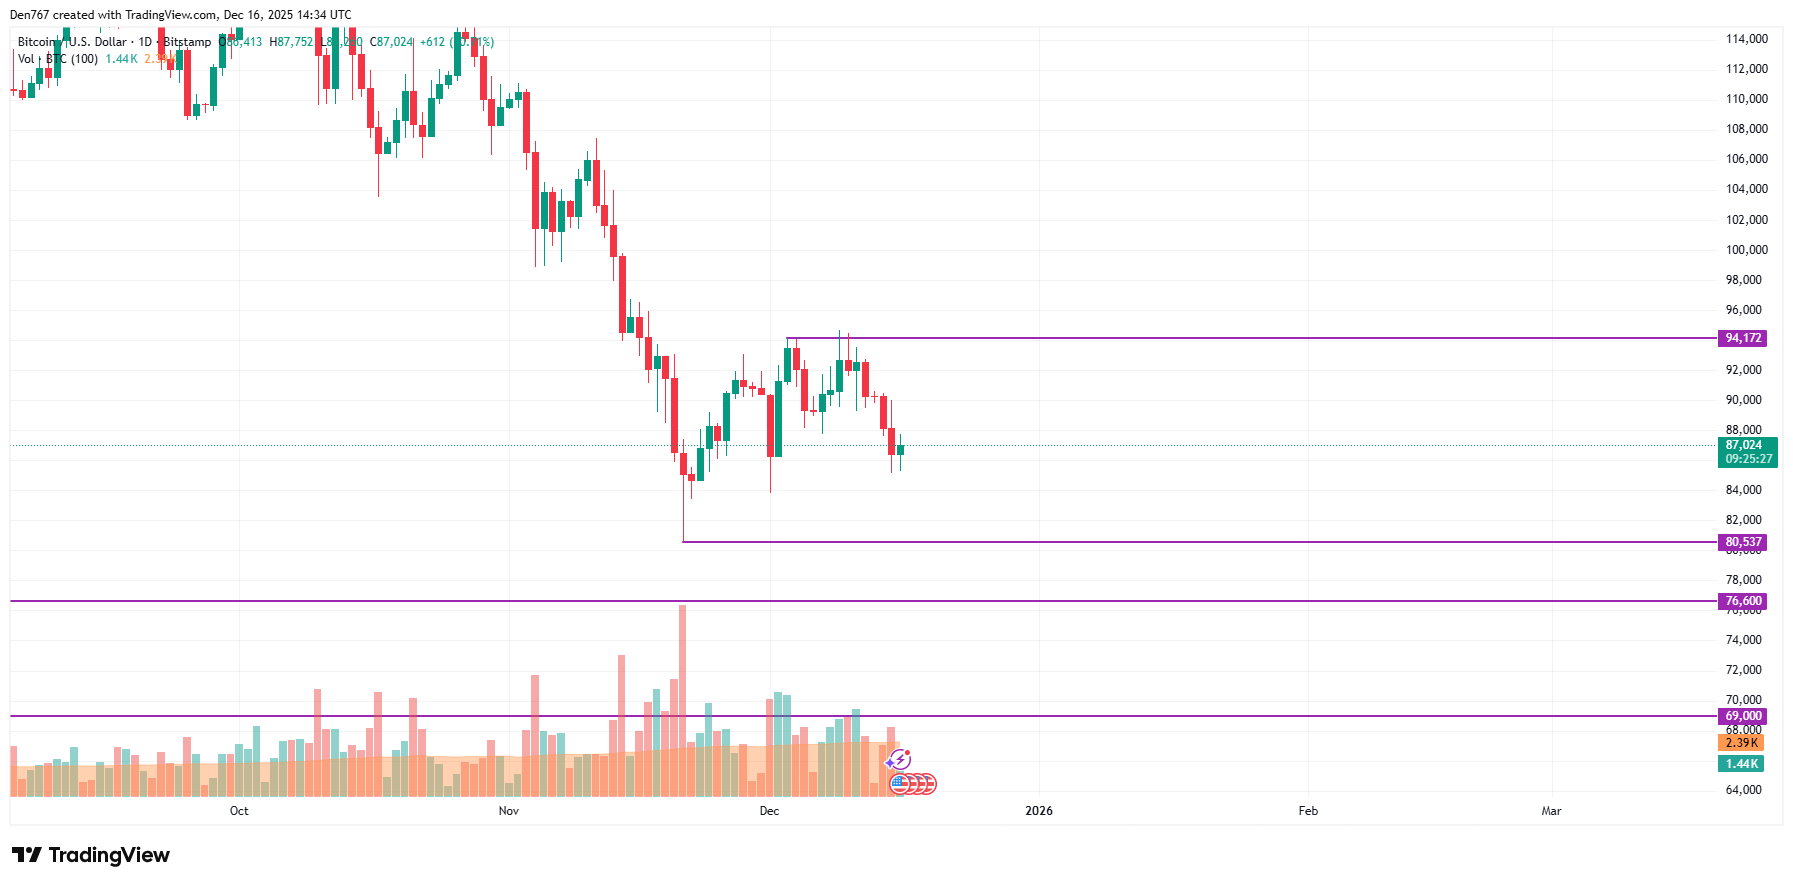
On the longer time frame, the picture is less positive for bulls. The price of the main coin is far from the support and resistance levels, which means traders are unlikely to see sharp moves soon.
All in all, sideways trading in the range of $86,000-$89,000 is the most likely scenario.
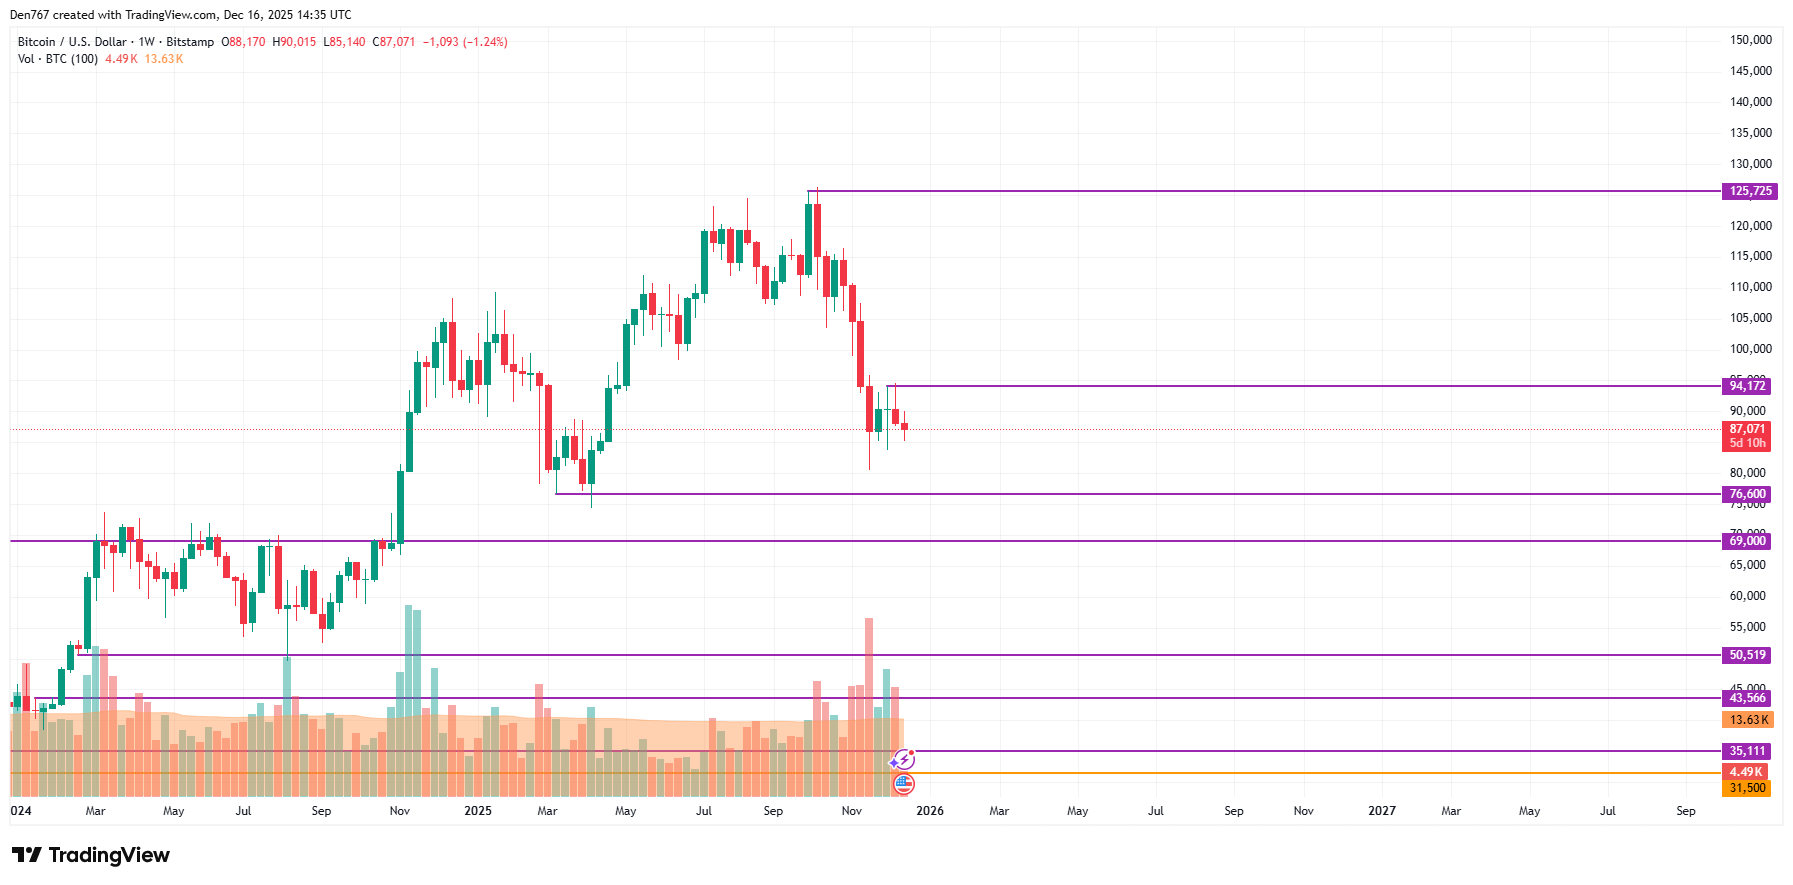
A similar situation can be seen on the weekly chart. The falling volume confirms that neither buyers nor sellers have accumulated enough strength to seize the initiative.
Bitcoin is trading at $87,302 at press time.