Last night's non-farm payroll data was a mixed bag, with one positive and one negative factor offsetting each other. Wall Street is now really focused on the January data, as it relates to whether there will be an interest rate cut in January. After the non-farm payroll data was released last night, the market's prediction of a January rate cut rose somewhat, but the increase was not significant.
Bitcoin has continued its weak correction over the past four hours, and there are currently no signs of a significant bottom or support. We will wait and see how the market reacts after Japan raises interest rates on the 19th.
BTC
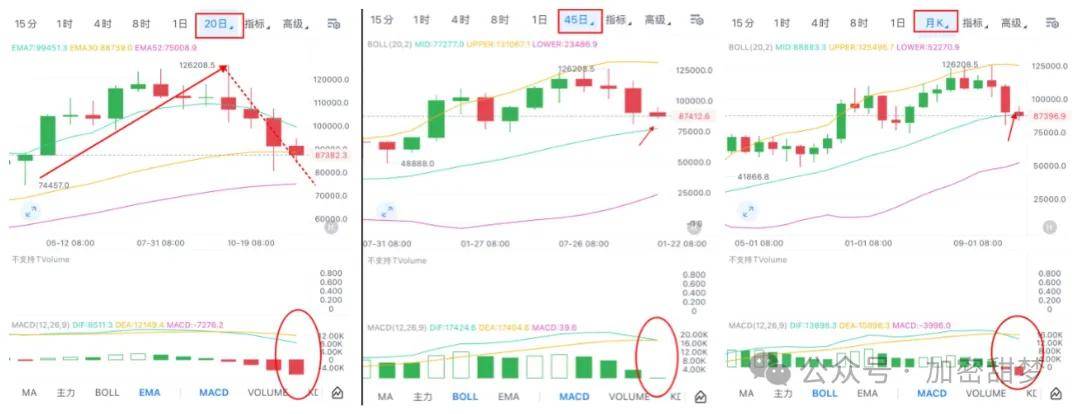
Currently, judging from the daily chart pattern, BTC has broken below the trendline, the MACD is bearish, and there is a possibility of further decline. The daily chart is still in a downtrend, so shorting is short on rallies to resistance levels.
The BTC monthly Bollinger Band middle line at 88800 was broken this week and has now become resistance. Therefore, we should look at the 45-day Bollinger Band middle line, which corresponds to 77250. So, this month, consider starting a position by buy the dips on dips between 78800 and 77250.
The 20-day moving average has formed a rounded top, indicating increasing downward momentum. Its support levels are the lower Bollinger Band at 80250 and the 52 EMA (around 75000). Therefore, if the 7.7-day moving average is broken, the 75000-74600 range would be the key area for buy the dips .
ETH
Currently, we are in a 10-15 day level pullback phase within a monthly adjustment cycle. The 10-day pullback is not yet over, the MACD fast line is about to return to zero, and the decline may accelerate when it touches the zero axis; the EMA7/30/52 have all been broken, and the only short-term support is the lower Bollinger Band at 2228.
After a death cross at the 20-day moving average, the price has seen five consecutive days of decline, with the price slightly below the middle band and far from the lower band. The primary support level is the EMA52 (2752). If this level is broken, the next low is the June low of 2112 (a equidistant retracement would indicate the end of the right-side correction). The monthly middle band has been broken, but the lower band at 1620 is too far away and therefore ineffective. The effective support level is the EMA52 (2508).
The current bottoming range is 2222-2112. The 2752-2680 range offers some support and can be considered a short-term buy the dips opportunity should no major negative news cause an extreme downward move.
SOL

Currently, the price is trading between the lower Bollinger Bands on the 10, 15, and 20-day moving averages and the monthly Bollinger Bands. The lower Bollinger Band is located between 114 and 102, a range that can be used as a reference for buy the dips. Meanwhile, the 7-30 EMAs on the 10, 15, and 20-day moving averages have all been broken, indicating a lack of support.
The price of the monthly EMA52 is 109.5. Therefore, the buy the dips range before the 100 level is broken is between 114 and 102.
Considering that in extreme cases a sharp drop could cause a false break below 100, the target level after such a break would be 96.25-95.65. If the price falls below 95, it would be considered a true break, and the lowest target would be around 86.25-84.85.
PTB
PTB is a coin I wouldn't dare touch. It's like a standalone coin; going long or short makes you vulnerable to being beaten. The cost-effectiveness is extremely low. You might be able to profit if it moves quickly, but if it moves slowly, you'll definitely get beaten. In short, if you're greedy, you'll eventually have to pay it back. It takes off first, and then drops by more than 40% in a single day.

IR
Total supply: 1 billion, initial circulating supply: 20.5%, pool price: 0.1
Positive factors: 1. Strong funding background: Yzi Lab invested, and Bera is a co-founder. 2. Over $8 million in protocol revenue this year, with a remaining TVL of $210 million. 3. Affordable pool price: $0.1 for $100 million. 4. Airdrops are in centralized exchanges (CEXs), and some participants have mentioned the airdrop amount is limited.
Negative factors: 1. Protocol revenue has been declining due to the poor performance of BearChain. They didn't issue a token at their peak, but are now doing so. The peak revenue in March was 2.81 million, but this month it's only a little over 10,000. 2. Tokenomics hasn't released any information, and there's been little discussion about it within the community.
The only chance for the project team is to collect chips when everyone dumps them, then manipulate the community to control the chips and secure contract positions. This way, they can make a profit through the contracts. Otherwise, they basically have no chance to buy in at the opening and wait until the price stabilizes after the dump. With the profit-making effect of the previous projects, market attention has returned to ALPHA, and recent projects have started to reap the rewards. Let's be a little more cautious.
The market is constantly changing, and specific entry and exit points should be determined based on real-time conditions. Follow the trend after a breakout! No matter how high your confidence level, please strictly adhere to your stop-loss and take-profit strategies! That's all for today! Follow me so you don't get lost! ( Add me on QQ: 3958133807 with a note, and I'll add you to my learning and discussion group.)