

HBAR price is under renewed pressure. The Token has fallen approximately 17% in the past seven days and nearly 24% over the past month, continuing its steady downward trend.
This latest price drop is quite significant as a key technical target has been reached. The next development will depend on whether this price level holds.
The price has reached the head and Vai Vai target.
On November 13, 2023, HBAR confirmed a broken Vai-and- Vai pattern on the daily chart. This pattern predicted a potential price drop of approximately 28% from the neckline.
This target was reached on December 15, 2023, when the price touched the $0.113 area. Since then, HBAR has mostly traded sideways around this region. This is noteworthy because the target price from the pattern is now Vai as short-term support.
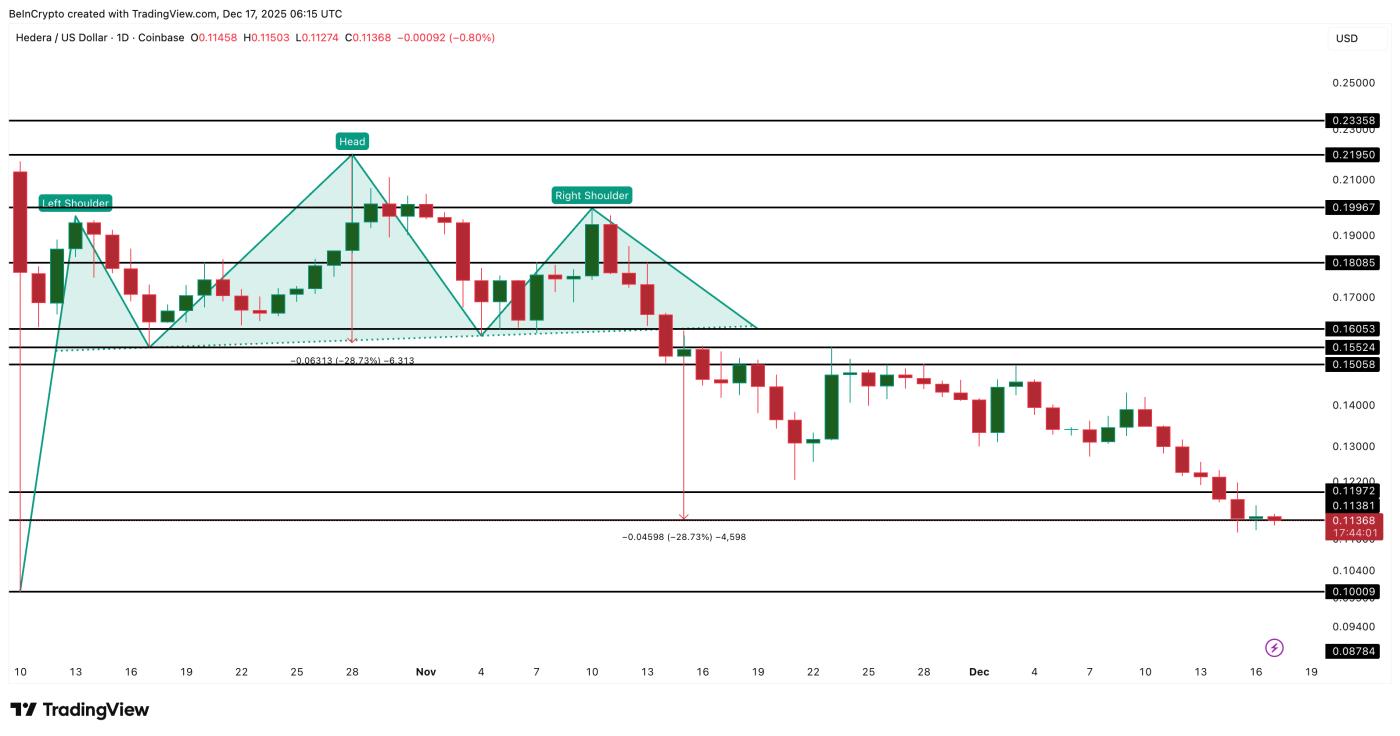 Price target reached: TradingView
Want to read more Token analysis? Sign up for editor Harsh Notariya's daily cryptocurrency newsletter here .
From a technical perspective, this is the first time the sellers have paused to reassess the situation. If the HBAR is broken below this level, the downtrend is likely to intensify. Conversely, if it holds, the market may experience a short-term rebound. The chart has done Vai ; now it's the indicators' turn to decide whether the downtrend has ended.
on-chain data and cash flow still indicate weak demand.
The problem is that current cash flow indicators do not support the possibility of a long-term recovery.
The Chaikin Money Flow (CMF) indicator is currently down to around -0.32, its lowest level in about a year. The CMF indicates that large amounts of money from major investors are withdrawing from the market. When this indicator reaches such a deep negative level, it signifies that Capital is leaving Hedera (HBAR) , even if the price remains Peg around the support zone.
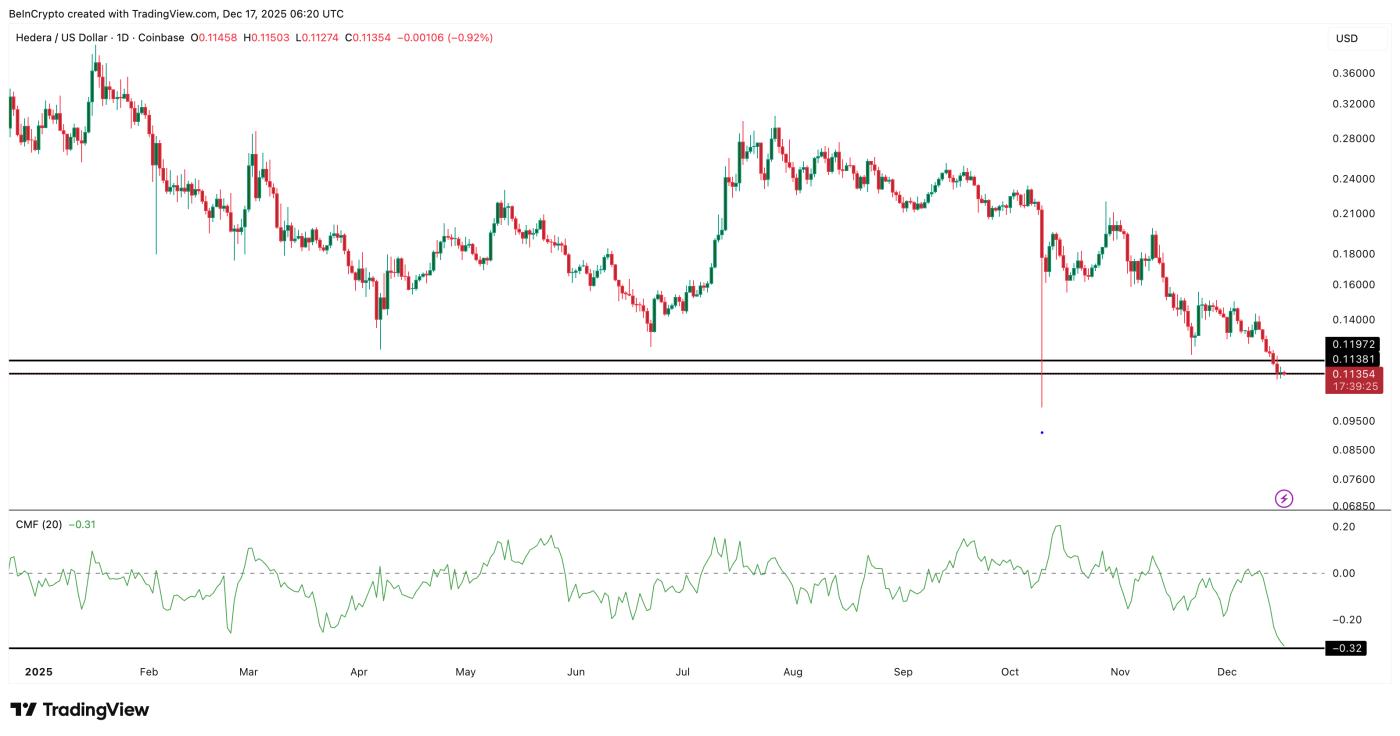 CMF hits lowest level of the year: TradingView
This suggests that the current pause isn't due to strong buying pressure. Large amounts of money, possibly from whales, haven't yet returned to the market.
Spot cash flow data also revealed another weakness. On December 14, 2023, HBAR recorded a net outflow of approximately $3.16 million, meaning Token were moved off the exchange. Normally, this is a positive sign when selling pressure decreases or there is short-term buying interest.
However, this support didn't last long. Over the past 48-72 hours, money flowed back into the exchange, albeit only around $0.30 million. The direction of movement is more important than the value. This indicates that the initial buying pressure has subsided, and coins are starting to be moved back onto the exchange to await further selling.
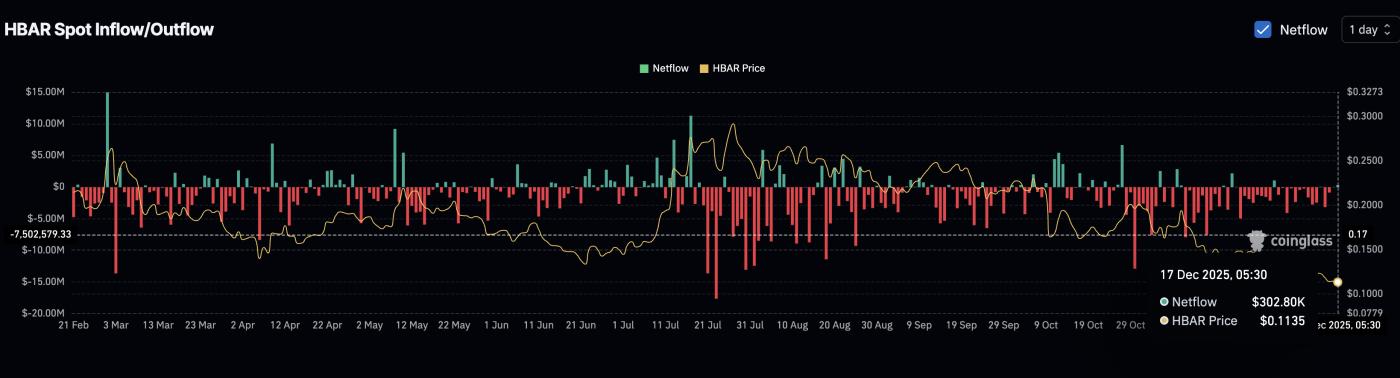 HBAR sellers are back: Coinglass
Simply put, buying pressure has weakened rapidly. Large holder remain absent, and short-term buyers have gradually withdrawn.
HBAR price levels determine whether a recovery or a sharp decline will occur.
With the breakout target reached, the chart has now opened up a new direction, especially in the context of large capital flows and the indifference of retail investors as mentioned earlier.
If HBAR price falls below $0.113, the next support zone is around $0.107. A further break below this level could see the price drop to $0.095 – a potential further decline of approximately 16% from the current price.
Conversely, any current rebound is merely a short-term correction if the price fails to regain the $0.155 mark on the daily chart. This is the old support zone and also the Dip of the previous trading range. If it fails to break through, the price is very likely to reverse and continue falling.
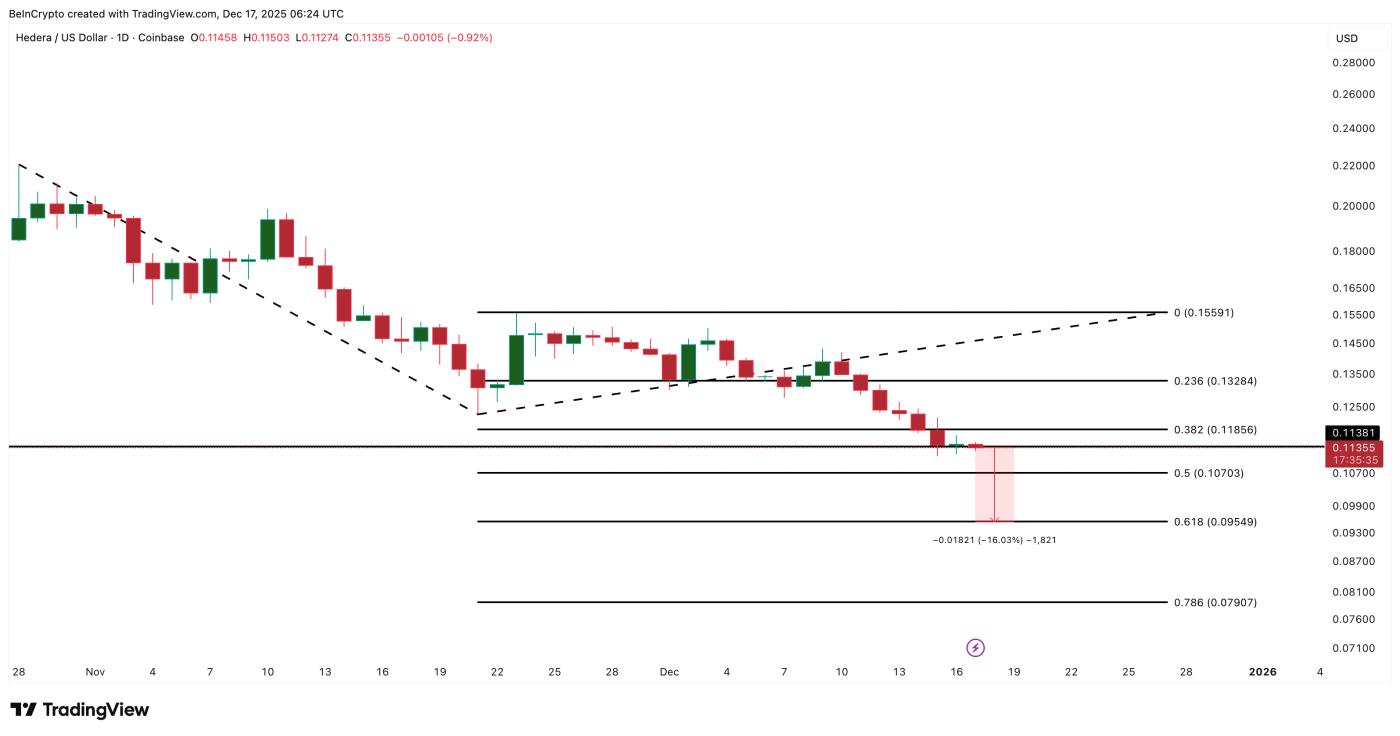 HBAR Price Analysis: TradingView
Currently, HBAR is moving exactly as predicted by the breakout pattern. The question is no longer whether the pattern was effective. Instead, the crucial question is whether this weak buying demand will turn the accumulation zone into the next downward momentum. All current signals point to the risk of further declines in the near future.


