Looking at the current daily chart of US stocks, if we believe the market is about to turn into a downtrend , we must see two key signals to confirm this.
- Breaking through key support: All three major indices must fall below the red line.
- Structural reversal: The trend must show lower highs and lower lows .
The overall trend is still upward, but since it has not yet reached a higher high, it has essentially been in a consolidation phase since October 30.
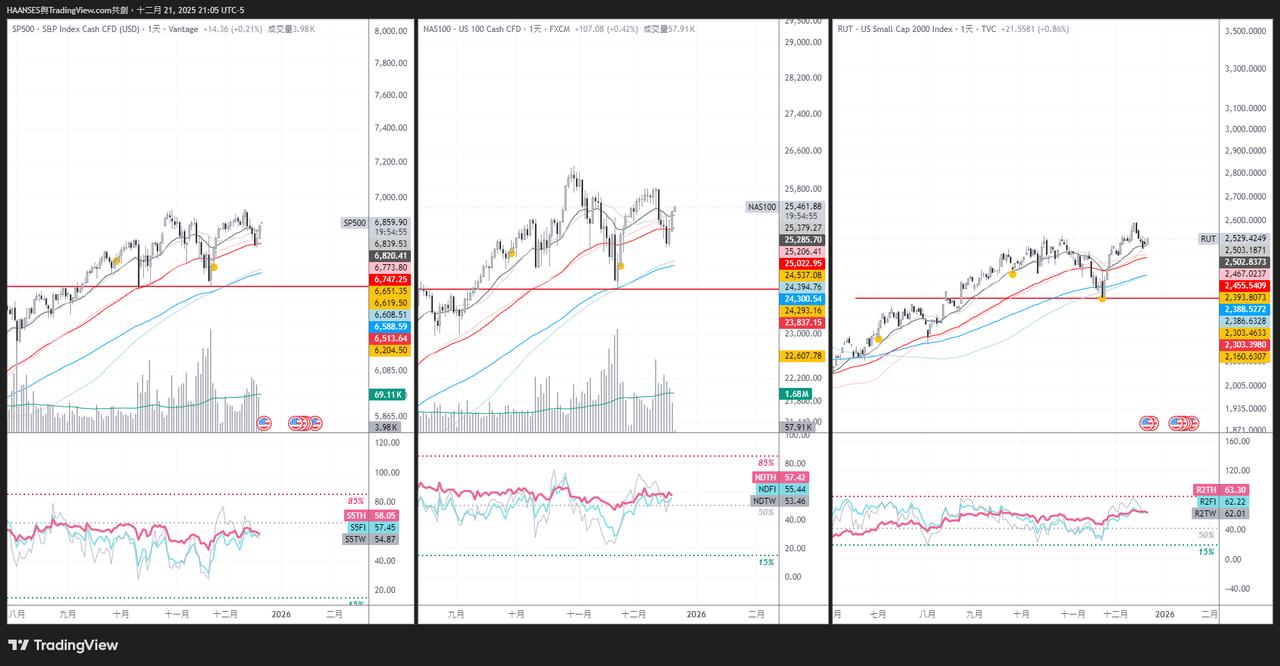
According to MarketPulse data, the index is currently consolidating around 50, indicating a sideways market. Among the major indices, only the Russell 2000 has shown a relatively clear bullish trend.
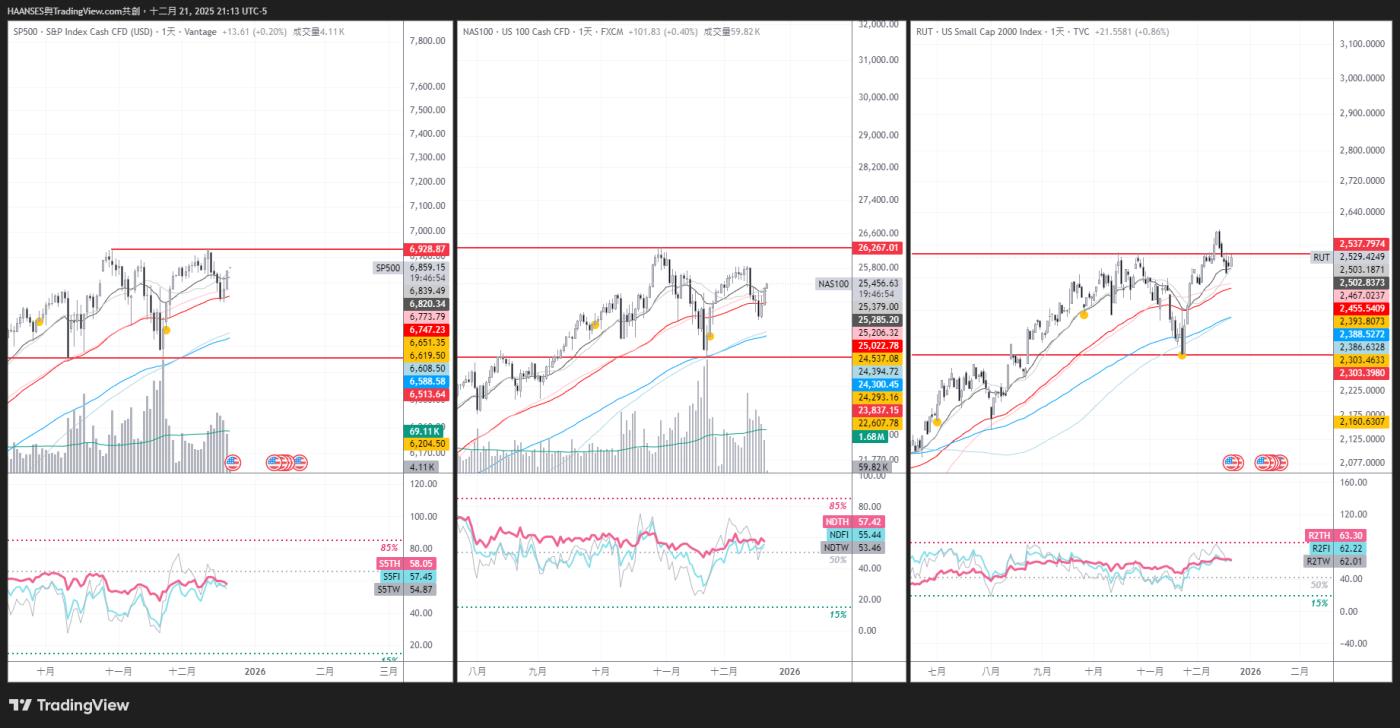
The current concern is whether a false breakout will occur after breaking through the upper red line, leading to a fall back into the range. For example, today's Russell 2000 must hold its current position and continue to rise, breaking through and holding above the red line to confirm the continuation of the bullish trend. 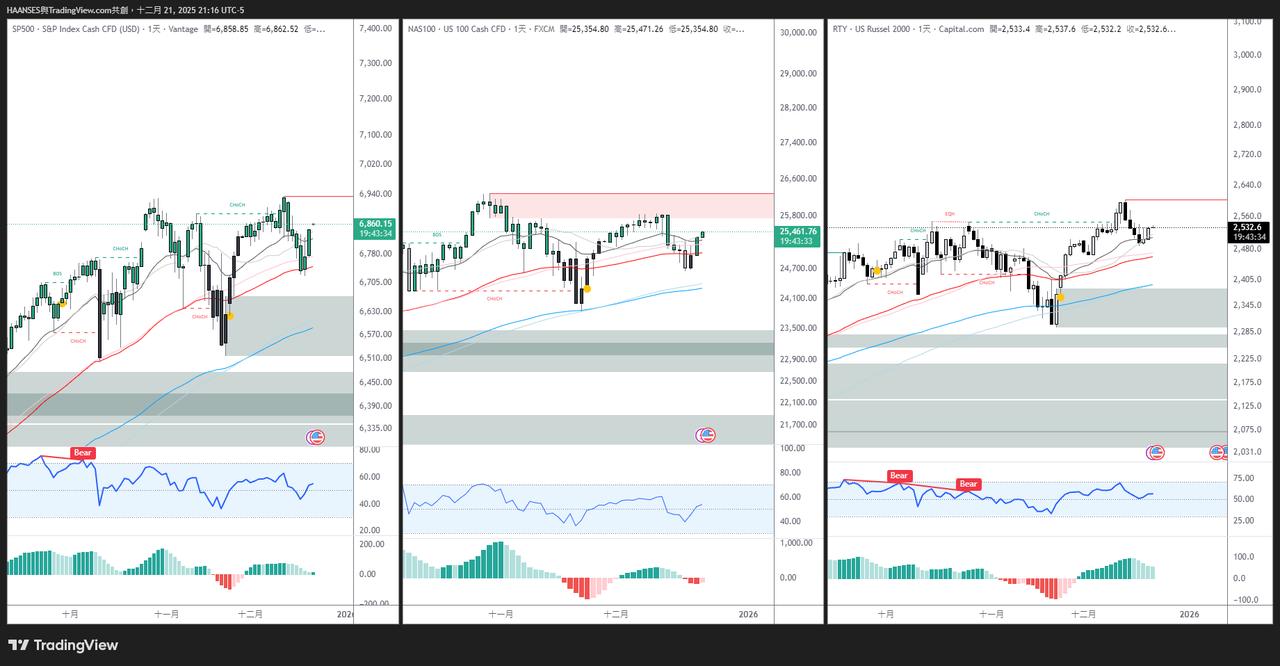
Judging from the AO and RSI indicators, although the bullish momentum has weakened, no increase in bearish momentum has been observed, and the market has entered a consolidation phase .
Currently, due to the lack of a clear trend direction, it is not suitable to open new positions; however, if you already have a long position, you can continue to hold it . Structurally, the market is still maintaining a pattern of higher lows and higher highs , and even though the pace is slow, the overall trend is still upward.