It's okay to be in a bear market. How did I manage to capitalize on bull markets in the past?
Having weathered two bull and bear market cycles, I have a good understanding of this cyclical fluctuation. Here are my key takeaways:
1. Enlarge the time frame
In the past, during bull markets, we observed the changes in candlestick patterns on 1-hour and 4-hour charts; however, now that we've entered a bear market, this means that the candlestick patterns on larger timeframes have broken below the moving averages, and the structure has become bearish. Therefore, we can first open the weekly chart and find the correlation between the moving averages.
2. Why is the weekly chart so important?
In the face of a large cycle, small-scale fluctuations are merely disturbances.
Trend filtering: Weekly charts can help you filter out the "fake moves" of major players washing out weak hands.
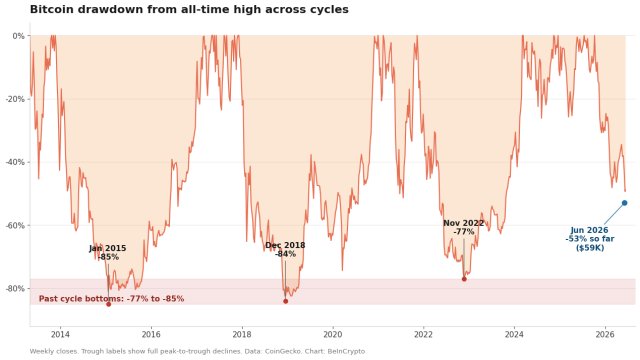
Identifying the bottom range: Historical data shows that when the price touches the 200-week moving average (MA200) on the weekly chart, it is often an excellent point for long-term entry. However, in addition to this, we need a more precise strategy to execute.
 Those who have experienced two bull and bear market cycles will indeed find that cyclical patterns are the most powerful weapon in investing.
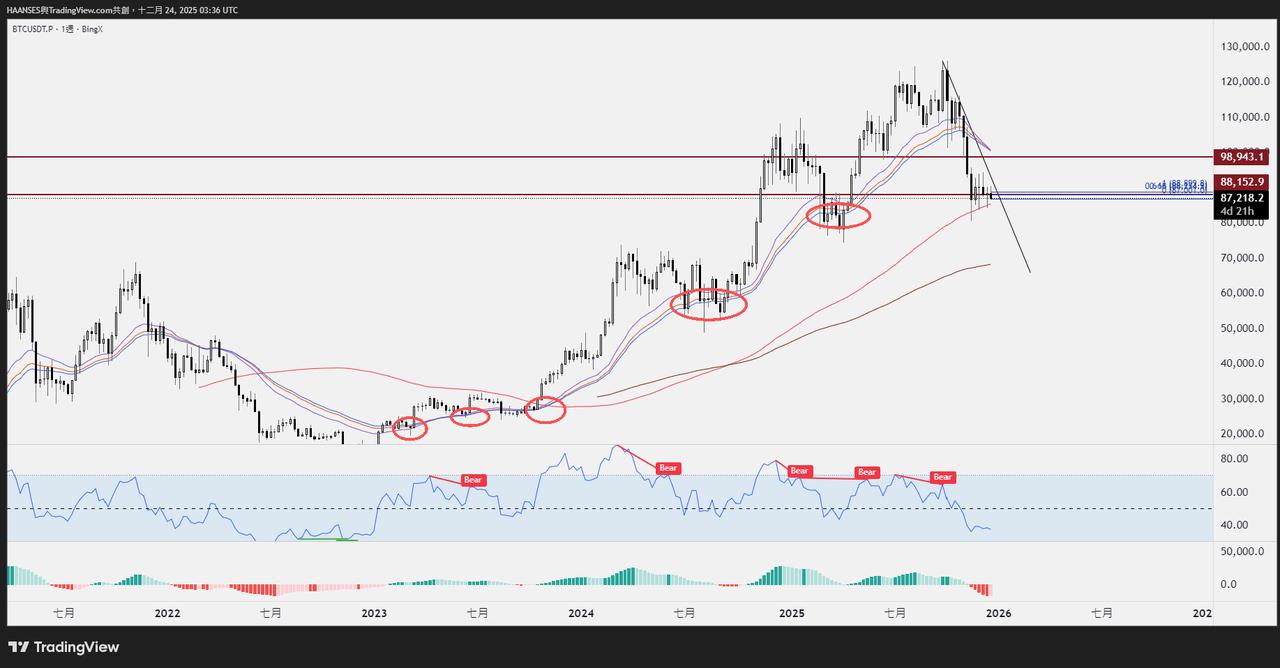
In the past, when a bull market started, prices would usually first rise above the short-term moving averages (MA25, MA32, MA35) on the weekly chart and form effective support before entering a trend of upward movement.
The current situation is that the price has completely fallen below the short-term moving average group on the weekly chart, indicating that the medium-term trend structure has not yet been repaired and does not have the technical conditions to "directly start a bull market".
Under these circumstances, the focus of judgment must be shifted to a lower time frame, using the 3-day moving average to look for traceable structural patterns.
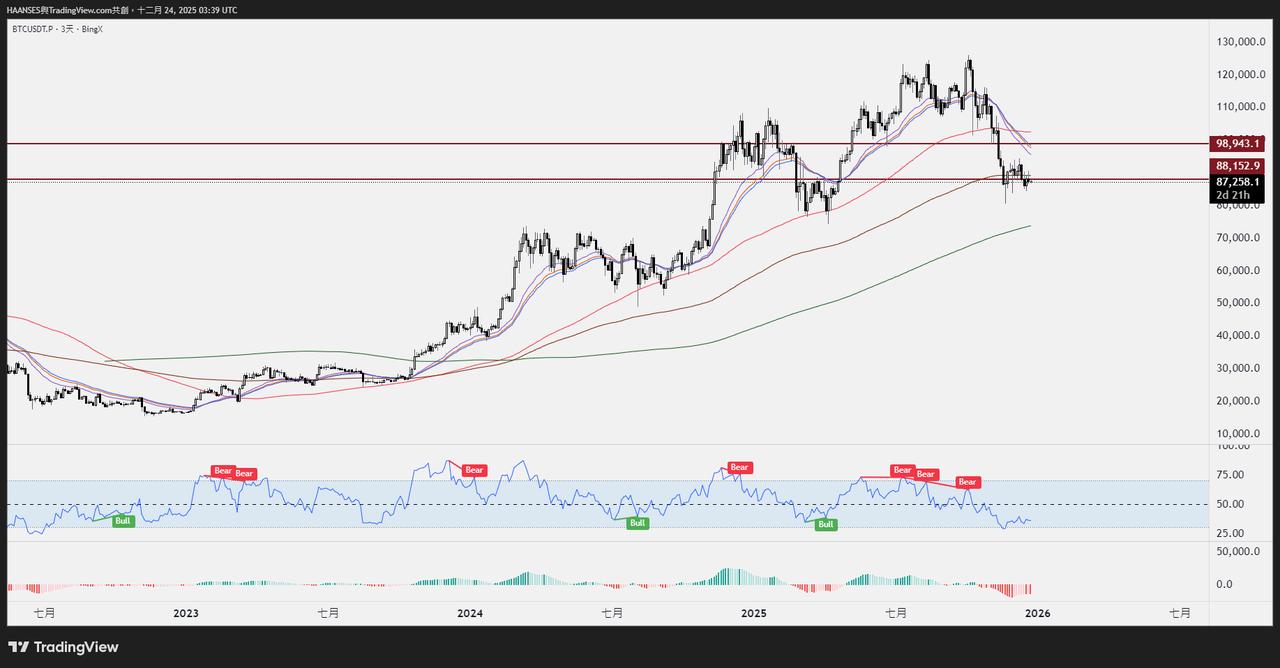
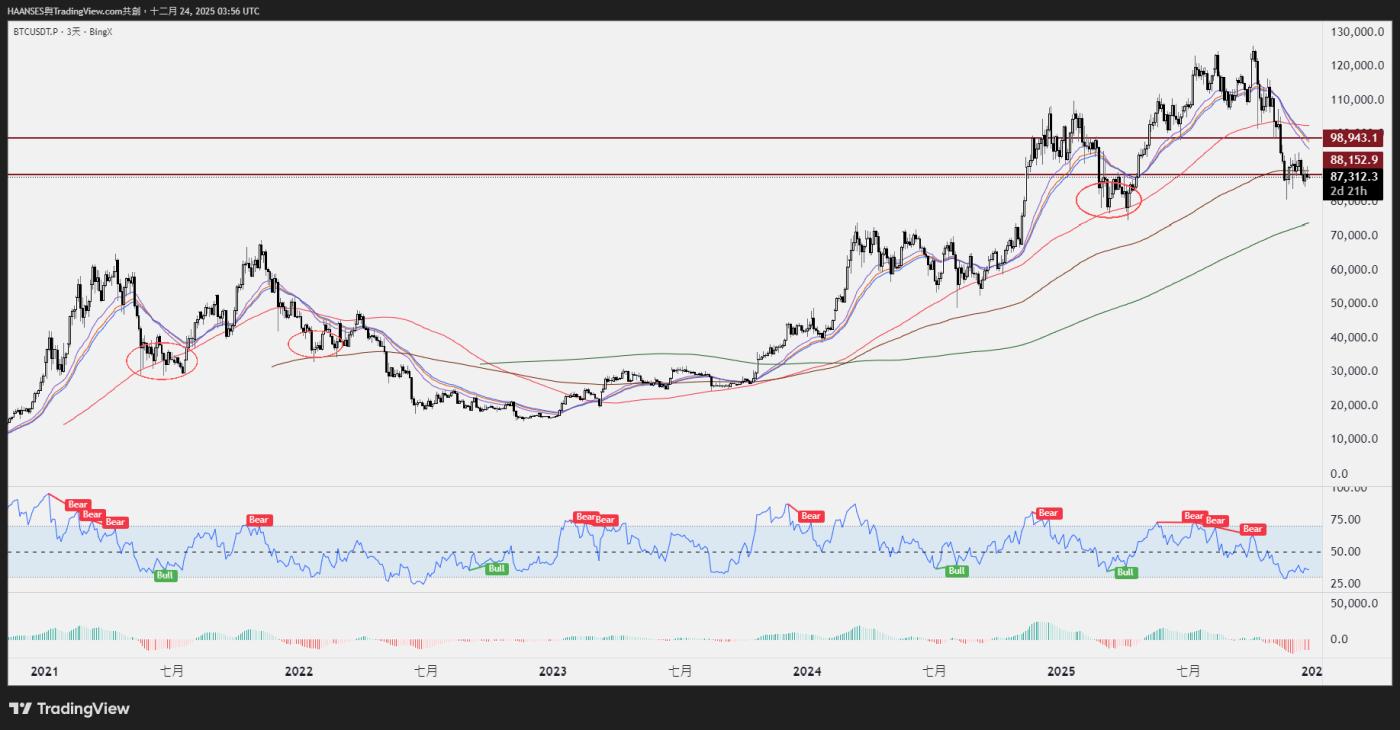
We see that the 3-day timeframe has broken below the red line (SMA100), and the price is currently stuck near the EMA200.
However, it should be noted that, historically, the EMA200 has not shown significant inertial support – in other words, prices have never formed effective support or a structural reversal at this level.
Therefore, from a technical standpoint, this EMA200 does not have sufficient reference value, at least at the current stage:
It is not a key defensive position that the market has repeatedly proven in the past;
It also cannot be used as a basis for judging whether the trend has stopped falling or whether the bulls and bears have reversed;
It should not be regarded as a structural support that can be planned in advance.
For this reason, we will temporarily exclude the 3-day EMA200 from our judgment and projections, and instead continue to focus on:
Whether the price action itself shows signs of bottoming out;
Are there signs of higher lows and the moving averages converging again?
And whether it can subsequently regain its position above the historically significant key moving average.
In short: "Moving averages without momentum have no value for judgment."
Let's look at the daily chart again.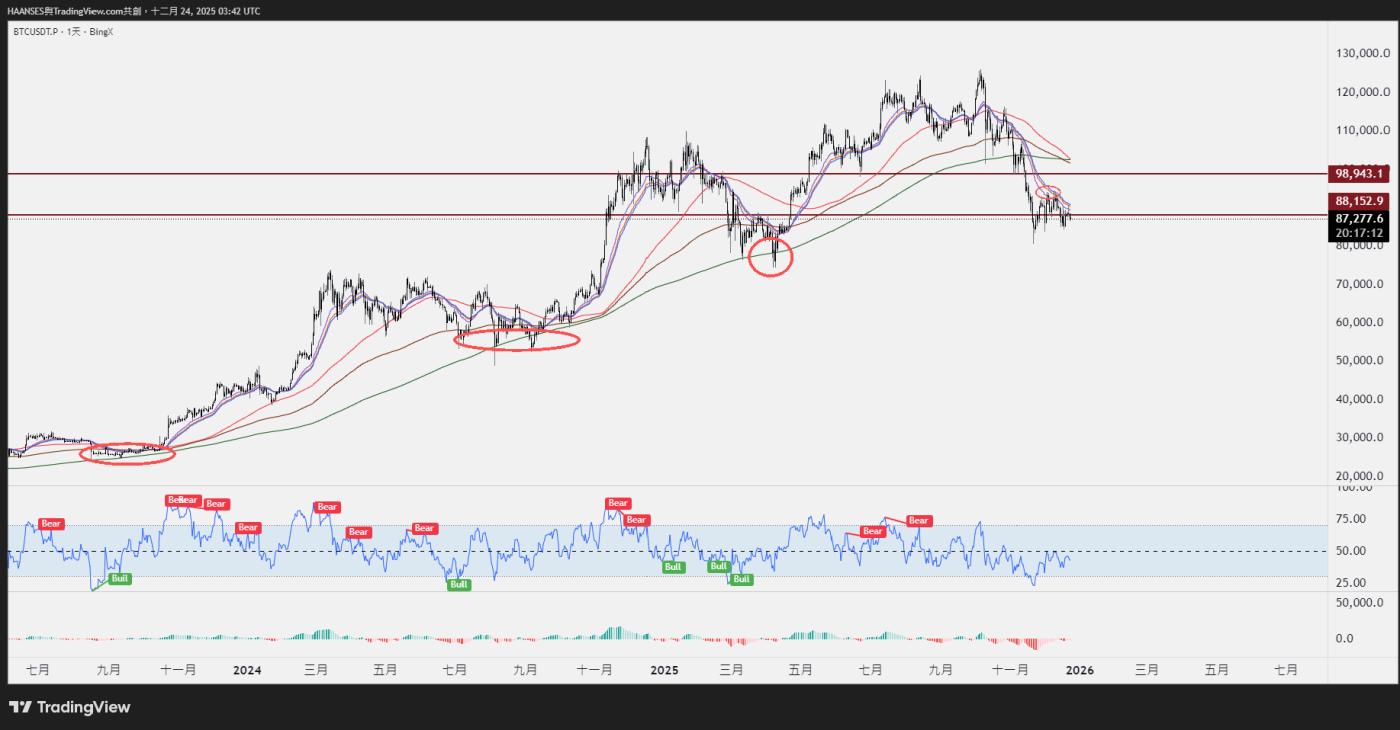
Historically, the 300-day moving average (green line) on the daily chart has been a relatively effective support level, with prices repeatedly finding support at this level and then continuing their trend.
However, judging from the current structure:
The price has clearly broken below the 300-day moving average (MA), rendering the support level ineffective.
Meanwhile, the short-term moving averages on the daily chart (such as MA5, MA10, and MA20) have turned downwards, putting downward pressure on prices.
This indicates that the daily chart structure is still dominated by the bears and no trend correction has been completed.
We can deduce this from the following:
Our current location, based on previous historical positions, is roughly around this point.
 But we can't determine which specific location it is right now, so let's compare RSI and AO.
 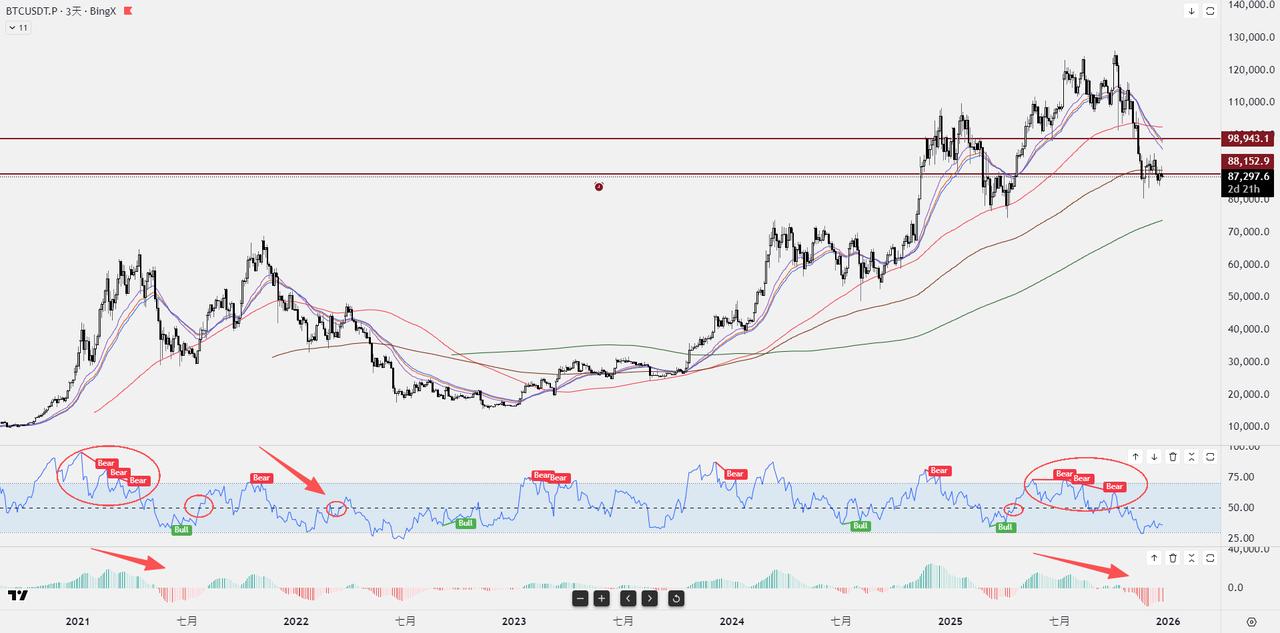 We can see from the three-day moving average that as long as the RSI rises back above 50, the AO will turn from negative to positive, and then the RSI and AO will diverge.
 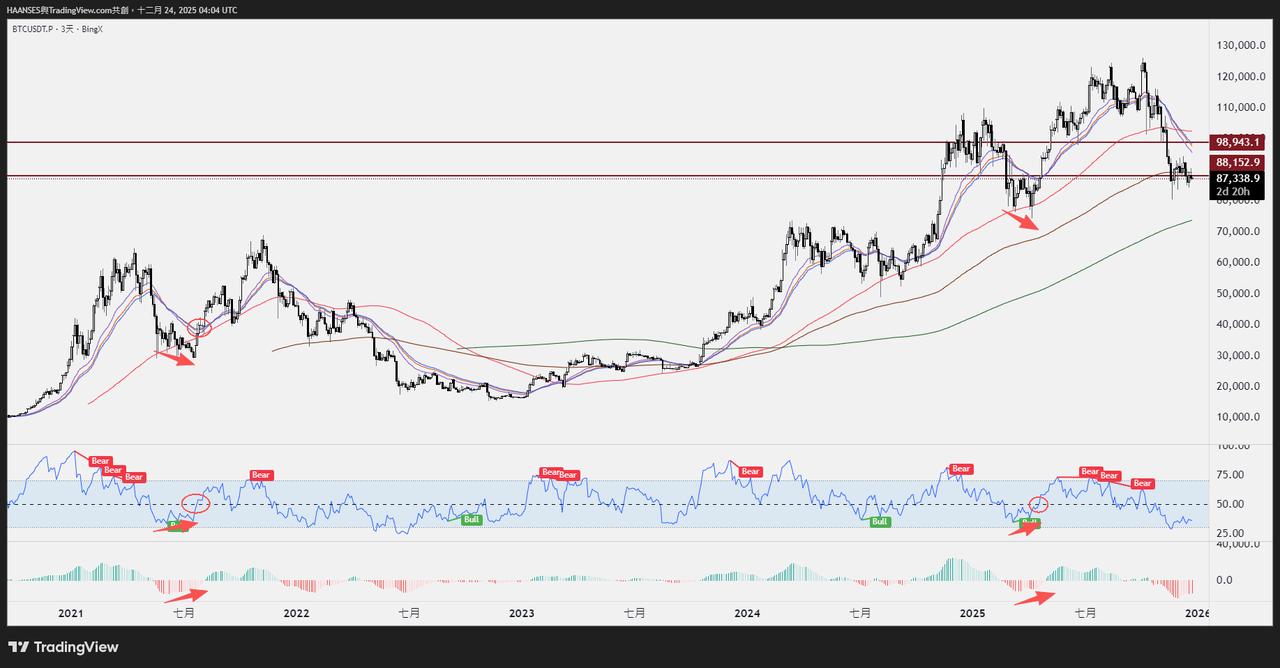 Based on all the information above, we can formulate the following assumptions and strategic logic :
I. Core Assumptions
Short-term moving averages on the daily chart serve as trend filters.
A trend reversal is not assumed until the price regains its position above the daily short-term moving average.
This moving average is only used to determine "whether the conditions for starting a bullish trend are met".
Wait patiently for the daily chart structure to change.
This includes short-term moving averages flattening out, becoming entangled, or even starting to turn upwards.
Prior to this, all rebounds were considered merely structural corrections, not trend reversals.
3-day RSI as an entry trigger signal
The appearance of a bullish divergence at the bottom indicates that momentum is improving before prices.
The RSI has pulled up and broken through the 50 midline , confirming the establishment of bullish momentum.
II. Strategy Logic (Multi-Condition Resonance)
Based on the above assumptions, the entry strategy can be clearly defined as follows:
The price first rose back above the short-term moving average on the daily chart.
→ Filtering downtrends using structural surfaces.The 3-day RSI shows a bullish divergence, and the RSI breaks through the 50 midline.
→ The momentum is confirmed, rather than it is simply a rebound.Use the previous low as the stop-loss level (3-day moving average).
→ Due to the longer time frame, the stop-loss distance is naturally longer;
→ Once the structure is damaged, you must cut your losses and exit the market unconditionally.III. Nature of the Transaction and Risk Perception
This will be a medium- to long-term long position .
The stop-loss is far away, but it corresponds to potential gains at the trend level ;
Only enter the market through "multi-condition resonance".
👉Win rate and stability will be significantly improved .
However, it should be made clear that this is not a guaranteed correct trade, but rather a trade with an extremely high risk-reward ratio.
As long as stop-loss discipline is strictly followed
Once the true trend is captured...
The profit from a single transaction could be substantial enough to cover the costs of multiple trials and errors!