

Written by: Dami-Defi
Compiled by: AididaoJP, Foresight News
Original Title: Essential On-Chain Indicators for Traders: A Practical Guide
On-chain metrics are a hot topic, but few truly understand them. This guide will explain their true meaning and how traders should use them in a simple and clear way.
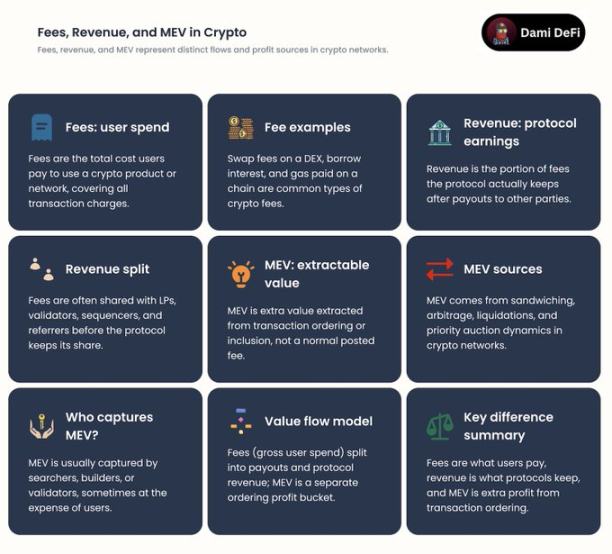
Fees vs. Revenue vs. MEV: The Real Yield of the Chain
First, let's clarify a few concepts:
Transaction fee: The fee paid by the user for conducting the transaction.
Revenue: The portion ultimately left behind by the agreement or validator.
MEV (Maximum Extractable Value): The additional profit a validator gains by optimizing transaction ranking.
Key takeaway: High fees do not equal success. The real key is sustainable revenue; if users churn because of a $50 fee, this model is unsustainable.
Trader's perspective:
Focus on public chains with growing real revenue and sound token models. Models overly reliant on MEVs are fragile; a boom can quickly fade once transaction volume declines or competition intensifies.
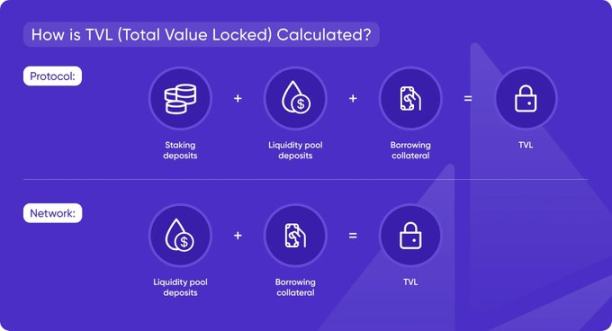
TVL: Three "Lies" About Total Locked Value
Total locked value represents the total capital locked on a protocol or chain. It reflects the level of trust in the market, but it can also be easily misleading.
Three "lies" about TVL:
Double counting: The same funds were pledged multiple times in different agreements, artificially increasing the total amount.
Incentive-driven TVL: "Mercenary capital" comes for short-term incentives and quickly withdraws once the rewards end.
Idle stablecoins: A large amount of funds are stored in wallets and, although counted in TVL, have never been used.
Trader's perspective:
Don't just look at TVL; you must analyze it in conjunction with trading volume and incentive programs. Real usage is far more important than vanity numbers.
DAA/Daily Active Addresses: Real Users or Market Noise?
Daily active addresses count the number of addresses that have performed operations on the blockchain. It is often used as a reference indicator for real users, but it is also easily manipulated.
Frequently Asked Questions:
Batch operations by robots.
Farmers are airdropped to create a massive number of addresses.
Data manipulation through internal transfers within the agreement.
Key point: DAA only makes sense when it grows in tandem with transaction fees, trading volume, and real activity. If the number of addresses surges while revenue stagnates, it is likely an artificially manipulated metric.
Trader's perspective:
The DAA (Daily Adaptive Action) should be considered a secondary confirmation signal, not the primary basis for buying. It only serves as confirmation when other fundamentals support growth.

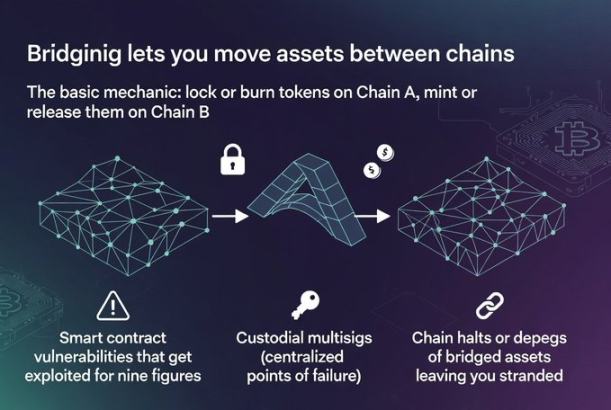
Cross-chain bridges: How funds flow across blockchains and the associated risks.
Cross-chain bridges enable the transfer of assets between different blockchains. The basic principle is: lock or destroy tokens on chain A, and mint or release an equal amount of tokens on chain B. The concept is simple, but the risks are complex.
Key risks:
Smart contract vulnerabilities: could lead to huge financial losses.
Managed multi-signature: has a centralized point of failure.
Chain disruption or asset decoupling: This could result in assets becoming trapped.
Trader's perspective:
Avoid storing large amounts of funds on high-risk cross-chain bridges for extended periods. However, you can monitor the transaction volume of cross-chain bridges as an indicator of fund flows. For example, funds flowing from Ethereum to a certain L2 blockchain, or migrating between different ecosystems, signify changes in liquidity and may present trading opportunities.
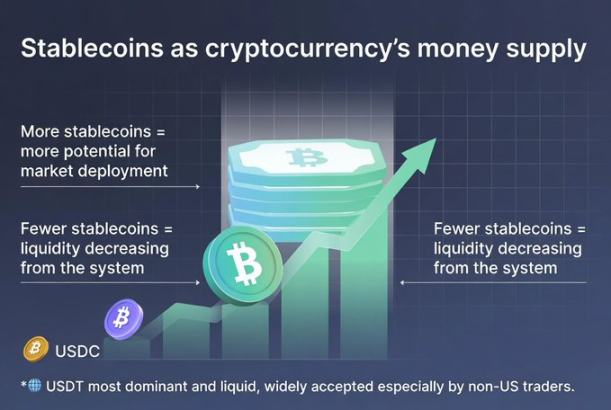
Stablecoins: The money supply in the crypto world
The supply of stablecoins is equivalent to the broad money supply (M2) in the crypto world.
Increased supply means there is more "ammunition" waiting to enter the market.
Decreasing supply indicates that liquidity is being withdrawn.
Current market situation:
USDT dominates due to its high liquidity and widespread acceptance (especially among non-US traders). USDC is more transparent and compliant, but its usage is slightly narrower.
Trader's perspective:
An increase in the total supply of stablecoins typically supports a larger market trend; a decrease in supply, on the other hand, indicates tighter liquidity and may suppress price increases. This is an important reference indicator for macroeconomic planning.
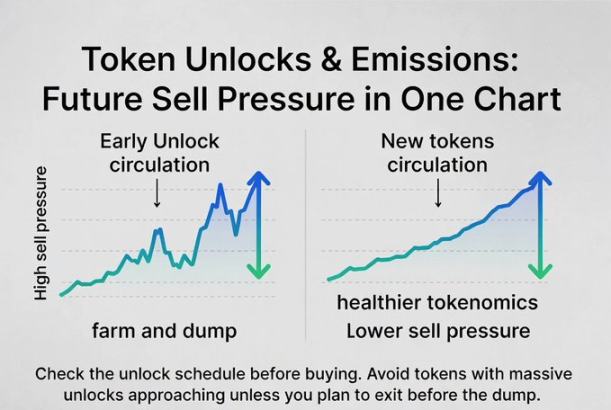
Token unlocking and evacuation: Future selling pressure
Unlocking and releasing tokens means that new tokens enter the circulating market. Large-scale unlocking is often accompanied by automatic sell-offs: team cashing out, VC selling off, and reward releases causing a surge in supply.
Simple judgment:
Early unlocking of high-level points often foreshadows a "dig, extract, and sell" pattern.
Long-term stability and lock-up reduction + real demand: usually indicate a healthier token economy.
Trader's perspective:
Always check the unlocking schedule before buying. Avoid tokens nearing large unlocks unless you are making short-term trades and plan to exit before selling pressure sets in.
On-chain transaction volume vs. TVL: Are funds active or dormant?
TVL: How much money has been deposited?
Trading volume: How frequently funds move.
A pool of funds with a TVL of up to $100 million but a daily trading volume of only $5,000 is essentially "ineffective capital".
Key ratio: Volume/TVL ratio.
High ratio: Capital is active and used efficiently.
A low ratio could indicate "ghost liquidity" or idle funds.
Trader's perspective:
Look for protocols with solid TVL and strong trading volume. What you need is real use, not fake hype.
Summarize
On-chain metrics aren't magic, but they are the closest thing to a "financial statement" in the crypto world. Treat them as analytical tools, not absolute truths. Always cross-validate multiple signals and always think about the true meaning behind the data.
Twitter: https://twitter.com/BitpushNewsCN
BitPush Telegram Community Group: https://t.me/BitPushCommunity
Subscribe to Bitpush Telegram: https://t.me/bitpush


