

Cryptocurrency Market Overview
According to CoinGecko data, global market trends diverged between December 2nd and December 15th, 2025. Despite the Fed's expected rate cut, policy disagreements and expectations of a pause in rate cuts suppressed risk appetite; gold led traditional assets with a year-to-date gain of over 60%, while the stock market hit new highs, but sentiment towards the AI infrastructure sector cooled. Fear in the crypto market rebounded, with trading volume concentrated in mainstream assets and stablecoins, and overall funds leaning towards defensive and volatility-hedging strategies. [1]
In terms of market structure, BTC surged above $94,000 before significantly retreating, forming a downward-sloping high structure on the 4-hour chart, with the $90,000-$91,000 range turning from support to resistance. ETH retreated from around $3,400 but remained stable above $3,000, exhibiting a relatively more robust price structure. Some tokens bucked the trend, with M rising over 46% last week, and MERL and ZEC recording gains of approximately 28% and 19% respectively, becoming short-term bright spots. On the news front, Polygon's network throughput increased by approximately 33% after completing the Madhugiri hard fork upgrade; Ethereum network daily transaction fees (90-day average) fell below 300 ETH/day, reaching multi-year lows. Meanwhile, institutions continue to promote Bitcoin staking, and regulators have signaled an acceleration in rule-making and expansion of the scope of eligible collateral, indicating a marginal improvement in the long-term regulatory environment.
In terms of on-chain fund flows, Hyperliquid significantly led with a net inflow of approximately $190 million, reflecting the market's concentrated bets on on-chain perpetual contracts, high-frequency trading, and high-capital-efficiency infrastructure; new trading scenarios amplified the scale of fund inflows in the short term. In contrast, the actual adoption rate of the Stable public chain after its mainnet launch was lower than initially anticipated. Given the dominance of existing mature public chain stablecoin networks, its future performance still depends on the implementation of real-world applications and use cases.
Overall, the market is still in a phase of "high macroeconomic uncertainty and structural opportunities dominating," with capital behavior focused on defensive allocation and efficiency. Conditions for a comprehensive recovery in risk appetite in the short term are not yet mature, and the market is more likely to maintain a pattern of cautious speculation and structural rotation.
A panoramic view of the price fluctuation data in this round.
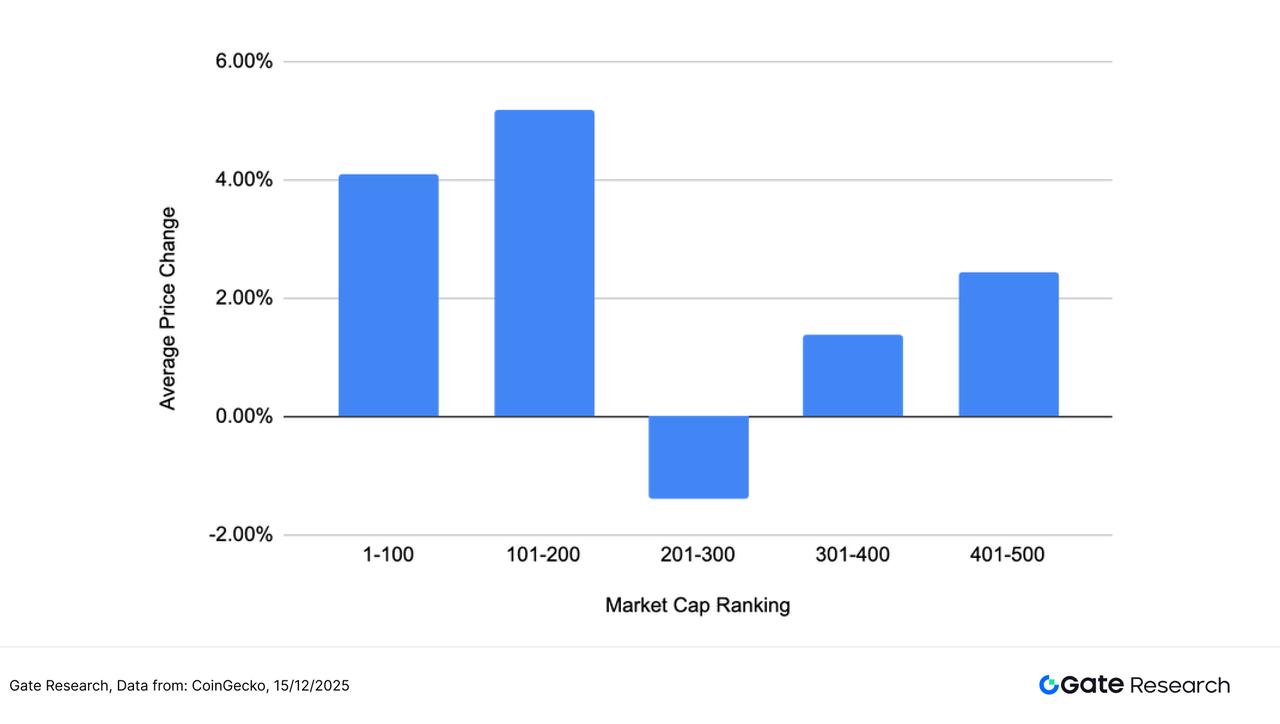
This article groups and analyzes the top 500 tokens by market capitalization, observing their average gains from December 2nd to December 15th. The market did not experience a comprehensive synchronized correction this period, but rather exhibited a clear structural divergence. Assets with higher market capitalization rankings performed relatively better, with the average gain for those ranked 1-100 being 4.10%, and further rising to 5.18% for those ranked 101-200, indicating that mainstream and secondary mainstream assets remain relatively attractive in asset allocation.
In contrast, the 201–300 market capitalization range saw a slight decline of -1.38%, becoming the only group to record negative returns, reflecting that mid-cap tokens were under more significant pressure due to selective capital withdrawal. The 301–400 and 401–500 market capitalization ranges, with even lower market capitalizations, recorded positive returns of 1.38% and 2.43% respectively, indicating that some small-cap assets maintained a moderate recovery driven by a low base and thematic capital inflows.
Overall, the market in this phase exhibited a stratified pattern of "leading gains in top-tier assets, pressure in the middle phase, and recovery at the tail end." Funds did not simply avoid risks but rather tended to make structural allocations among liquidity, narrative, and flexibility, resulting in a significant amplification of performance differences between market capitalization ranges.
Note: Market capitalization distribution is based on CoinGecko data. The top 500 tokens by market capitalization are grouped into groups of 100 (e.g., 1-100, 101-200, etc.). The price changes of tokens within each group from December 2nd to December 15th, 2025 are calculated, and the average of each group is used as the average increase indicator for that market capitalization range. The overall average increase (2.34%) is the average of the individual increases of the top 500 tokens by market capitalization, unweighted.
Figure 1: The overall average increase was 2.34%. This period's market did not experience a comprehensive synchronized correction, but rather showed a clear structural divergence.
Top Gainers and Losers List
Over the past two weeks (December 2 to December 15), the crypto market has been highly divergent amid macroeconomic uncertainties and rapidly shifting narratives, with individual tokens experiencing significant price fluctuations, reflecting that short-term funds are still primarily engaged in high-volatility speculation.
Top Gainers: High-Volatility Themed Cryptocurrencies See Concentrated Surge, BEAT and NIGHT Lead the Way
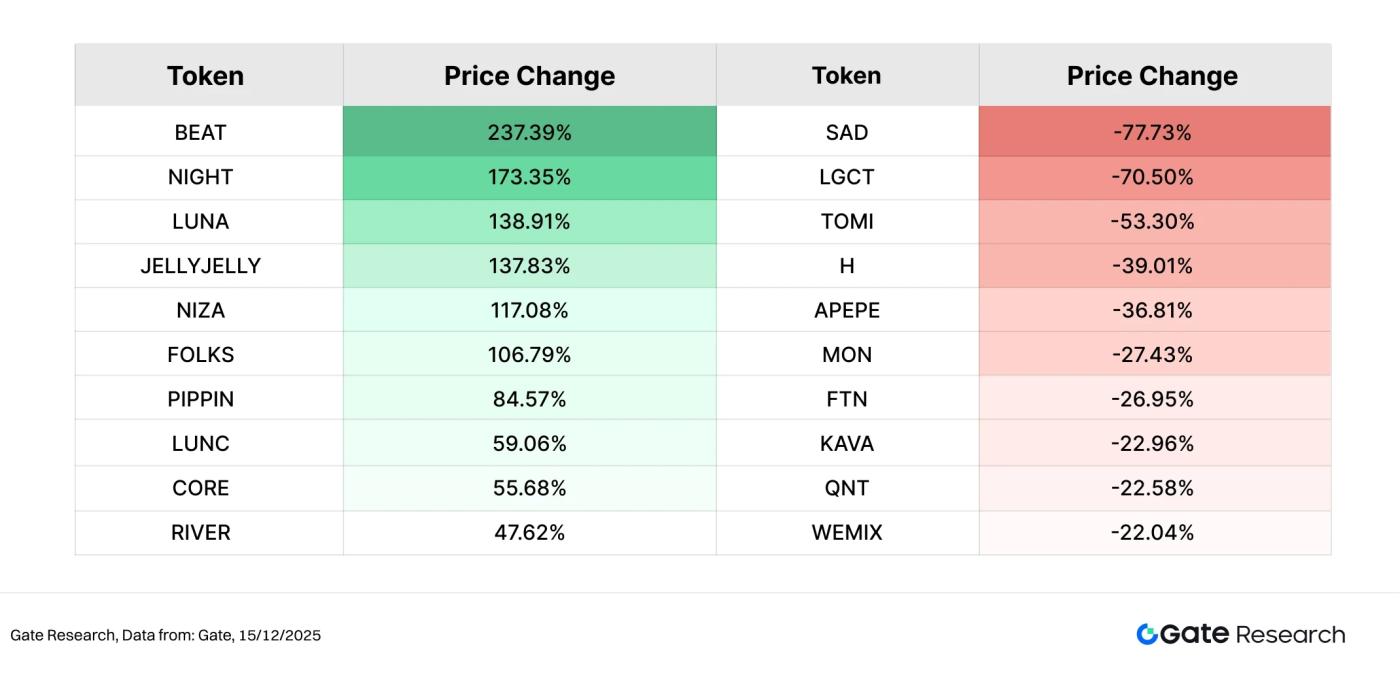
In this period's gainers list, BEAT topped the list with a gain of 237.39%. As an application token focusing on AI music and virtual content creation, BEAT benefited from the continued rise in AI narratives and its small market capitalization, attracting concentrated short-term capital and amplifying its price elasticity.
NIGHT (+173.35%) ranked second. As the ecosystem token of Midnight Network, it emphasizes a compliant privacy blockchain narrative of "privacy default + selective disclosure," targeting scenarios such as finance, identity, and data sharing. With the mainnet and roadmap becoming clearer, the market's phased reassessment of privacy computing and compliant infrastructure has propelled NIGHT's outstanding performance during the market recovery.
Subsequently, tokens such as LUNA and JELLYJELLY also saw gains exceeding 100%, reflecting the overall preference of funds for small-cap, narrative-driven, and highly volatile stocks.
Top decliners: High-risk assets saw significant pullbacks, while previously weak consensus tokens came under pressure.
On the decliners list, SAD and LGCT led the losses, indicating that tokens with weak liquidity or insufficient fundamental support were the first to face selling pressure when market volatility intensified. TOMI, H, APEPE, MON, and others also recorded declines ranging from 30% to 50%, mostly concentrated in asset types with fading narratives, limited trading depth, or excessive speculation in the past, reflecting funds' temporary avoidance of high-beta risks.
Overall, this period's gainers and losers list exhibits a typical pattern of "the strong getting stronger and the weak being quickly eliminated." Funds haven't completely withdrawn from the market; instead, they've selectively bet on high-potential themes in a highly volatile environment, while rapidly reducing exposure to assets lacking sustained narratives and follow-through. In the short term, small-cap tokens with clear themes, community consensus, and trading activity may continue to be active, but overall risk appetite remains cautious, with a significant structural market trend.
Figure 2: BEAT maintained its leading position in the market with a gain of 237.39%, mainly benefiting from the continued rise in the AI narrative and the high elasticity brought by its small market capitalization, which attracted a concentrated influx of short-term funds, thus significantly amplifying the price volatility.
Relationship between market capitalization ranking and price change
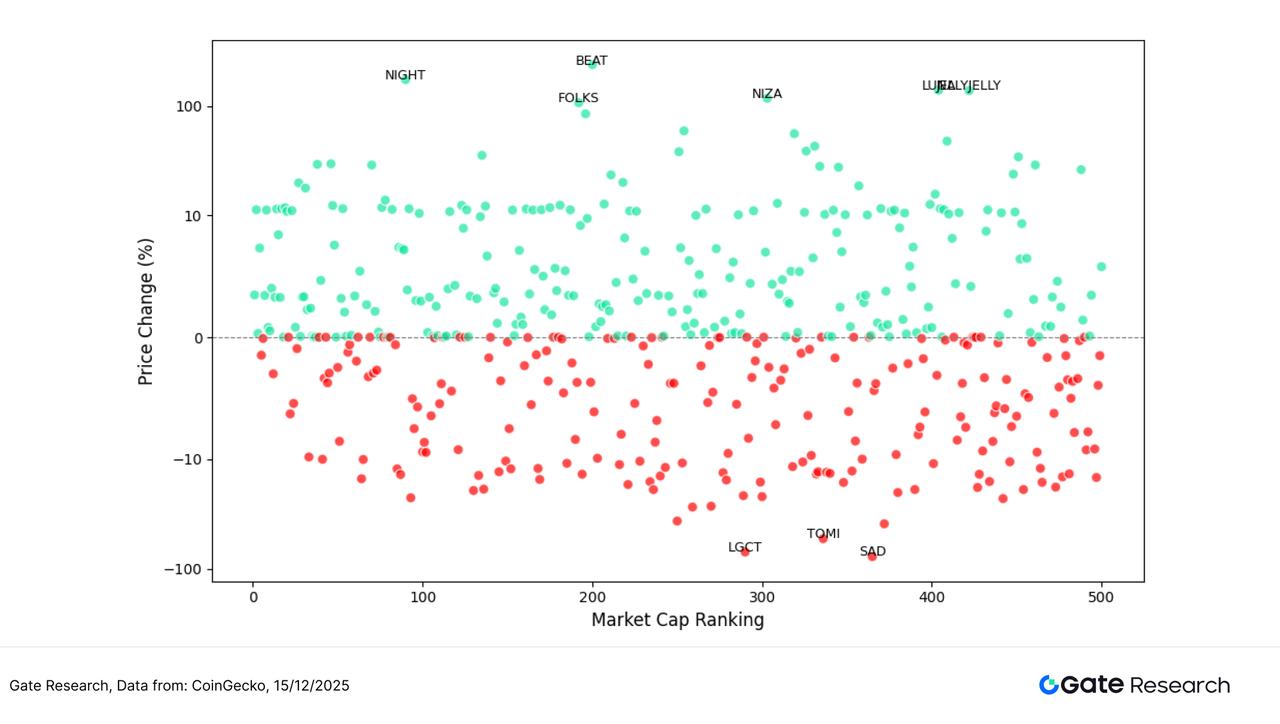
To observe the structural characteristics of token performance in this round of market activity, this article presents a scatter plot of the top 500 tokens by market capitalization. The horizontal axis represents market capitalization ranking (the further to the left, the larger the market capitalization), and the vertical axis represents the price change from December 2nd to December 15th. Each dot in the plot represents a token, with green indicating an increase and red indicating a decrease.
Overall, the majority of tokens declined, with negative returns widely distributed across all market capitalization ranges, indicating that the market as a whole remains in a phase of weak sentiment and limited recovery momentum. However, on the upside, tokens with significant gains were clearly concentrated in the lower-ranked small and mid-cap segments, reflecting a preference among investors for highly volatile and narrative-driven assets.
Structurally, tokens with high gains, such as BEAT, NIGHT, FOLKS, NIZA, and JELLYJELLY, are mainly distributed in the middle and later stages of market capitalization, forming scattered but significant "strong outliers," indicating that short-term funds are participating in the market with concentrated betting. In contrast, tokens with the largest declines, such as LGCT, TOMI, and SAD, are also concentrated in the middle and later stages of market capitalization, with larger pullbacks, reflecting that this stage is more prone to accelerated declines when liquidity contracts.
Overall, this round of market activity is characterized by "relative stability in the overall market and high divergence in small and mid-cap stocks." The upward movement is not widespread but concentrated in a few high-consensus, high-volatility stocks; the downward movement, however, has a wider reach and has become the dominant trend in the market. This structure indicates that current capital flows are still primarily driven by short-term trading and speculative themes, and risk appetite has not yet fully recovered.
Figure 3: The scatter distribution of price changes for the top 500 tokens by market capitalization shows that rising projects are concentrated in a few high-consensus, high-volatility tokens; while falling projects cover a wider range and represent the dominant market trend.
Top 100 Market Value Ranking
In this round of market volatility, the top 100 tokens by market capitalization continued to diverge, with mainstream assets as a whole under pressure, but some projects with clear narratives or structural support still achieved relative gains.
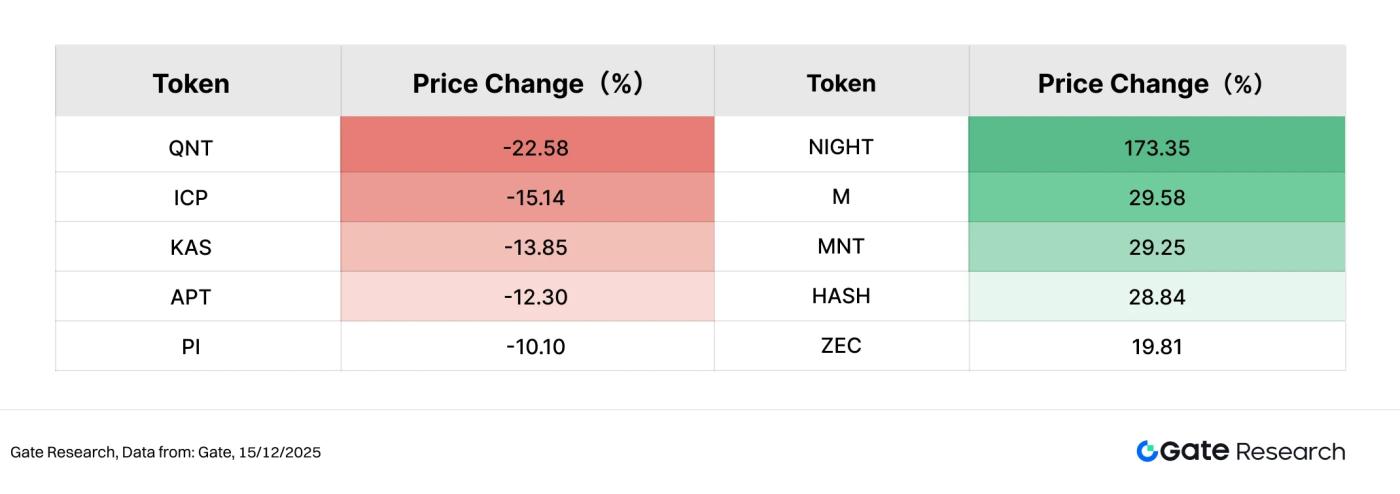
In terms of gains, NIGHT (+173.35%) significantly outperformed the top 100 tokens by market capitalization, becoming one of the few mainstream tokens to record a substantial increase. This reflects the concentrated attention that privacy computing and compliant blockchain narratives have received from investors during the current market recovery. Following closely behind, M (+29.58%) and MNT (+29.25%) showed relatively stable performance, while HASH (+28.84%) and ZEC (+19.81%) also recorded double-digit gains, indicating that computing power, infrastructure, and privacy-related assets have some resilience amid risk aversion. Overall, while the number of rising projects among the top 100 by market capitalization was limited, the gains were highly concentrated, exhibiting a characteristic of "a few strong performers, not widespread gains."
In terms of decline, QNT (-22.58%) saw the largest drop, followed by ICP (-15.14%), KAS (-13.85%), and APT (-12.30%), which also experienced significant pullbacks. The stocks that retreated were mostly those with high beta characteristics or relatively high valuations in the early stages, and they faced more pronounced pressure against the backdrop of cooling risk appetite and tightening liquidity.
Overall, the top 100 assets by market capitalization exhibited a structural pattern of "a few with strong narratives breaking through, while the majority of others experienced pullbacks." Funds did not completely withdraw from mainstream assets, but rather selectively allocated to tokens with differentiated positioning and medium-term logic support, indicating that the current market is still in a stage of cautious speculation and prioritizing structural opportunities.
Figure 4: Among the top 100 tokens by market capitalization, NIGHT led the gains, reflecting the concentrated attention that privacy computing and compliant blockchain narratives received during the market's phase of recovery.
Analysis of this round of increased trading volume
Analysis of transaction volume growth
Beyond price rebounds, observing changes in trading volume provides a clearer picture of the structure of capital participation. This period's data shows that the increased trading volume is mainly concentrated in small-to-mid-cap tokens ranked 200-400 by market capitalization, exhibiting an overall characteristic of "increased volume but significant divergence in rebound performance."
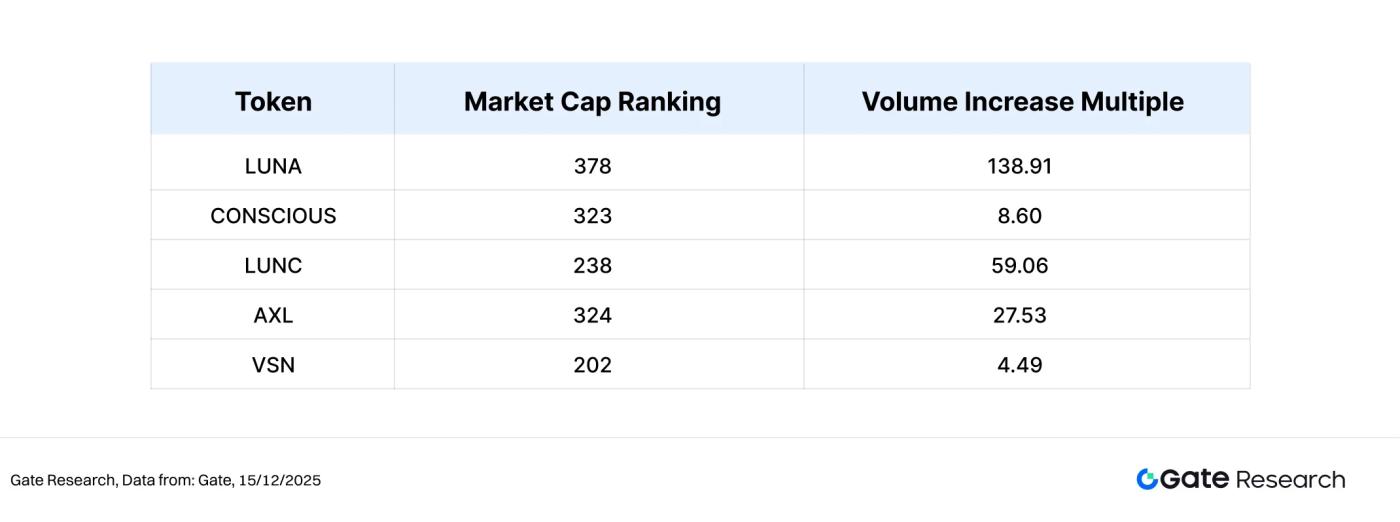
Among them, LUNA saw a 138.91-fold increase in trading volume and a 24.58% rebound, making it the most significant example of volume and price resonance this period. This indicates that short-term funds are concentrating their entry at low levels, betting on a rebound. CONSCIOUS also showed a healthy "volume-price synchronization" structure, with trading volume increasing 8.60 times and prices rebounding 19.05%, reflecting a simultaneous recovery in market attention and buying support.
In contrast, while LUNC and AXL recorded trading volumes of 59.06 times and 27.53 times respectively, their price rebounds were only 10.40% and 5.95%, indicating that the increased volume was more due to short-term turnover and liquidity replenishment than the entry of trend-following funds. VSN's trading volume and price recovery were both relatively limited, and the overall trend was still one of tentative recovery.
In summary, the tokens that saw increased trading volume this period were mainly mid-to-late-market-cap assets. The rise in volume was largely driven by short-term speculation and rebound trading, with only a few tokens truly achieving both "increased volume and a significant rebound." This indicates that current market funds are more inclined towards short-term trading opportunities rather than a full-fledged trend, and risk appetite has not yet shown a substantial recovery.
Figure 5: Trading volume for tokens such as LUNA and CONSCIOUS increased significantly this period, with some achieving a simultaneous rebound in both volume and price. However, some projects showed a structure of increased volume but limited price increases, indicating that current funds are mainly engaged in short-term speculation and liquidity trading, and a trend-based buying has not yet been fully established.
Trading volume changes and price analysis
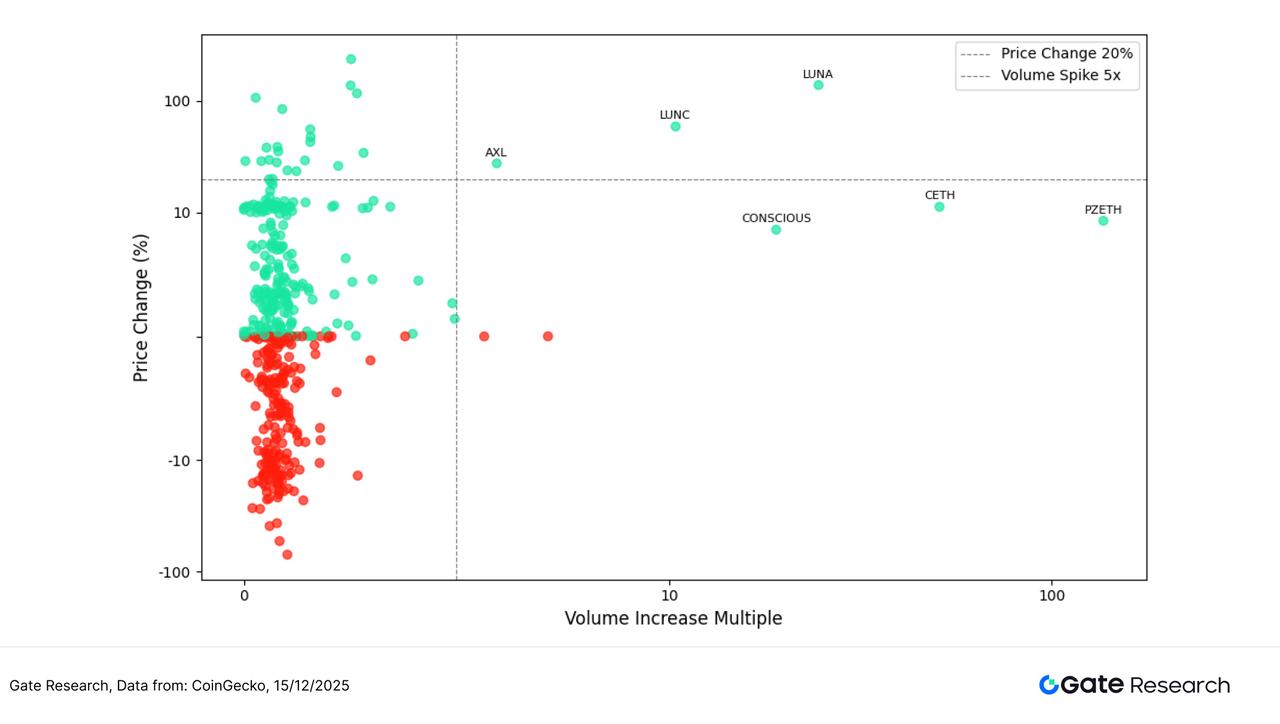
To further characterize the relationship between increased trading volume and price response, this paper cross-analyzes the volume growth rate with the price change during the same period. In the figure, the horizontal axis represents the volume increase factor, the vertical axis represents the price change magnitude, and different market structure regions are divided by key thresholds (such as a 5-fold increase in trading volume or a 20% price increase).
From an overall distribution perspective, most tokens are still concentrated in the range of low trading volume and small price fluctuations, indicating that the overall market trading activity is limited and incremental funds have not yet formed a systematic return. At the same time, the number of declining points is still slightly more than the number of rising points, reflecting that market sentiment remains cautious and the market is in a consolidation and recovery phase.
In areas where both increased volume and price increases occur simultaneously, only a few tokens stand out. Among them, LUNA exhibited a typical "increased volume + strong rebound" structure, with its trading volume increasing more than 100 times while its price rebounded by over 100%, indicating that short-term funds concentrated their entry at low levels and formed a phased consensus. LUNC also showed a high increase in trading volume and a double-digit price increase, but its price elasticity was slightly weaker than LUNA's, reflecting more of a rebound and recovery under high-frequency trading.
In contrast, while tokens like CONSCIOUS and AXL saw significant increases in trading volume, their price gains remained within the 10%–20% range, indicating that funds were primarily engaged in exploratory participation or short-term speculation, and a sustained upward trend had not yet emerged. Other tokens, such as CETH and PZETH, experienced only moderate price increases despite extremely high trading volume, reflecting their reliance on staking, derivatives, or structured assets. The high trading volume mainly stemmed from portfolio adjustments, arbitrage, or on-chain liquidity needs, rather than directional buying.
Overall, the market this period exhibited a clear "volume-price stratification" characteristic. Very few tokens truly achieved volume-price resonance, and most of the increased volume failed to translate into significant price increases. This indicates that current funds are still mainly engaged in short-term trading and liquidity operations, and risk appetite and trend-following funds have not yet fully returned.
Figure 6: The scatter distribution of trading volume growth rate and price change shows that increased volume does not necessarily correspond to price increases. Only a few tokens achieved volume-price resonance, and the market as a whole is still in a phase of consolidation and structural game.
Correlation analysis
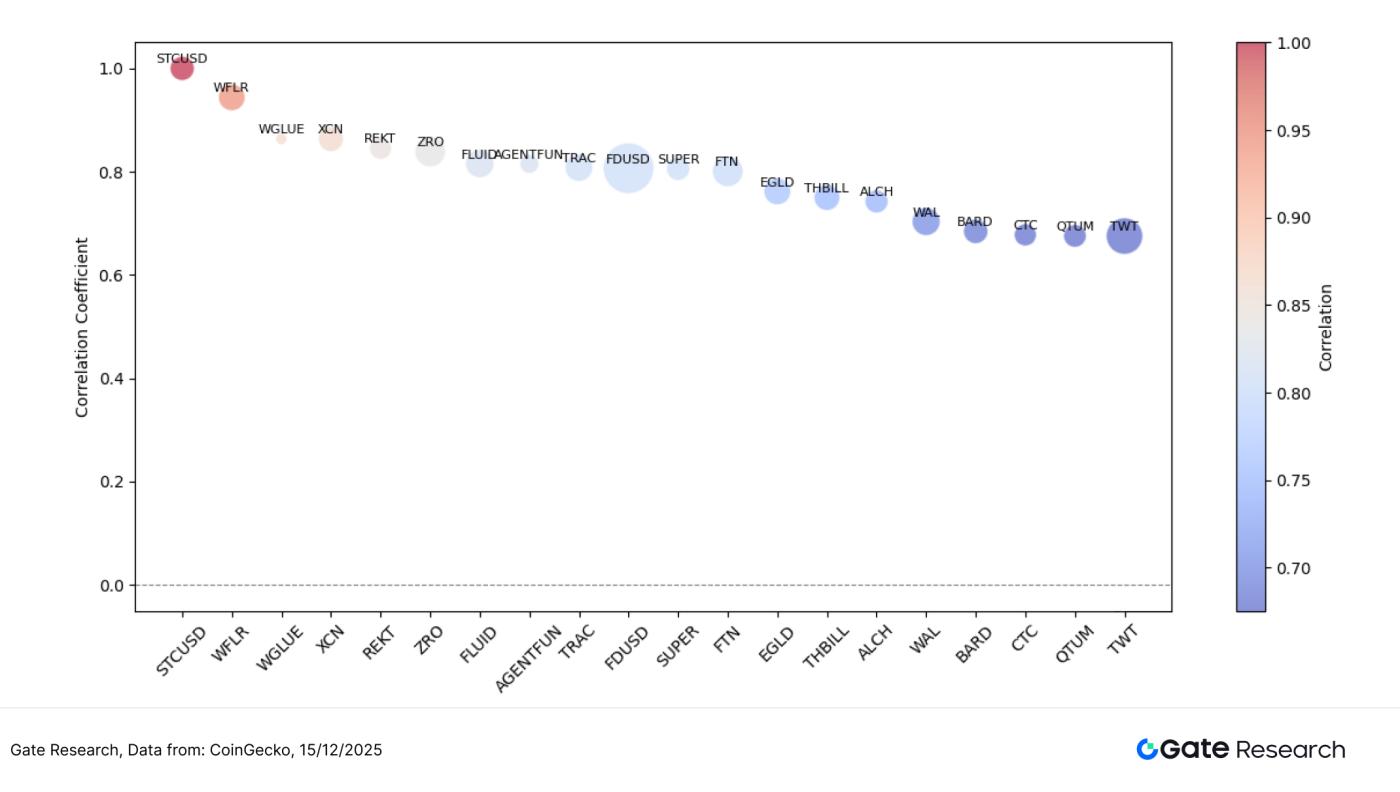
After exploring the correlation between trading volume and price performance, this paper further analyzes the systematic correlation between the two from a statistical perspective. By using "trading volume growth rate / market capitalization" as a relative indicator of capital activity and calculating its correlation coefficient with price fluctuations, we can identify token types that are more susceptible to capital inflows. In the graph, the size of the circles represents the strength of relative capital activity; the larger the circle, the more significant the expansion of trading volume per unit of market capitalization, and the higher the price sensitivity to capital inflows.
As can be seen from the chart, the correlation of most tokens is concentrated in the range of 0.65–0.85, indicating that in the current market, price fluctuations are still largely driven by trading activity, but they do not show a fully consistent and strong synchronous state, reflecting that the behavior of funds has become somewhat stratified.
From the perspective of high correlation ranges, the correlation coefficients of tokens such as STCUSD, WFLR, WGLUE, and XCN are close to or higher than 0.85–0.90, indicating that their price movements are highly consistent with changes in trading volume. These assets often have strong trading attributes, high liquidity dependence, or obvious narrative-driven characteristics, and their prices are more likely to be rapidly pushed up or down during periods of high volume, making them typical high-beta, sentiment-sensitive assets.
Tokens with a correlation between 0.75 and 0.85 exhibit characteristics of "fluctuation with volume but with controllable amplitude," meaning their prices are influenced by both capital inflows and outflows, while also retaining some fundamental or functional support. In contrast, low-correlation assets such as WAL, BARD, CTC, and QTUM are less sensitive to changes in trading volume, driven more by medium- to long-term demand and ecosystem development, and possess relative defensiveness. Overall, the correlation distribution in this period shows a clear structural stratification: high-correlation assets are more driven by trading and sentiment, medium-correlation assets consider both capital and logic, and low-correlation assets are more independent, reflecting that the market has entered a stage of refined pricing based on asset attributes.
Figure 7: The correlation between trading volume activity and price fluctuations shows that trading and sentiment-driven tokens have a significantly higher correlation, while infrastructure and mature ecosystem tokens are relatively less sensitive to changes in trading volume, indicating a clear market structure stratification.
The current crypto market continues its structural rotation pattern under the pressure of macroeconomic uncertainties. The top 500 tokens by market capitalization recorded a modest increase of approximately 2.34%, but their performance was clearly divergent. Top-tier assets outperformed, mid-tier tokens faced pressure, while smaller-cap tokens showed signs of recovery. In terms of themes, highly volatile assets saw concentrated surges, with tokens like BEAT, NIGHT, and LUNA showing significant strength driven by AI applications, privacy computing, and high-volatility games. Conversely, tokens with weak consensus or high beta, such as SAD, LGCT, and TOMI, experienced rapid pullbacks. While trading volume increased significantly in some small and mid-cap tokens, the overall trend remained one of "volume divergence," indicating that a clear trend consensus has yet to form.
In addition to market trends, several potential airdrop projects are ongoing, covering popular areas such as AI, Layer 2, social points, and identity verification. By staying on track and actively participating, users can potentially gain a competitive edge in a volatile market, securing token incentives and airdrop eligibility. The following section outlines four noteworthy projects and participation methods to help users systematically capitalize on Web3 opportunities.
Airdrop Hot Projects
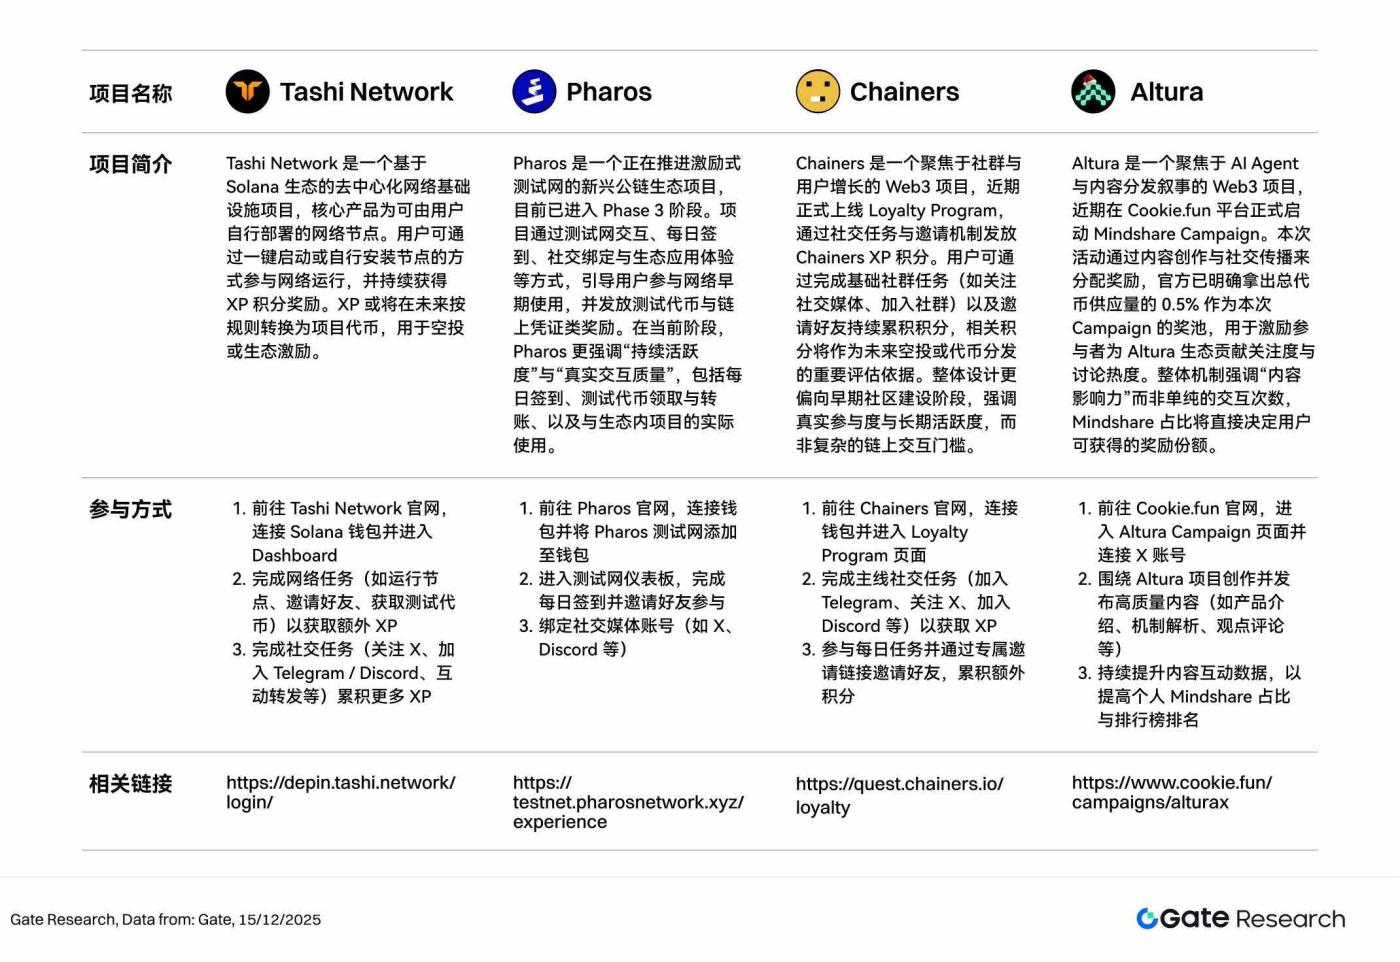
This article summarizes four airdrop and incentive projects worth paying attention to from December 2nd to December 15th, 2025: Tashi Network (Solana ecosystem node-based XP Farming network), Pharos (an incentivized testnet public chain advancing to Phase 3), Chainers (a community-task-centric Loyalty Program), and Altura (a Mindshare content incentive project based on Cookie.fun). All of these projects are in their early stages or in the incentive launch phase. Users can accumulate contribution records by deploying nodes, participating in testnet interactions, completing social tasks, or creating content, thus laying the groundwork for potential airdrops, token distributions, or reward settlements in the future.
Tashi Network
Tashi Network is a decentralized network infrastructure project based on the Solana ecosystem. Its core product is a network node that users can deploy themselves. Users can participate in network operation by starting the network with one click or by installing the node themselves, and continuously earn XP points as rewards. XP may be converted into project tokens in the future according to the rules for airdrops or ecosystem incentives. [2]
How to participate:
1. Go to the Tashi Network website, connect your Solana wallet, and access the Dashboard.
2. Complete network tasks (such as running nodes, inviting friends, and earning test tokens) to earn extra XP.
3. Complete social tasks (follow X, join Telegram/Discord, interact and share, etc.) to accumulate more XP.
Pharos
Pharos is an emerging public blockchain ecosystem project that is advancing an incentivized testnet and is currently in Phase 3. The project guides users to participate in the early use of the network through testnet interaction, daily check-ins, social binding, and ecosystem application experience, and distributes test tokens and on-chain voucher rewards. At the current stage, Pharos emphasizes "continuous activity" and "real interaction quality", including daily check-ins, test token receipt and transfer, and actual use with projects within the ecosystem. [3]
How to participate:
1. Go to the Pharos website, connect your wallet, and add the Pharos testnet to your wallet.
2. Access the testnet dashboard, complete the daily check-in, and invite friends to participate.
3. Link your social media accounts (such as X, Discord, etc.)
Chainers
Chainers is a Web3 project focused on community and user growth. It recently launched its Loyalty Program, distributing Chainers XP points through social tasks and an invitation mechanism. Users can accumulate points by completing basic community tasks (such as following social media and joining communities) and inviting friends. These points will serve as an important evaluation criterion for future airdrops or token distributions. The overall design leans towards the early stages of community building, emphasizing genuine participation and long-term activity rather than complex on-chain interaction barriers. [4]
How to participate:
1. Go to the Chainers website, connect your wallet, and enter the Loyalty Program page.
2. Complete main social tasks (join Telegram, follow X, join Discord, etc.) to earn XP.
3. Participate in daily tasks and invite friends via your exclusive invitation link to accumulate extra points.
Altura
Altura is a Web3 project focusing on AI agents and content distribution narratives. Recently, it officially launched the Mindshare Campaign on the Cookie.fun platform. This campaign distributes rewards based on content creation and social sharing. The official team has clearly allocated 0.5% of the total token supply as the prize pool for this campaign to incentivize participants to contribute attention and discussion to the Altura ecosystem. The overall mechanism emphasizes "content influence" rather than simply the number of interactions; the Mindshare percentage will directly determine the reward share that users can receive. [5]
How to participate:
1. Go to the Cookie.fun website, enter the Altura Campaign page, and connect your X account.
2. Create and publish high-quality content related to the Altura project (such as product introductions, mechanism analysis, opinions, and commentary).
3. Continuously improve content interaction data to increase individual Mindshare share and leaderboard ranking.
hint
Airdrop plans and participation methods may be updated at any time. Users are advised to follow the official channels of the above projects for the latest information. Users should also participate cautiously, be aware of the risks, and conduct thorough research before participating. Gate does not guarantee the distribution of subsequent airdrop rewards.
Summarize
Looking back at the period from December 2nd to December 15th, 2025, despite the Fed's expected rate cut, policy divergences and the anticipated pause suppressed risk appetite, resulting in a consolidation pattern for both BTC and ETH. At the on-chain level, funds clearly concentrated on high-efficiency derivatives and trading infrastructure, with Hyperliquid leading in net inflows, reflecting the market's continued bets on on-chain perpetual contracts and high-frequency trading scenarios. In terms of themes, funds clearly concentrated on high-elasticity sectors, with AI applications, privacy computing, and high-volatility game-related assets performing strongly, including BEAT, NIGHT, and LUNA, which recorded significant gains. In contrast, the narratives of new public chains and stablecoins were not fully realized. The volume and price structure shows that a few assets, such as LUNA and CONSCIOUS, achieved volume and price resonance, but most projects with increased volume saw limited gains, reflecting that funds were still primarily focused on short-term rebounds and liquidity speculation. Correlation analysis further indicates that high-beta and trading tokens are most sensitive to sentiment, while infrastructure and mature ecosystem assets show relatively independent price movements.
Furthermore, Tashi Network, Pharos, Chainers, and Altura, which were tracked in this period, are all in a clear incentive implementation phase. Their focus is respectively on node network expansion, testnet activity accumulation, community growth and loyalty points, and content dissemination and mindshare competition. Overall, the incentive paths for each project are clear, and the participation threshold is relatively controllable. Users can complete tasks such as node operation, daily check-ins, on-chain interactions, inviting friends, or publishing content to continuously increase their XP, points, or Mindshare weight, thereby amplifying the potential airdrop and reward distribution ratio.
References
1. CoinGecko, https://www.coingecko.com/
2. Tashi Network, https://depin.tashi.network/login/
3. Pharos, https://testnet.pharosnetwork.xyz/experience
4. Chainers, https://quest.chainers.io/loyalty
5. Altura, https://www.cookie.fun/campaigns/alturax
Gate Research is a comprehensive blockchain and cryptocurrency research platform that provides readers with in-depth content, including technical analysis, insights into hot topics, market reviews, industry research, trend forecasts, and macroeconomic policy analysis.
Disclaimer
Investing in the cryptocurrency market involves high risks. Users are advised to conduct independent research and fully understand the nature of any assets and products they intend to purchase before making any investment decisions. Gate assumes no responsibility for any loss or damage arising from such investment decisions.


