

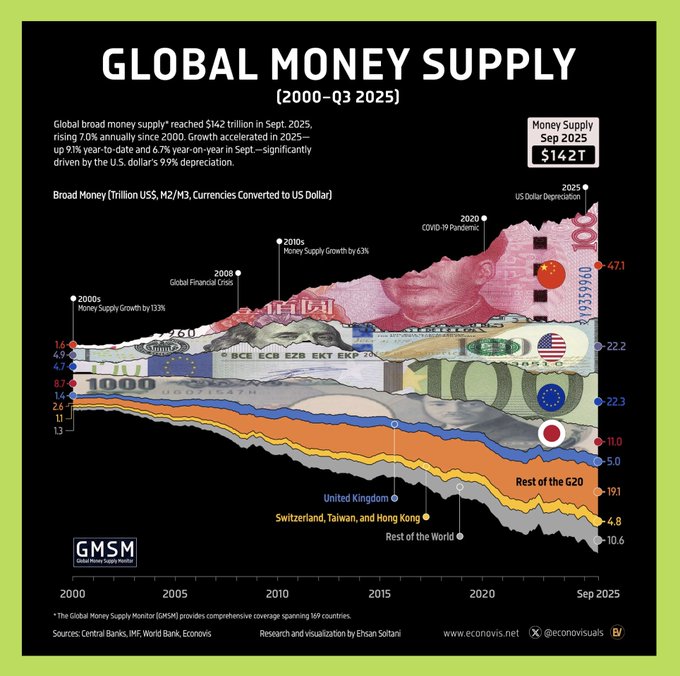
💵 25 Years of Money Printing: A Macroeconomic Picture Investors Cannot Ignore 📌 1. To what extent has the global money supply expanded? By September 2025, the total global money supply is projected to reach approximately $142 trillion, compared to just $26 trillion in 2000. This represents a more than fivefold increase in 25 years, with a CAGR of approximately 7% per year – a very high rate considering the scale of the entire global financial system. In 2025 alone, the growth momentum will accelerate significantly: +9.1% year-to-date +6.7% year-on-year A significant part of this is due to the USD depreciating by approximately 9.9%, causing the money supply denominated in USD to swell more rapidly. This reflects the long-term nature of fiat currency: despite short-term tightening periods, the overall trend is expansion. 📌 2. Where is liquidation concentrated and what is its cycle of movement? The global money supply is currently highly concentrated in a few major economic centers: - China: $47.1 trillion (~33%) - EU: $22.3 trillion (~15.7%) - US: $22.2 trillion (~15.6%) - Japan: $11.0 trillion (~7.7%) - UK: $5 trillion (~3.5%) → These five regions account for approximately 75% of global liquidation , indicating that the world's monetary cycle is essentially determined by very few major central banks. More importantly, the chart shows that the money supply is not increasing steadily, but rather increasing sharply with each shock: - 2000s: Financial globalization → Money supply increased by approximately 133% - 2008: Financial crisis → Large-scale easing - 2010s: Money supply continued to increase by approximately 63%. - 2020–2022 (COVID): Money supply increased dramatically by approximately 25% in just two years. - 2022–2024: Strong tightening → Slowing money supply growth, only ~1.4% CAGR 📌 3. Key Insight for Investors: The Liquidation Cycle is Shifting Phases Data from 2025 suggests the money supply is accelerating again, potentially marking the end of the most intense tightening phase of the past cycle. This has several important implications: - Global liquidation is reopening in a structural direction, not just a short-term rebound. - The pressure of "cash shortage" on risky assets (stocks, crypto, real estate) is gradually decreasing compared to 2022–2024. - A weakening USD accompanied by an increase in the money supply typically creates a more favorable environment for non-cash assets. In summary, this diagram reinforces a fundamental principle: In a fiat-based system, the money supply tends to expand over time, and the long-term investment cycle always revolves around anticipating and following the liquidation cycle, rather than avoiding it. Source: Ehsan Soltani - Macro Market Analyst
This article is machine translated
Show original

Upside GM
@gm_upside
08-21
🇨🇳 CUNG TIỀN M2 TRUNG QUỐC - TÁC ĐỘNG ĐẾN BTC HƠN CẢ USD 🇺🇸?
1. Khi Mỹ bơm ít tiền hơn, Bitcoin có tăng giá không?
Biểu đồ cho thấy mỗi lần lượng tiền của Mỹ trong tổng cung tiền thế giới giảm, Bitcoin thường tăng mạnh.
Ví dụ năm 2011, tỷ lệ tiền x.com/gm_upside/stat…

From Twitter
Disclaimer: The content above is only the author's opinion which does not represent any position of Followin, and is not intended as, and shall not be understood or construed as, investment advice from Followin.
Like
Add to Favorites
Comments
Share
Relevant content


