

Lighter (LIT), the Token behind the newly launched decentralized perpetuals exchange, is still finding its footing after its launch thanks to the Airdrop. Currently, LIT is trading around $2.73 after the initial drop, but the post-list price has held up more firmly than many expected.
Despite the emergence of many new Token on the market, the price of LIT remains above its lowest level since listing. There have been buyers, but their confidence isn't yet truly strong.
The question now is: Is this a real support zone or just a temporary impetus before the sellers regain control?
Cash flow shows early strength.
Early signs of cash flow indicate that Capital is returning as prices fall.
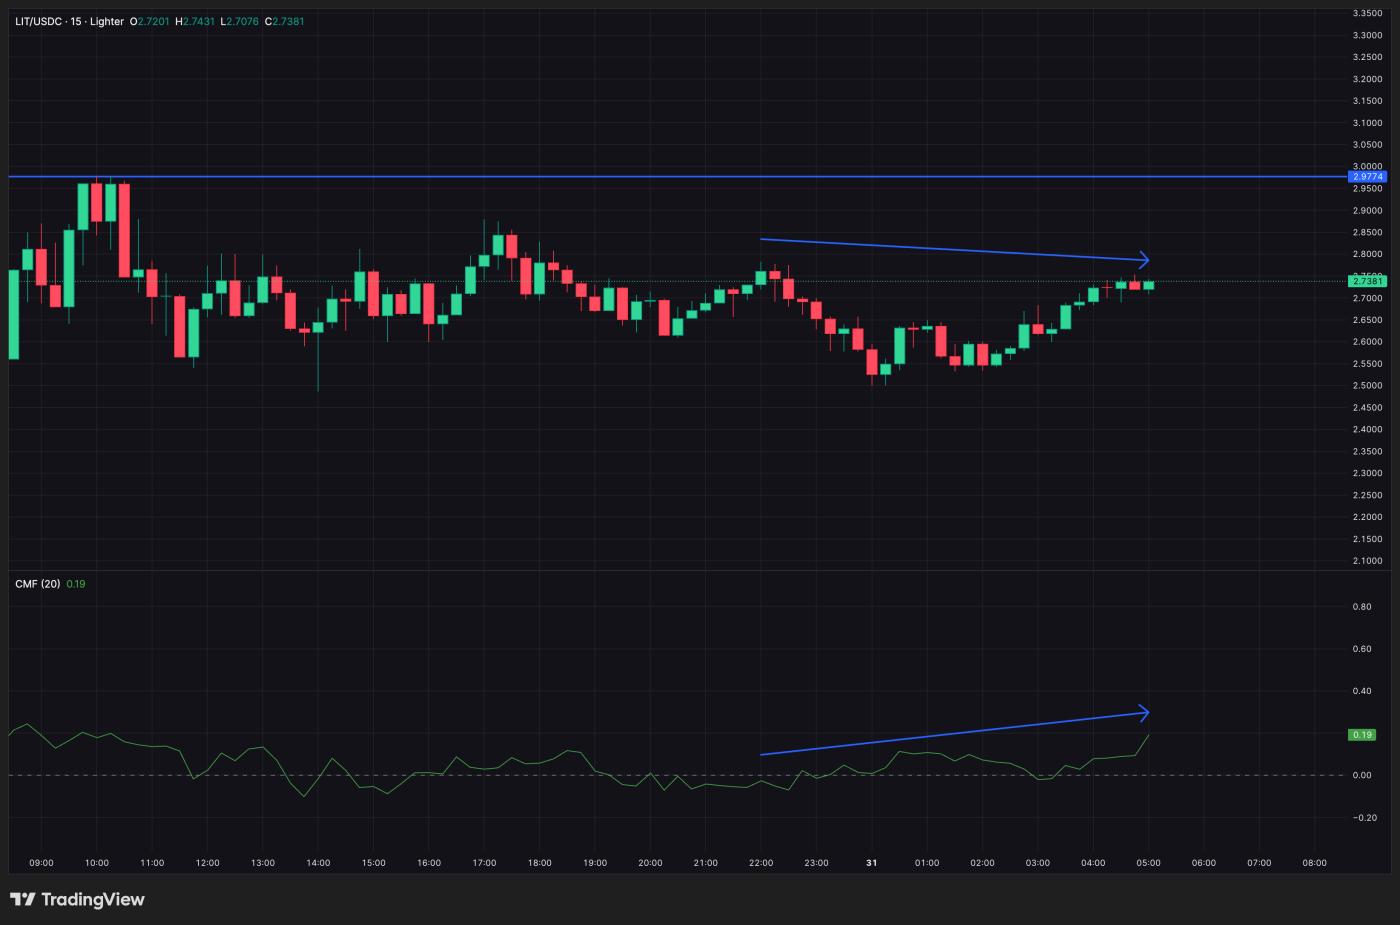
The Chaikin Money Flow (CMF) indicator, which measures the buying/selling power of large money flows based on volume, is trending upward on the 15-minute chart, while the price has been slightly declining since December 30-31, 2023. This is a bullish divergence. It suggests that large investors are buying LIT during periods of downward volatility, a common occurrence in the context of sell-offs after Airdrop.
Want more Token analysis like this? Sign up for the daily Crypto newsletter from editor Harsh Notariya here .
 Cash flow continues to increase: Lighter.XYZ
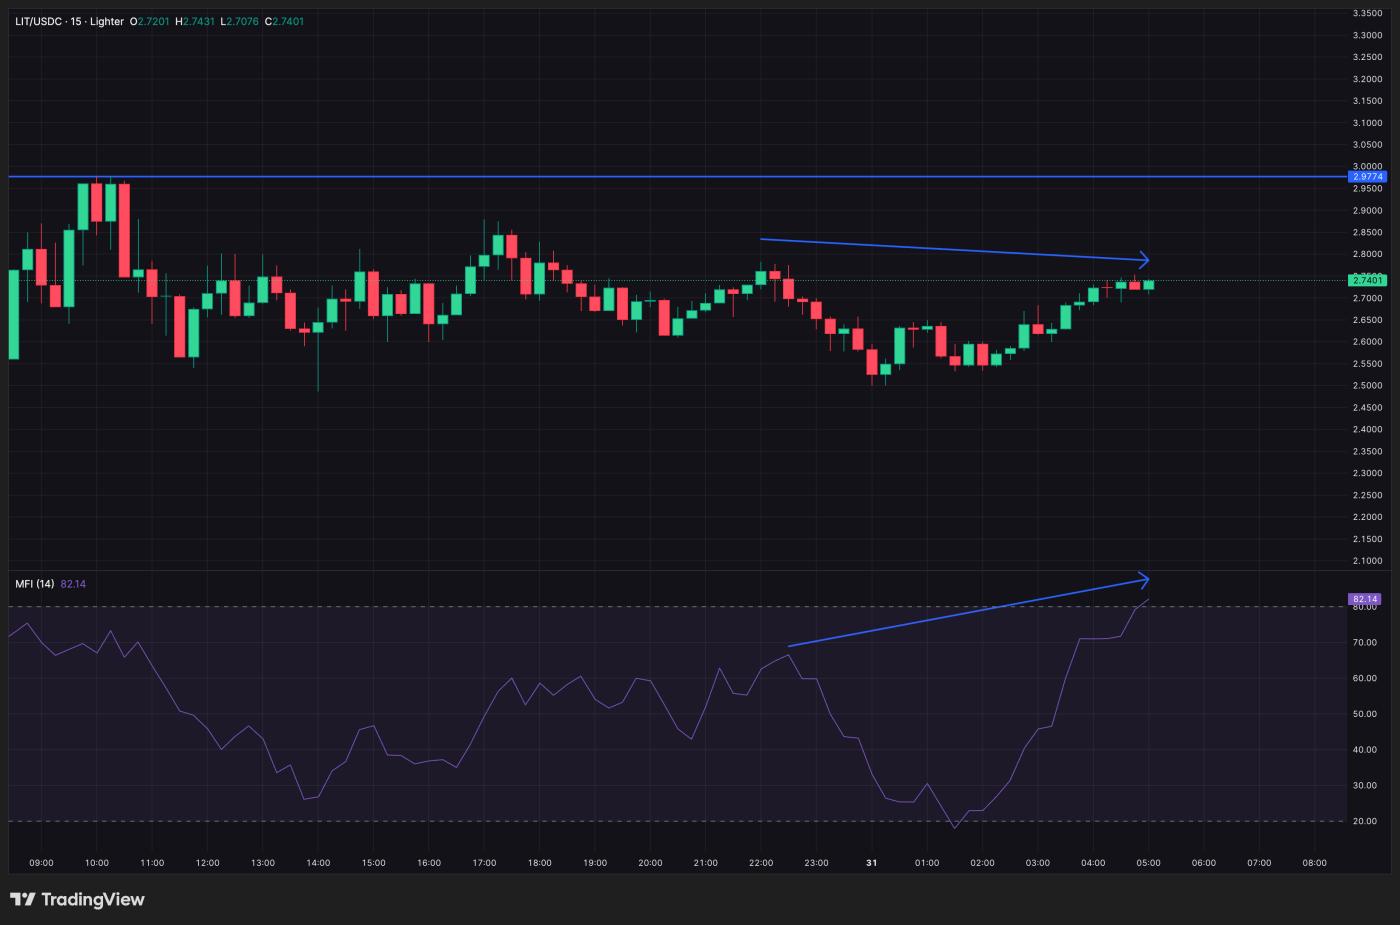
The Money Flow Index (MFI), which tracks buying pressure based on price and volume, followed a similar pattern: the MFI peaked higher while the price declined slightly, indicating buying activity during the price dip and support from retail investors during the Lighter sell-off .
 Investors buy when LIT prices fall: Lighter.XYZ
This double divergence is significant. It shows that selling pressure from Airdrop Token is being met with buying pressure instead of giving up. The appearance of whales buying further demonstrates this strength. Recent on-chain data shows many large wallets buying LIT after the sale, coinciding with the upward trend of CMF.
If this cash flow continues, the price of Lighter could be pushed even higher.
However, if the CMF reverses and falls below the equilibrium zone, and the MFI fails to maintain its upward momentum (currently in the overheated zone), the support argument will weaken considerably.
Short-term strength is emerging, but further confirmation is needed.
In the short term, initial developments indicate areas where buyers need to protect themselves.
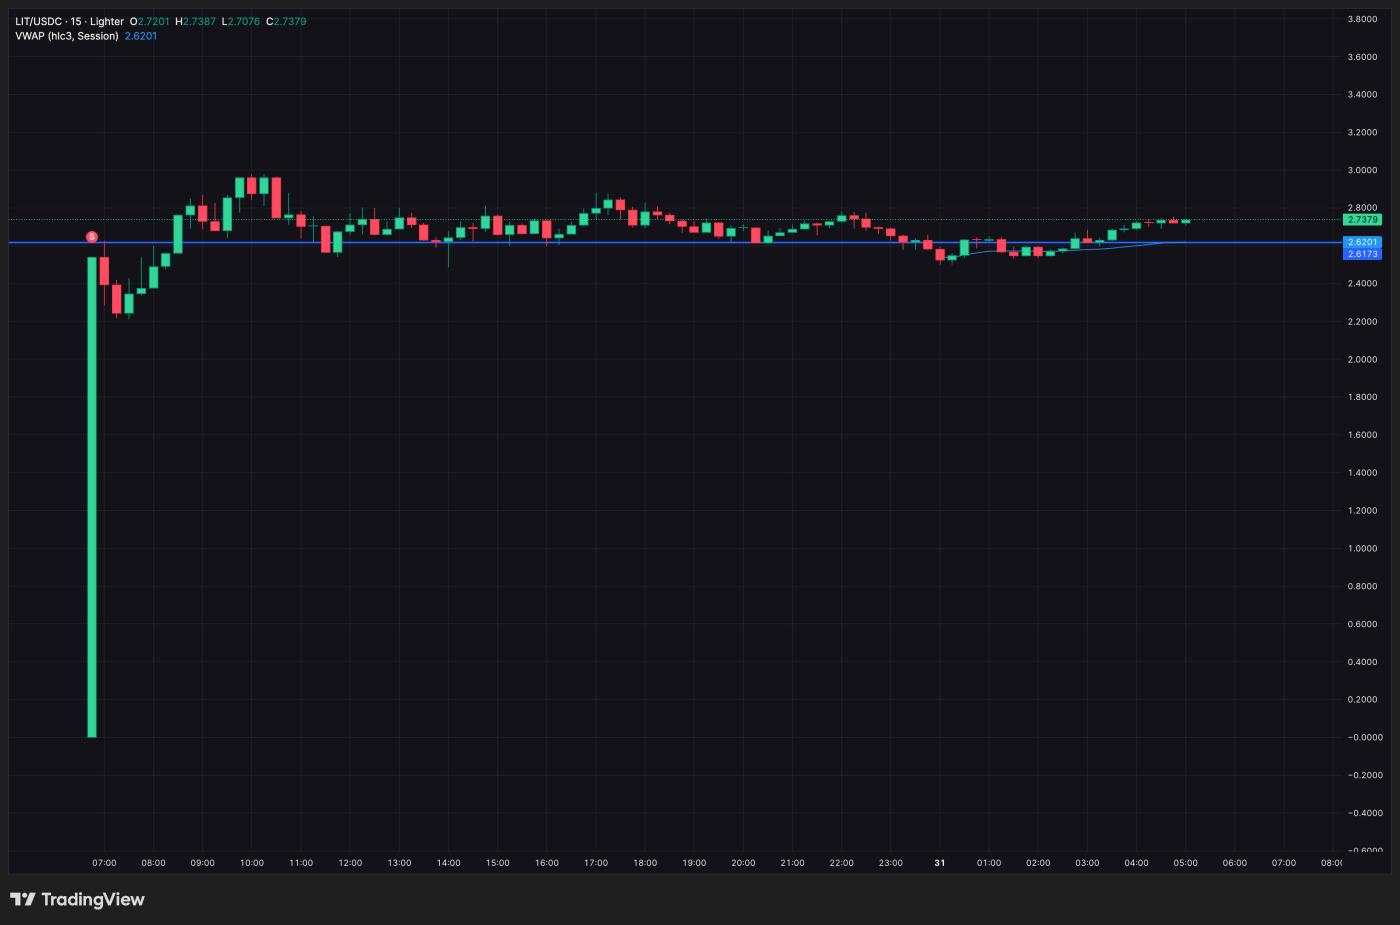
LIT is still trading above the VWAP (Volume-Based Price Medium ) line on the 15-minute chart. The VWAP represents fair value in real time, and holding above this level indicates that buyers are in control of the intraday trend. Each time the price retests the VWAP area around $2.62 (at the time of writing), there is buying support.
This indicates that low price levels are being heavily bought, as signaled in the MFI analysis.
 VWAP Vai a supporting role: Lighter.XYZ
However, there is still a lack of clear confirmation.
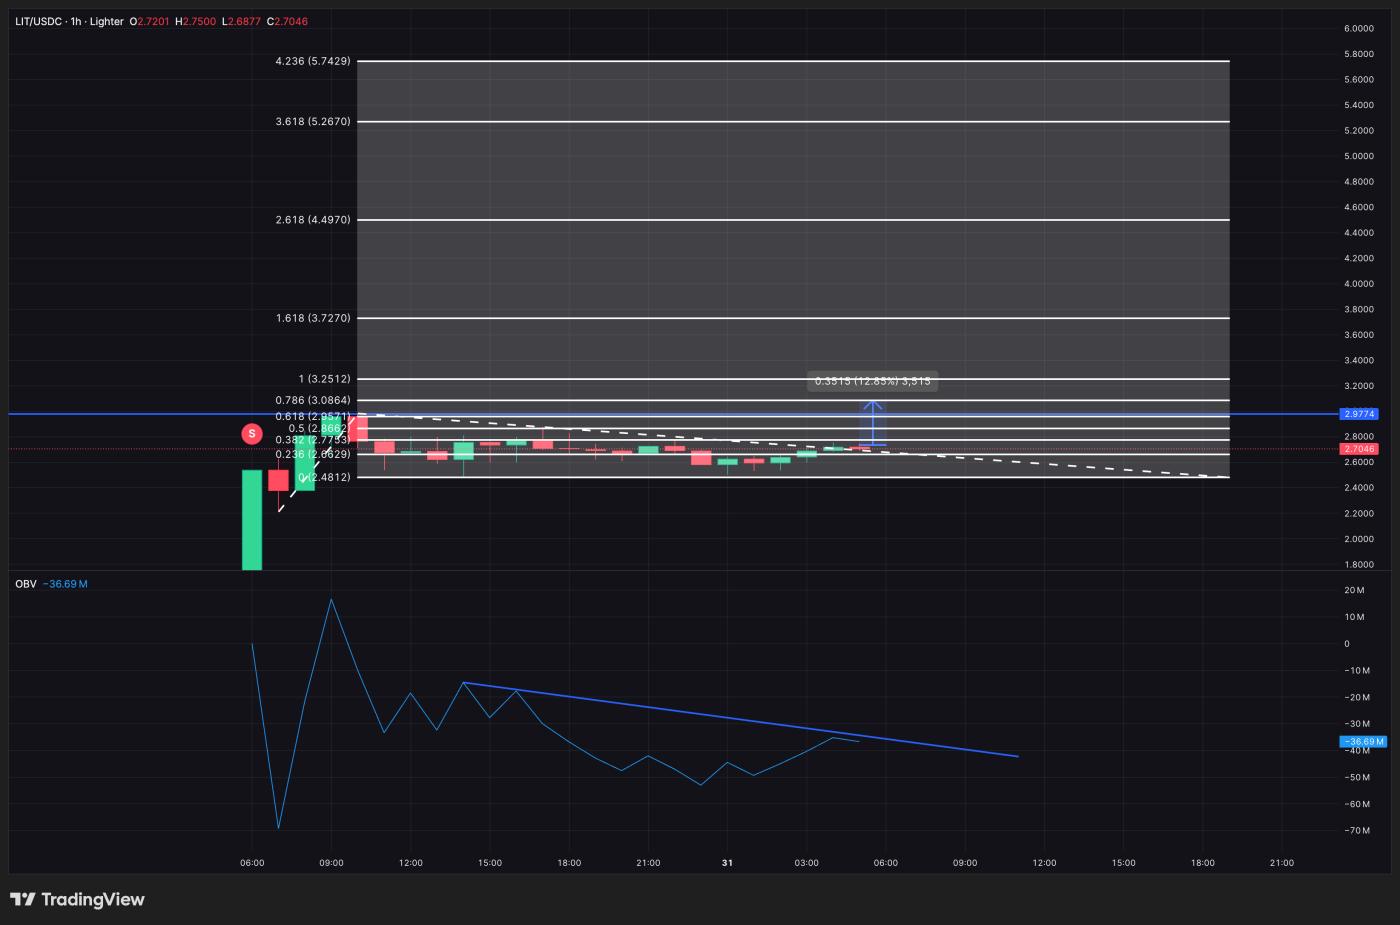
The On-Balance Volume (OBV) data on the 1-hour chart, which measures XEM volume moves in the same direction as price, remains below the downtrend line. This indicates inflow of money, but the actual buying pressure is not yet truly aggressive. Therefore, selling pressure from LIT is still limiting the potential for a price breakout.
Until the OBV breaks through the downtrend line, upward price movements are likely to stall before a strong trend is formed.
If the OBV breaks above the descending trend line while the price remains above the VWAP, the market structure will shift from a defensive to a more solid build. A breakout above $3.08 could indicate that investors are ready to challenge higher price levels.
 Confirmation needed from OBV: Lighter.XYZ
If it breaks through this zone, LIT's price could head towards further targets at $3.25 and even $3.72, coinciding with the Fibonacci extension levels above the nearest peak of $2.97 after listing.
The milder price levels determine the first real trend.
Currently, LIT is trading within a narrow decision zone, mainly fluctuating between $2.48 and $2.77. The price needs to hold above $2.62 on the shorter timeframe (VWAP line) and $2.48 on the longer timeframe to maintain the uptrend. If LIT breaks above $3.08 with confirmation from the OBV, the chart will shift from the initial support zone to an extensional trend, creating an opportunity for the price to advance to the $3.25–$3.72 range if volume increases.
If the $2.48 level is broken with the 1-hour candle closing below it, a bearish scenario will emerge. If CMF and MFI decline, and OBV still hasn't broken the trend line, the price structure will weaken. Then, if post-listing liquidation is drained under selling pressure, LIT could fall to $2.38 and $2.07.
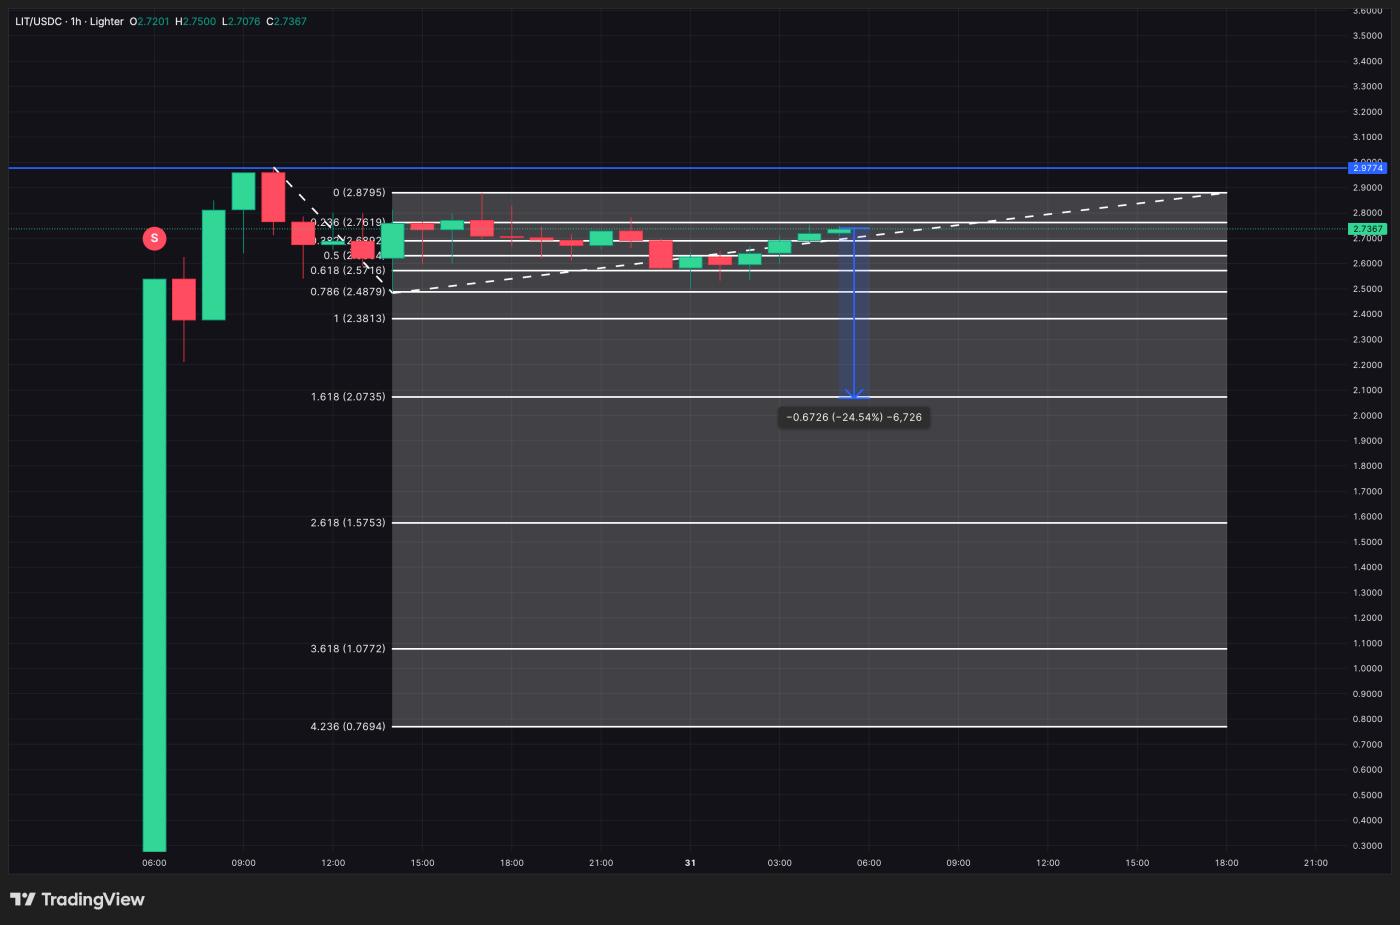 Lighter price analysis: Lighter.XYZ
At this point, buying pressure is still present but not yet dominant. The bullish scenario depends heavily on supporting indicators, and a clear breakout has not yet formed.


