

Ethereum ended 2025 around $2,970 after a volatile quarter. The market is currently Chia in opinion. Some experts predict a new growth cycle is about to begin. However, many others warn that the price structure remains unstable and confusing.
The truth likely lies somewhere between those two viewpoints. The chart shows downward pressure, an unstable seasonal price history, and on-chain cash flow that represents initial but not yet strong enough support.
The situation ahead of 2026 remains unclear. The question is: Is Ethereum poised for a recovery, or poised for another price drop?
The bearish price structure coincided with the start of historically high volatility.
On the 3-day chart, ETH is trading within an ascending channel that resembles a "bear flag." If the price breaks below this channel, a deeper decline will be triggered. If this scenario occurs, technical analysis forecasts a potential drop of approximately 44% from the breakout price.
Note: The risk of a downward breakout will be significantly reduced if Ethereum continues to trade within this channel for a longer period.
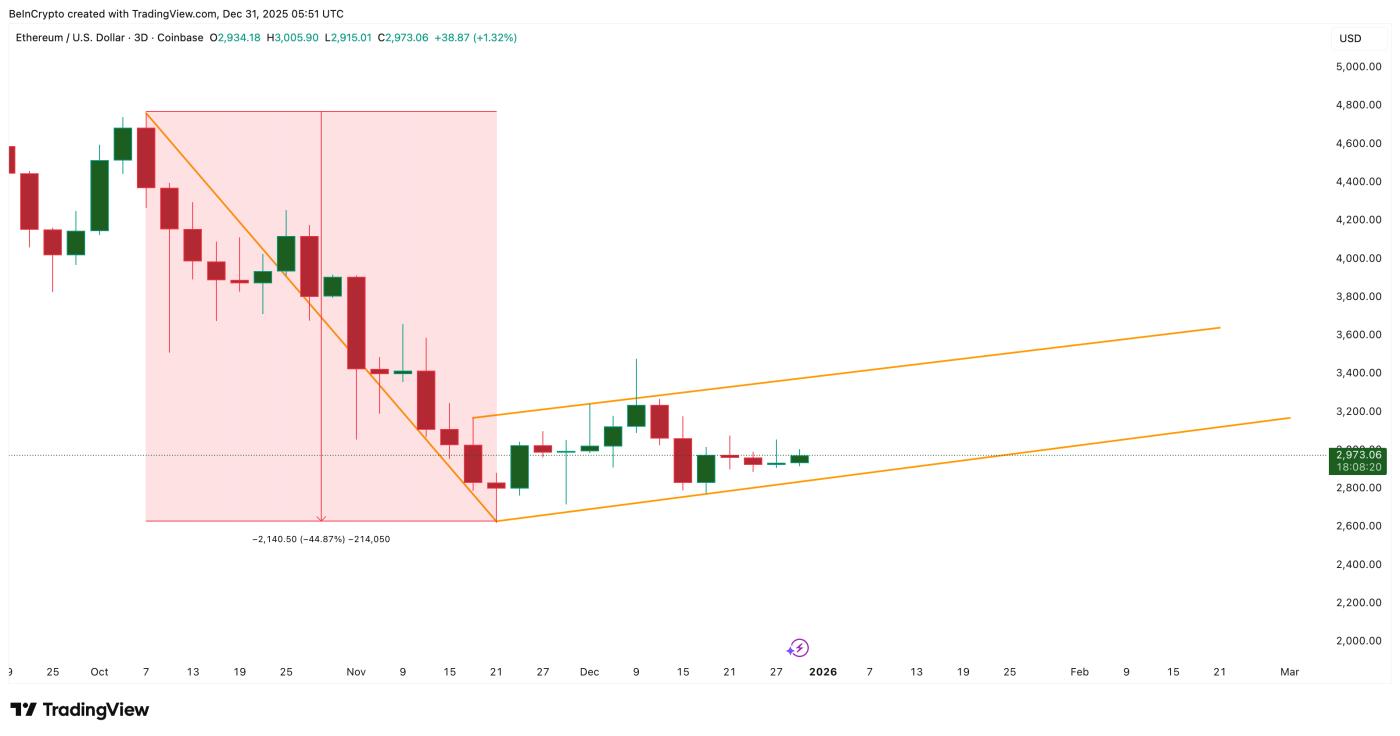 ETH 's bearish structure towards 2026 : TradingView
Want more Token analysis like this? Sign up for editor Harsh Notariya's daily Crypto newsletter here .
However, seasonal factors complicate the situation. January is typically a bullish month for Ethereum in the long term, with an Medium increase of around +33%, but this past January did not live up to expectations. January 2025 began with a decline followed by four consecutive months of losses. If the “bear flag” pattern is broken, the positive early-year trend that many were hoping for may not reappear.
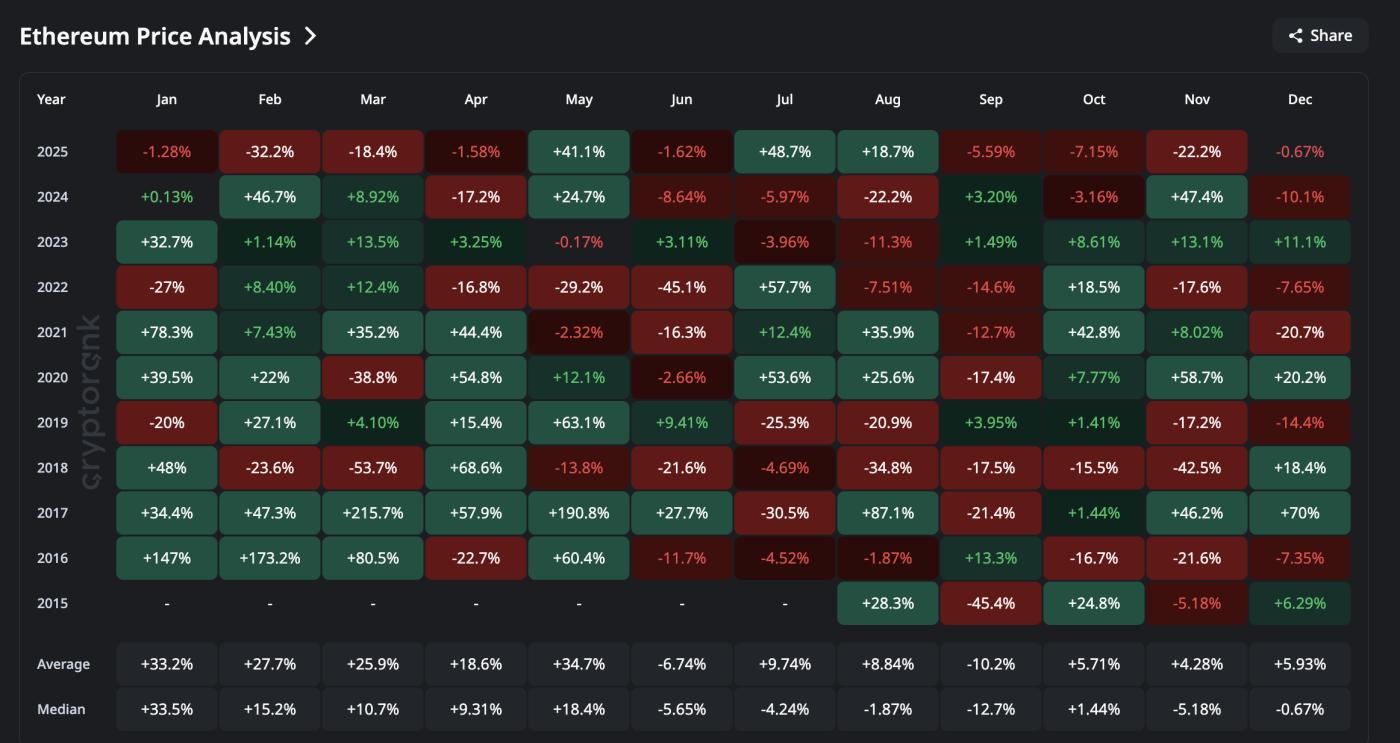 Ethereum Price Fluctuations: CryptoRank
The risk of a price drop, coupled with a period of historical volatility, doesn't align with optimistic predictions that Ethereum could reach between $7,000 and $9,000 by 2026. At least not yet.
These signs of weakness also align with what Ryan Lee, chief analyst at Bitget, Chia with BeInCrypto when asked about his prediction of a $9,000 price by 2026:
" Capital needs to stop flowing out of Ethereum, real demand needs to increase beyond current testing, and the supply needs to be locked in for a longer period," he added.
He also added that current conditions are not yet sufficient to expect a breakout in ETH price:
"We believe the current picture is quite confusing," he emphasized.
Thus, the chart shows the risks. Seasonal factors indicate instability. Expert opinion suggests that a recovery will occur, but it will be slow and dependent on many external factors. Positive signals have emerged on-chain, but they are still quite weak.
on-chain flows show promising signs, but there is no certainty yet.
Some on-chain signals suggest that a sharp decline may not be entirely possible.
Long-term investors have started buying again. The Hodler Net Position Change (which tracks long-term investor inflows and outflows) turned positive on December 26, 2024, after months of negative growth since July 2024, and has remained positive for several consecutive days. This indicates patient Capital has acted at lower prices, but remains cautious.
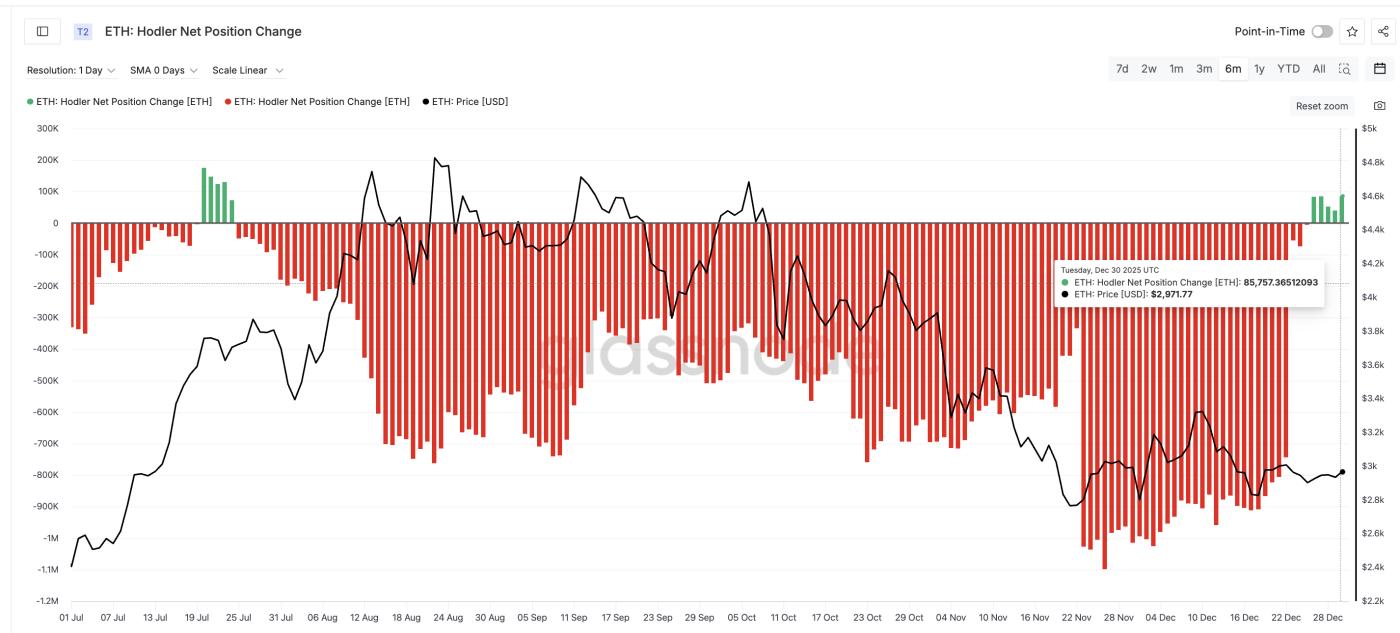 Hodlers are back buying: Glassnode
With Ethereum's Staking queue currently exceeding the withdrawal volume , there's a high possibility these buy orders will be locked in Staking . This is also something Ryan Lee previously mentioned as a necessary condition to drive ETH price higher.
Ryan also clarified:
“There are over 740,000 ETH waiting to be Staking, while only about half that amount is waiting to be withdrawn. Currently, nearly 30% of the total ETH supply is being Staking,” he emphasized.
This indicates accumulation and an intention to lock in supply, but the scale is still not large enough to create a trend reversal. This action mainly reflects interest rather than trend-leading behavior.
Whales have also returned to the market. After dropping to around 100.01 million ETH held off-exchange at the end of November 2024, this ETH has increased again to 101.21 million ETH on December 31, 2024. This accumulated value is equivalent to $3.6 billion, a very significant figure. However, this number has not yet surpassed the peak of 101.90 million ETH reached in early November 2024. Until this peak is broken, the whales' accumulation will only serve as support, not enough to reverse the market.
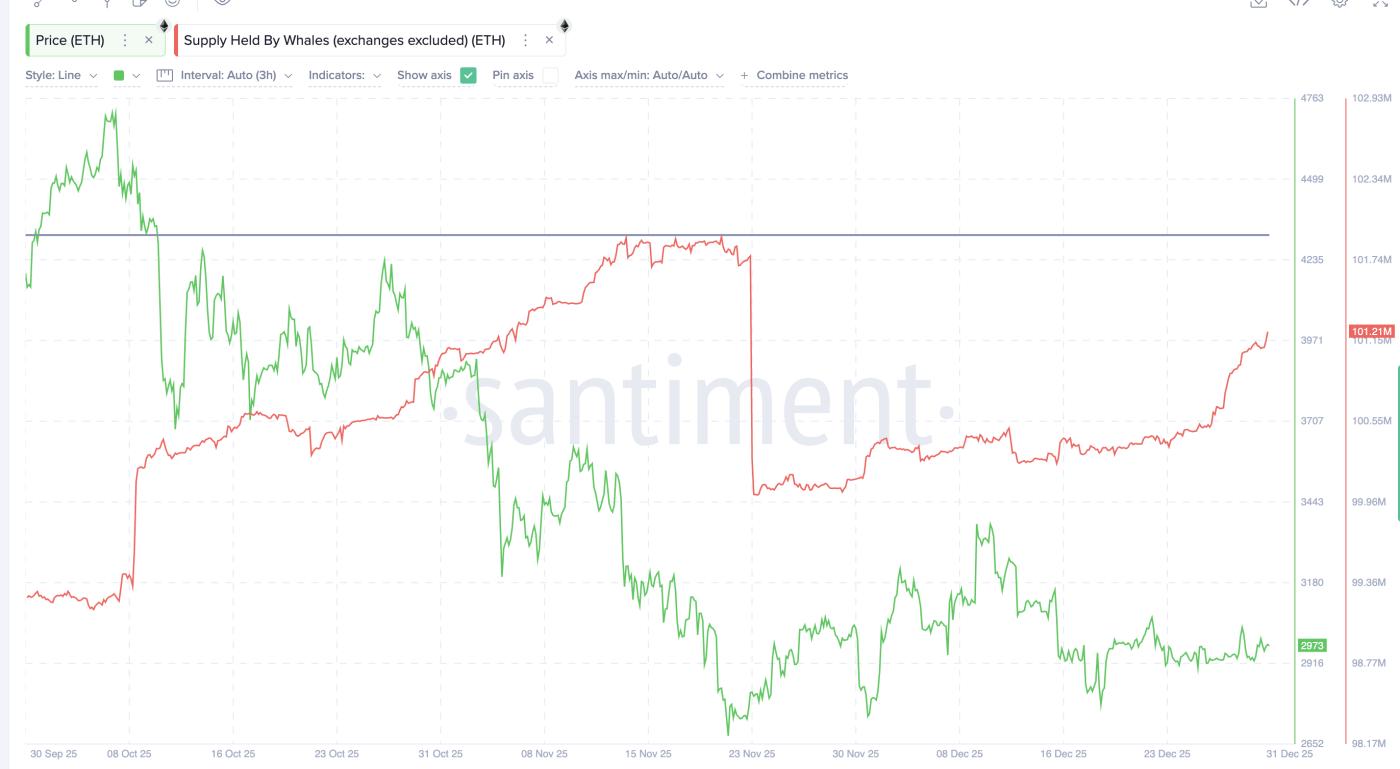 Whales Adding: Santiment
ETF Capital remain the biggest weakness to the bullish argument. Spot ETH ETFs recorded outflows of approximately $1.97 billion as both November and December ended negatively.
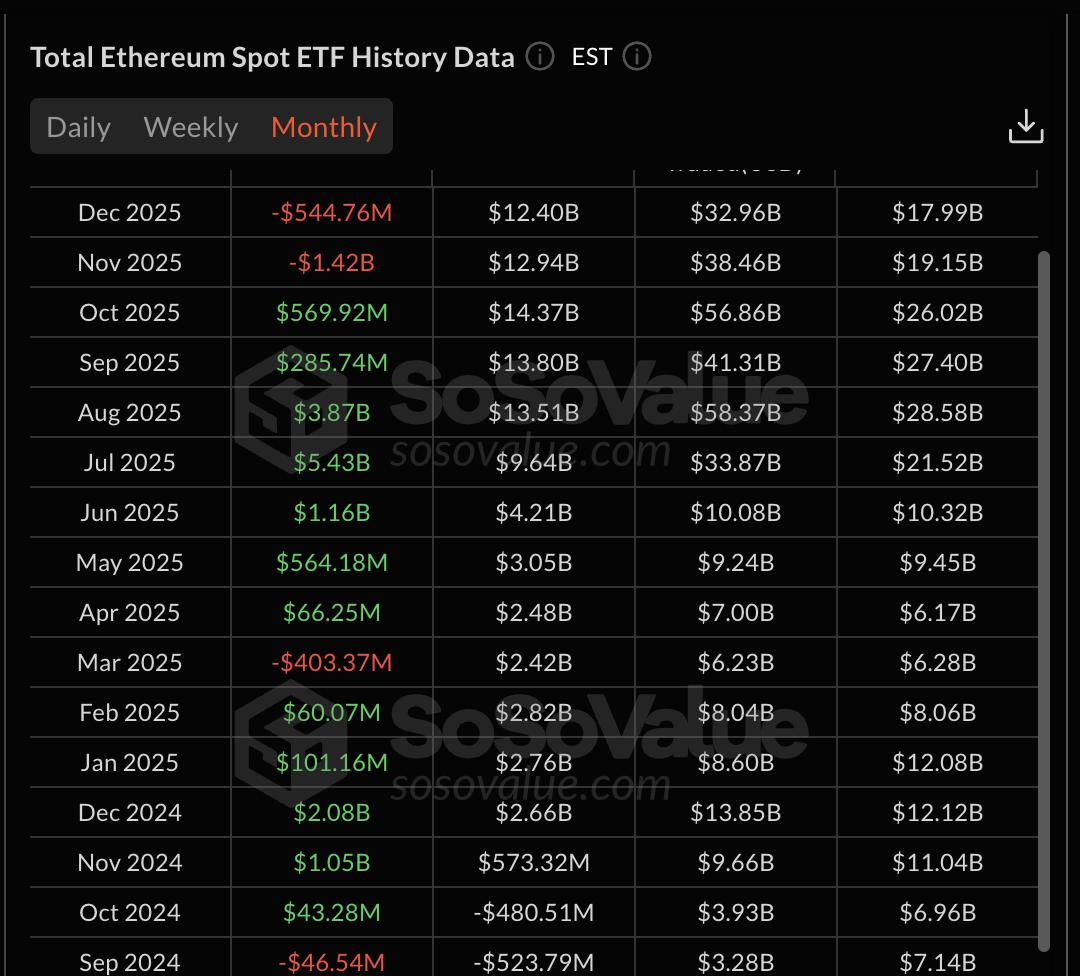 Weak ETF Flows: SoSo Value
Ryan stated very clearly that ETFs are becoming a major barrier to price volatility:
"Currently, large amounts of Capital are being withdrawn from the ecosystem. This is limiting the potential for price increases."
Therefore, while on-chain data has improved, it still lacks certainty. It seems the market is in an early Dip phase rather than showing signs of a trend reversal.
The 2026 roadmap depends on key price milestones for Ethereum.
This is the connecting point between technical charts and Ryan's analysis.
ETH needs to hold above $2,760 to maintain the flag pattern structure. Losing this level would weaken the structure, and the next support levels at $2,650 and $2,400 would become vulnerable. A further drop to $2,140 and $1,780 would likely result in a breakout, confirming a downtrend. If the bearish flag pattern fully materializes, ETH could fall to around $1,320, representing a 44% correction from the initial breakout point.
For a bullish reversal to occur, ETH price needs to break above $3,470 to test the upper resistance zone. A rise above $3,670 would reverse the trend structure. However, a true breakout would only happen if ETH reclaimed $4,770 – the starting point of the flag pattern and a price level that could reverse the entire uptrend.
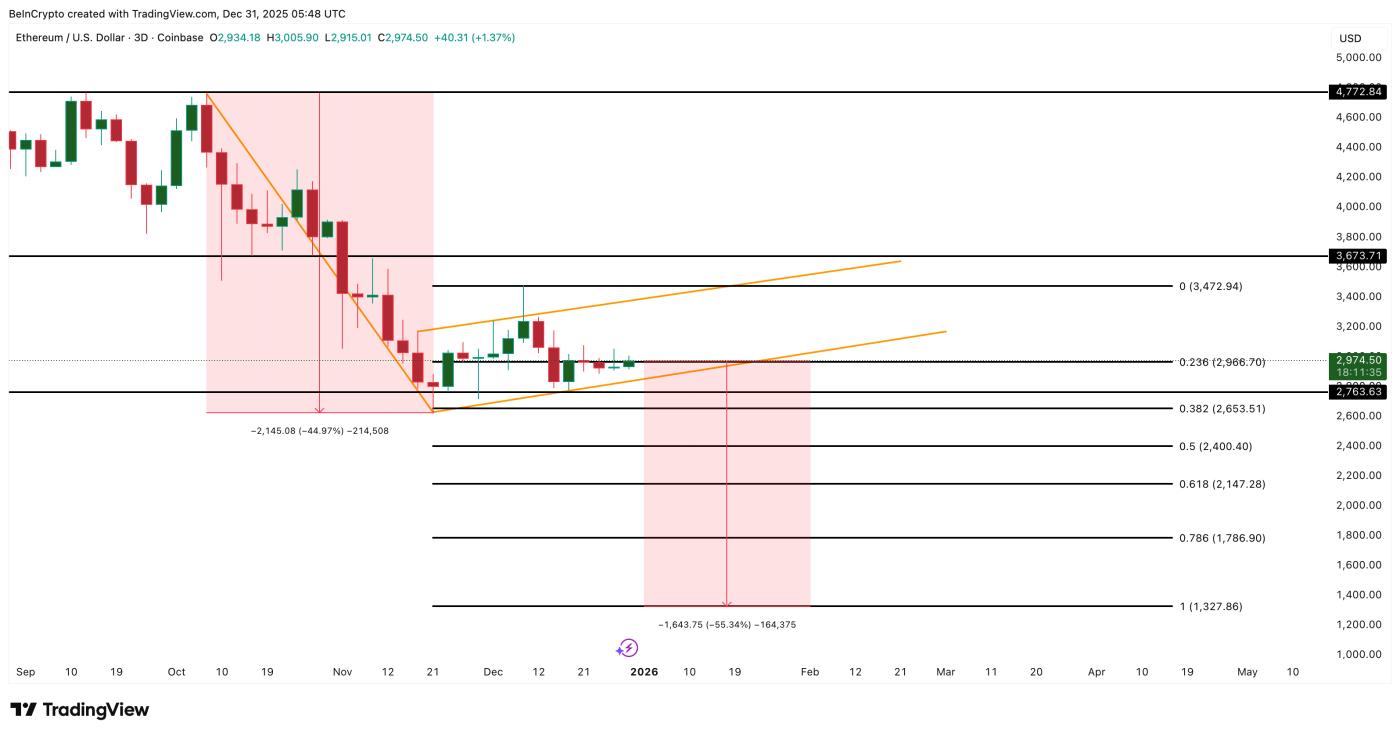 Ethereum Price Analysis: TradingView
Only when the price of ETH breaks through this zone will the $7,000 to $9,000 target become structurally sound. Even then, Ryan still maintains that the price increase is only conditional – not certain:
"So our basic scenario is that ETH will recover, but it will be a gradual recovery, based on market conditions. The price may rise, but it will mostly be a gradual increase," he Chia .
Ryan also explained that if loose macroeconomic policies (expected interest rate cuts) lead to better money flows, who will be the first to lead the market?
“Bitcoin is likely to react first. Ethereum will follow, as Staking takes center stage, Tokenize asset volume increases, and ETF inflows stabilize,” he said.
If market liquidation improves in 2026, Bitcoin could be the leading coin. Ethereum's price only surged when ETF Capital stopped, whale supply surpassed its November peak, and Staking demand continued to rise thanks to a growing number of long-term investors.
Prior to these conditions occurring simultaneously, the ETH price trend remained neutral or leaned toward a bearish outlook.


