

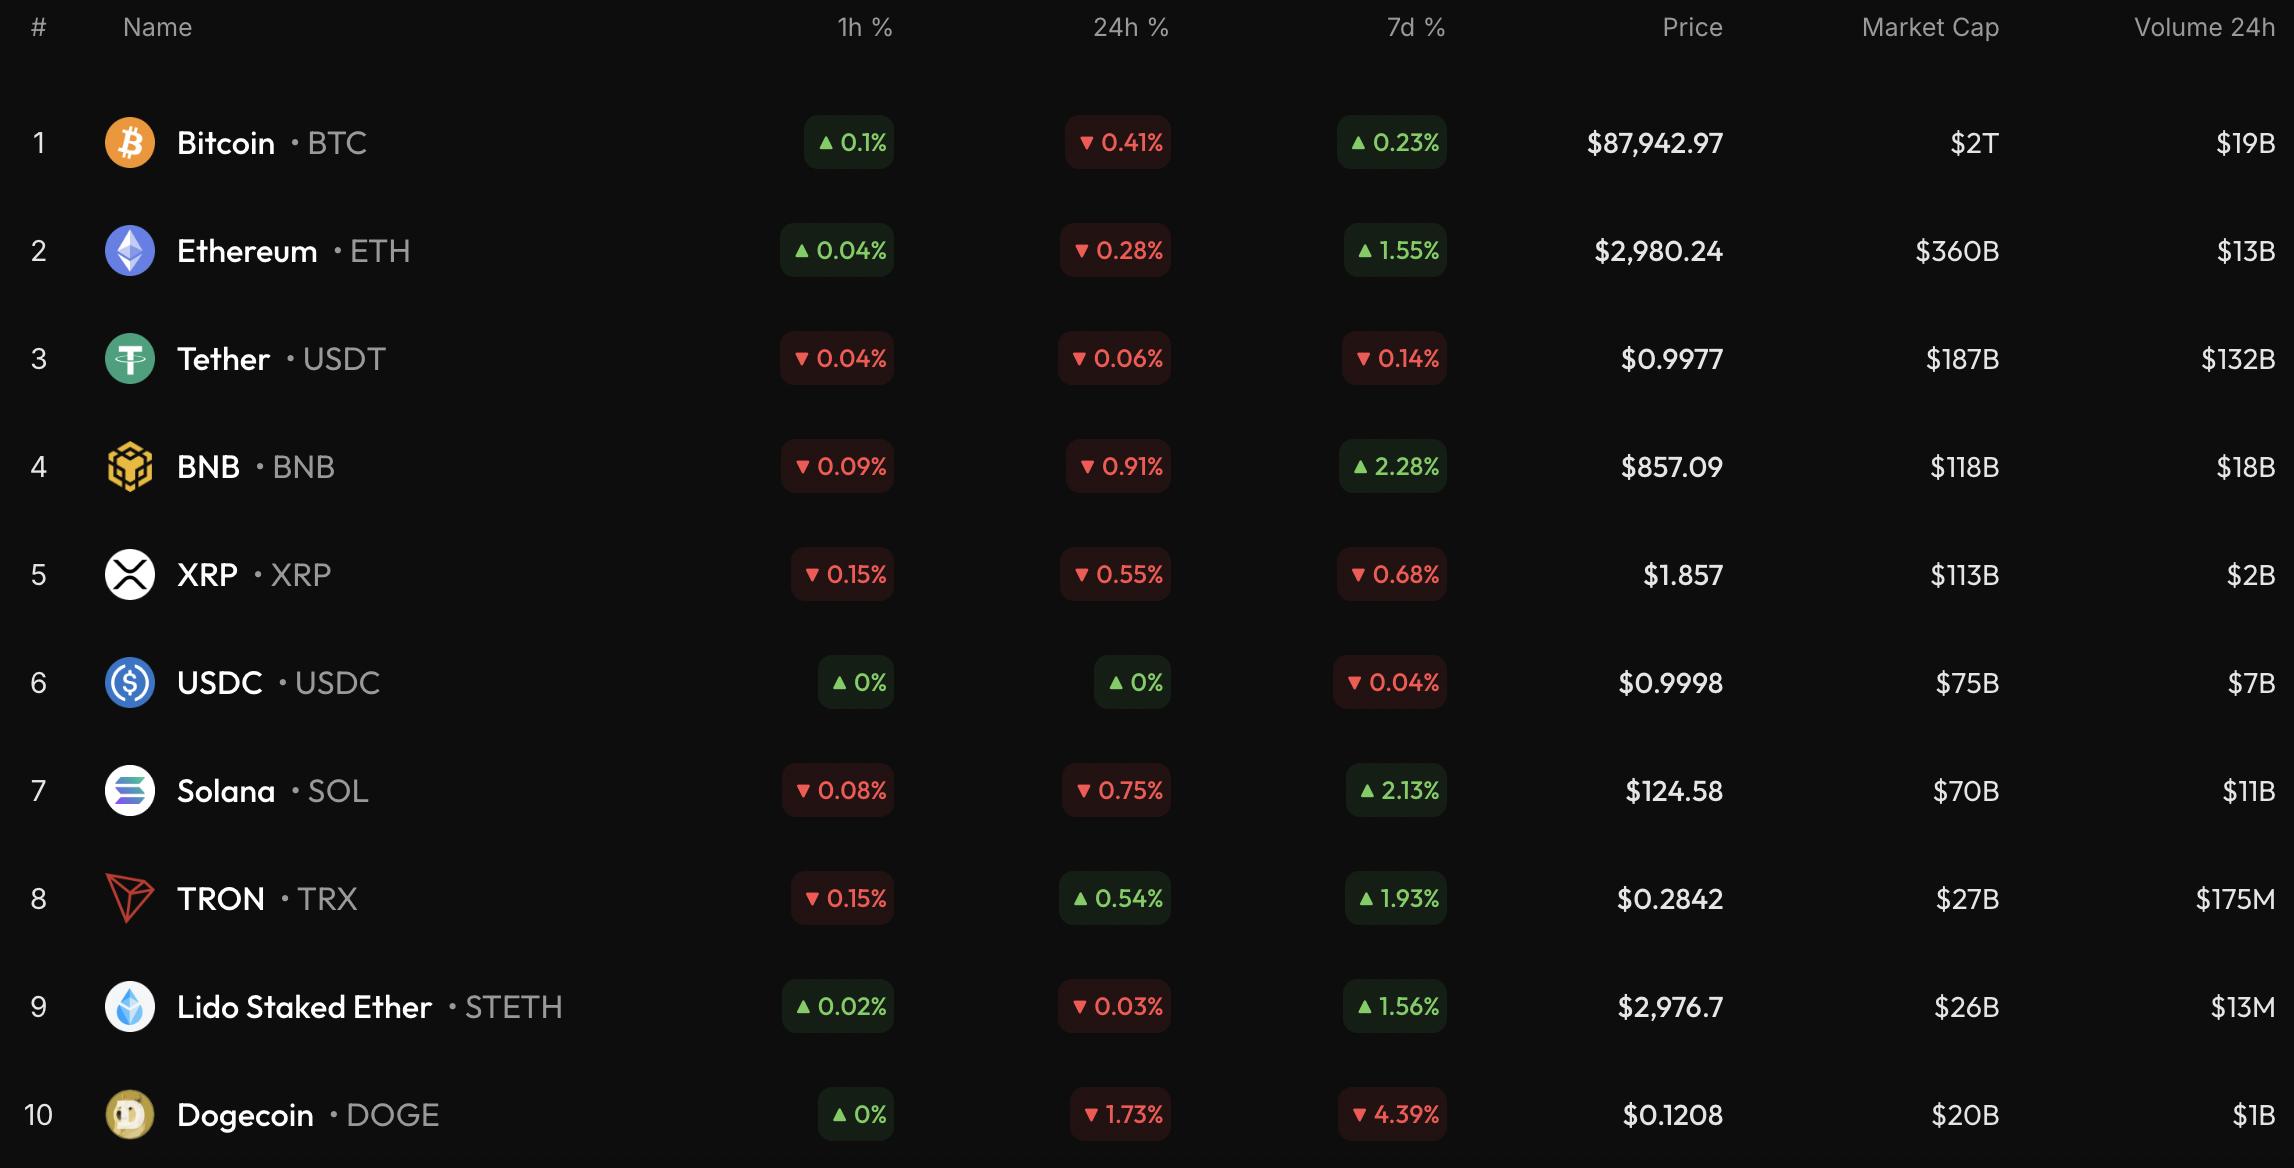
The market is mainly falling on the first day of the new year, according to CoinStats.
BTC/USD
The price of Bitcoin (BTC) has declined by 0.41% over the last 24 hours.
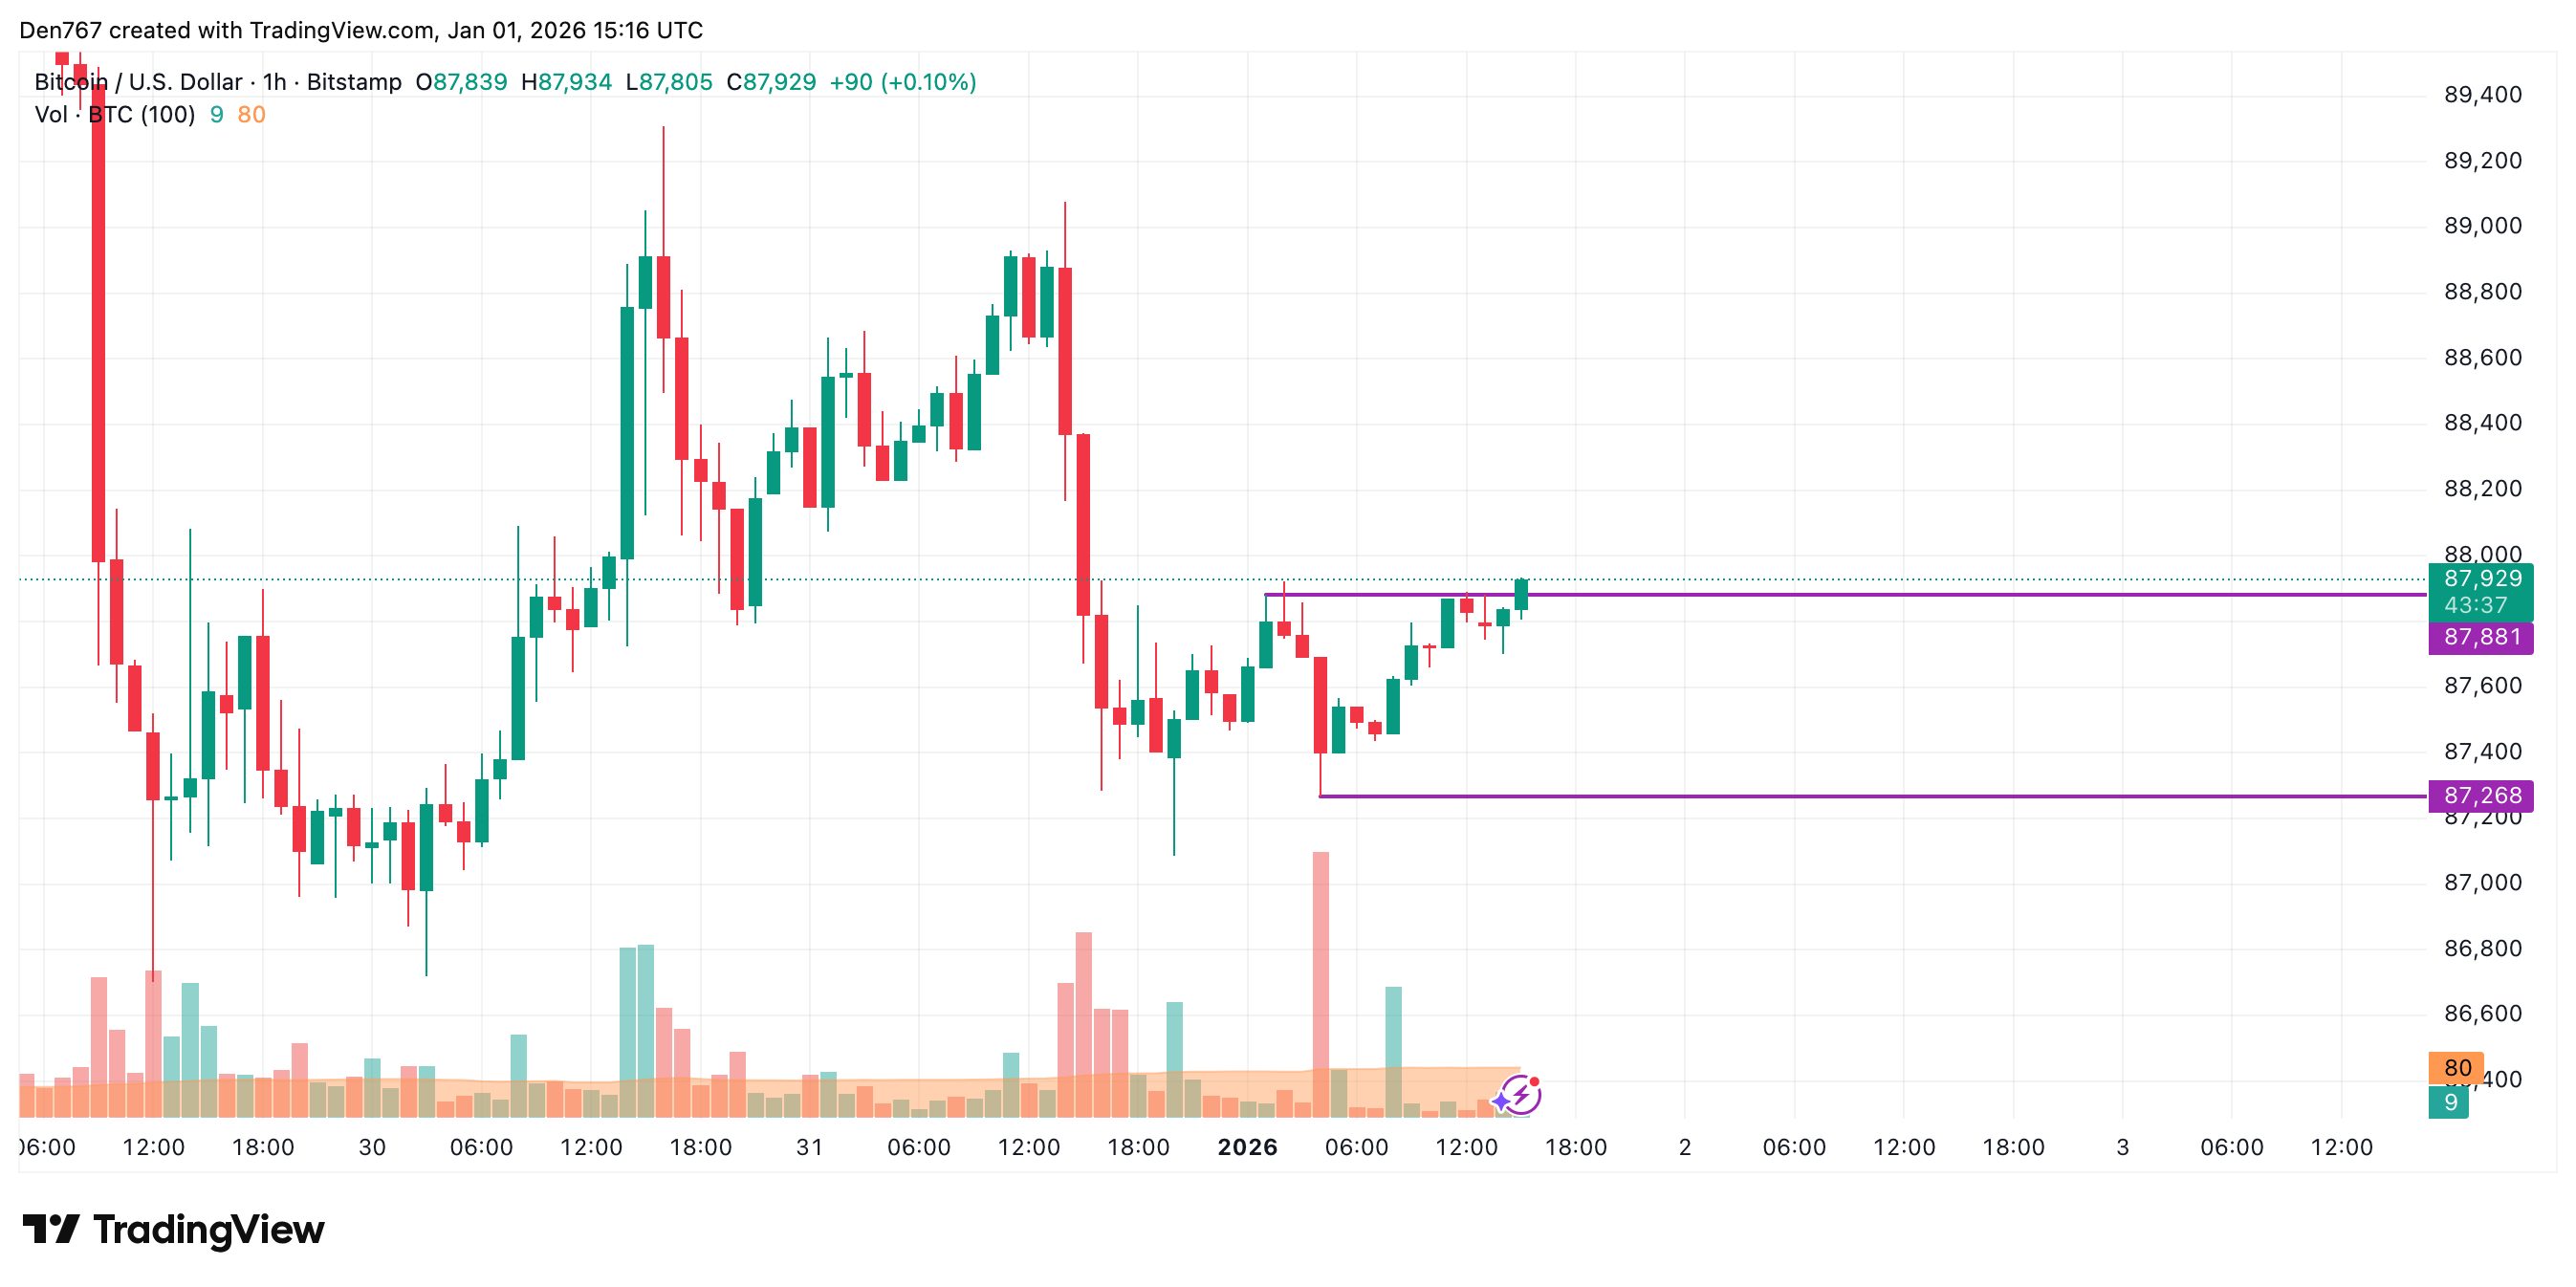
On the hourly chart, the rate of BTC is breaking the local resistance of $87,881. If buyers can hold the initiative and keep the price above that mark, the growth is likely to continue to the $88,500 area.
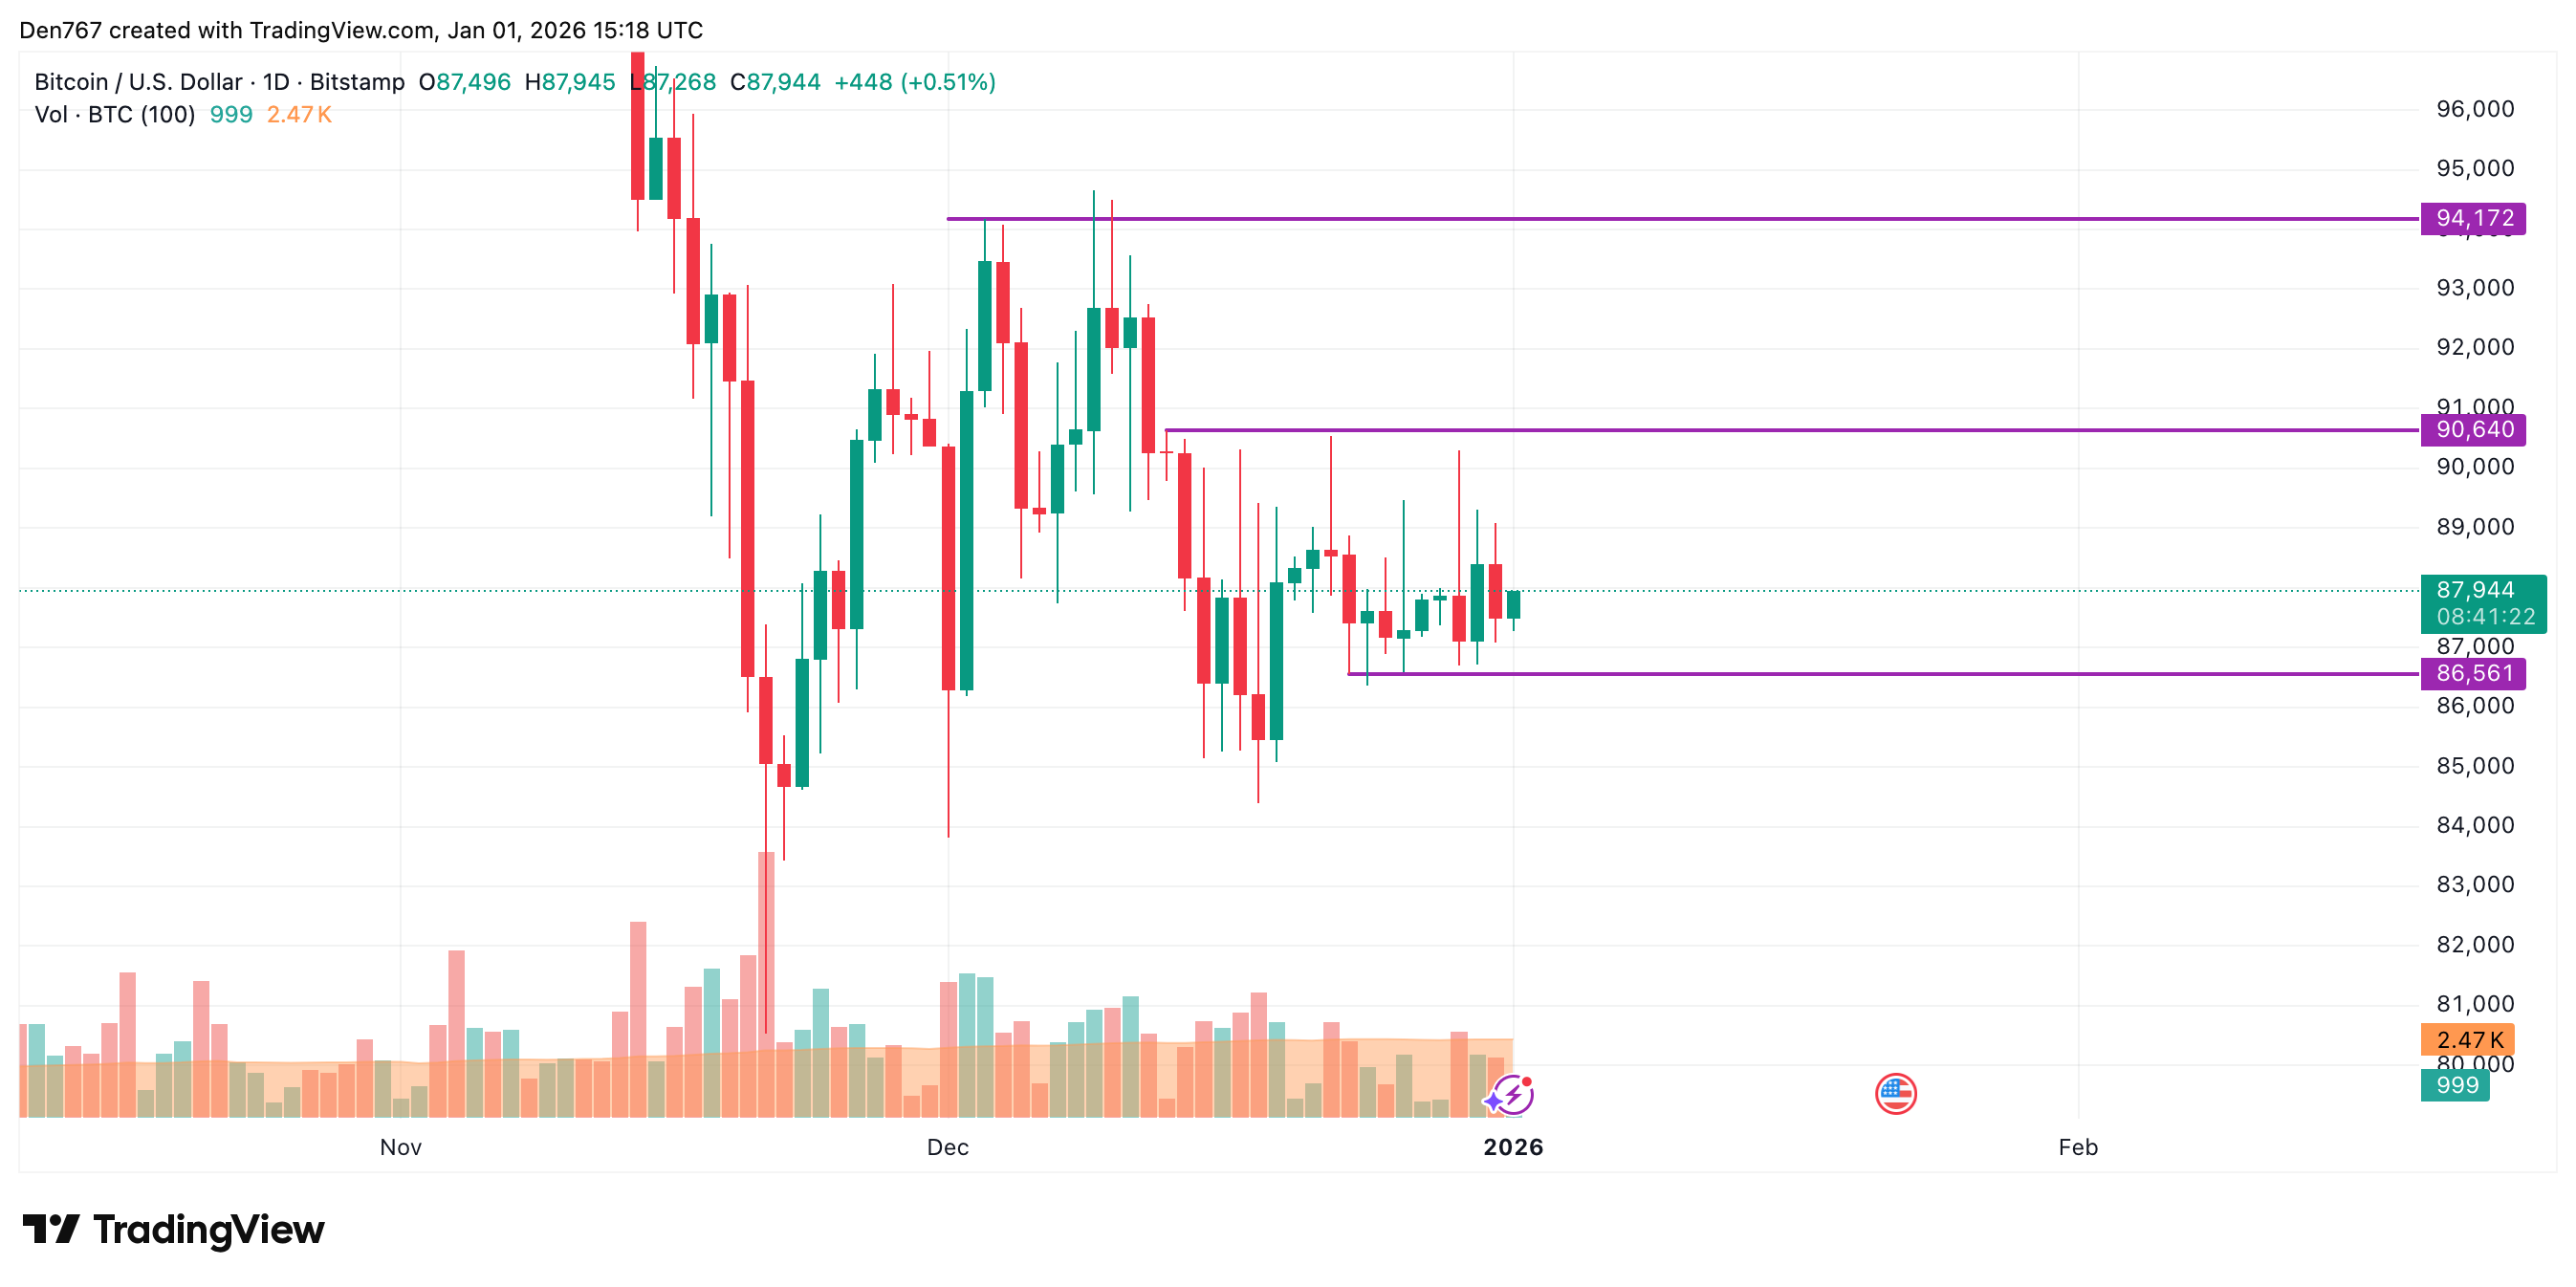
On the bigger time frame, the picture is less bullish. The price of the main crypto has not bounced off far from the support at $86,561.
The volume is also low, which means traders might not see sharp ups or downs by the end of the week.
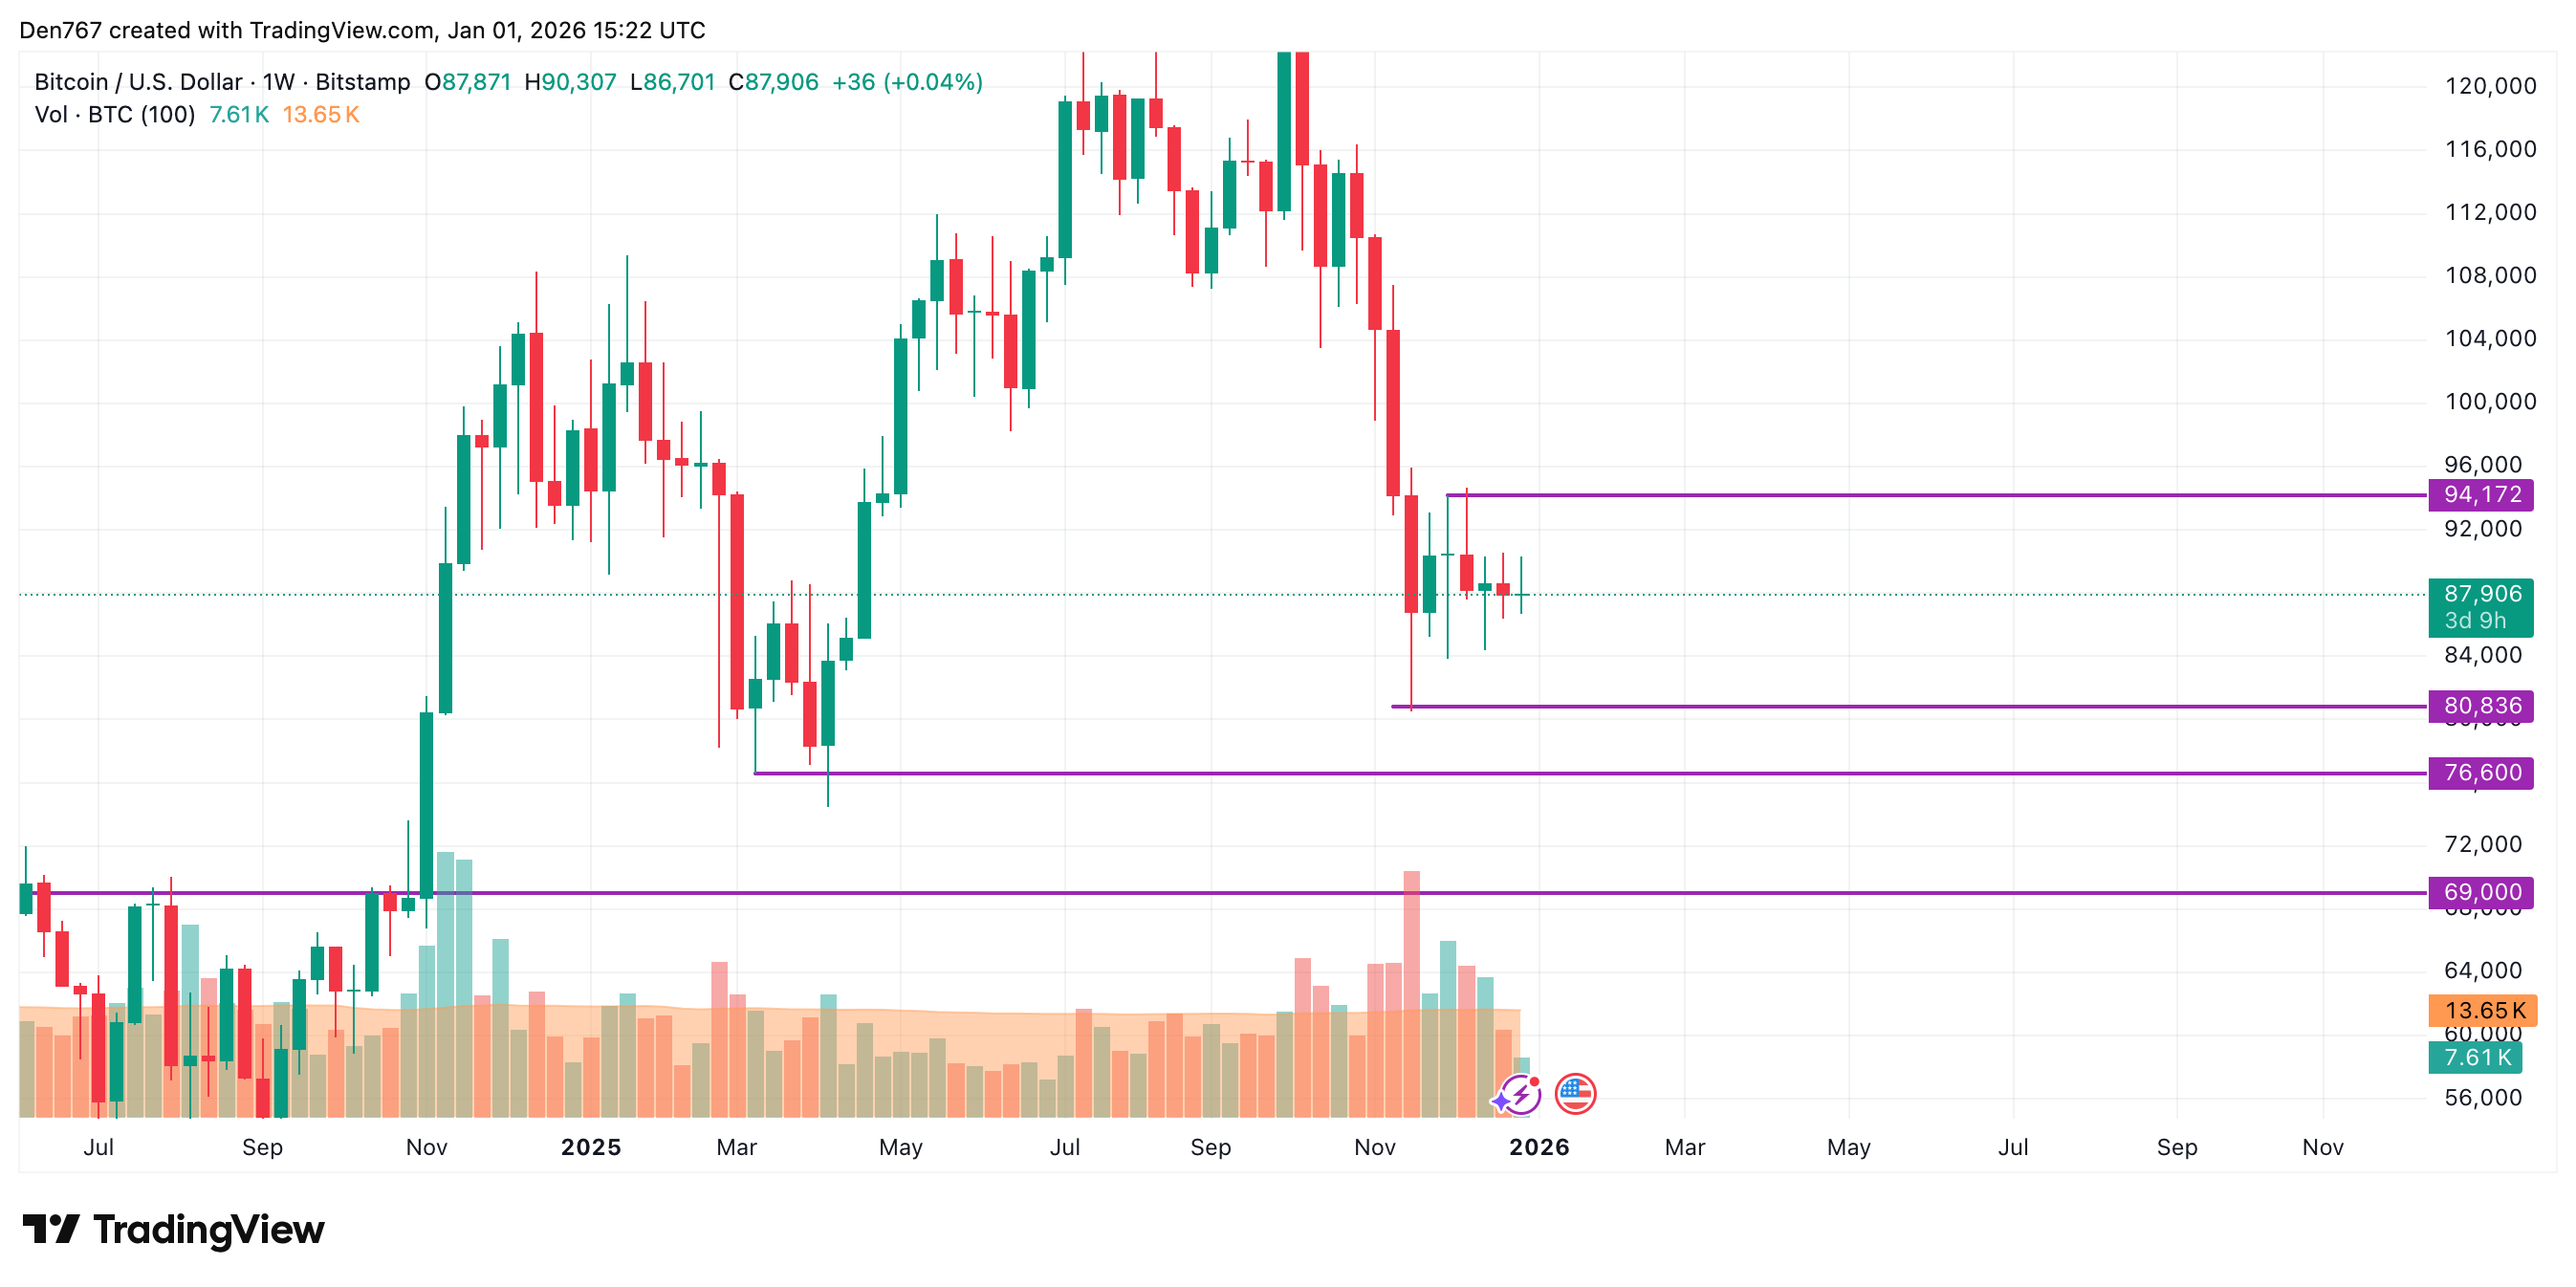
From the midterm point of view, the situation is neutral. The rate of BTC is in the middle of the wide channel between the support at $80,836 and the resistance at $94,172. As neither side is dominating, consolidation in the area of $85,000-$90,000 is the more likely scenario.
Bitcoin is trading at $87,906 at press time.


