

The decline has not lasted long, and the top 10 coins are again in the green zone, according to CoinStats.
BTC/USD
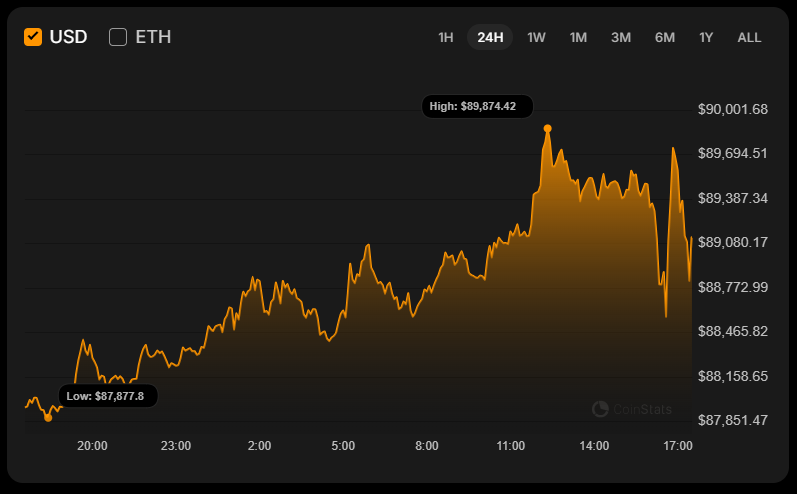
The rate of Bitcoin (BTC) has risen by 1.70% since yesterday.
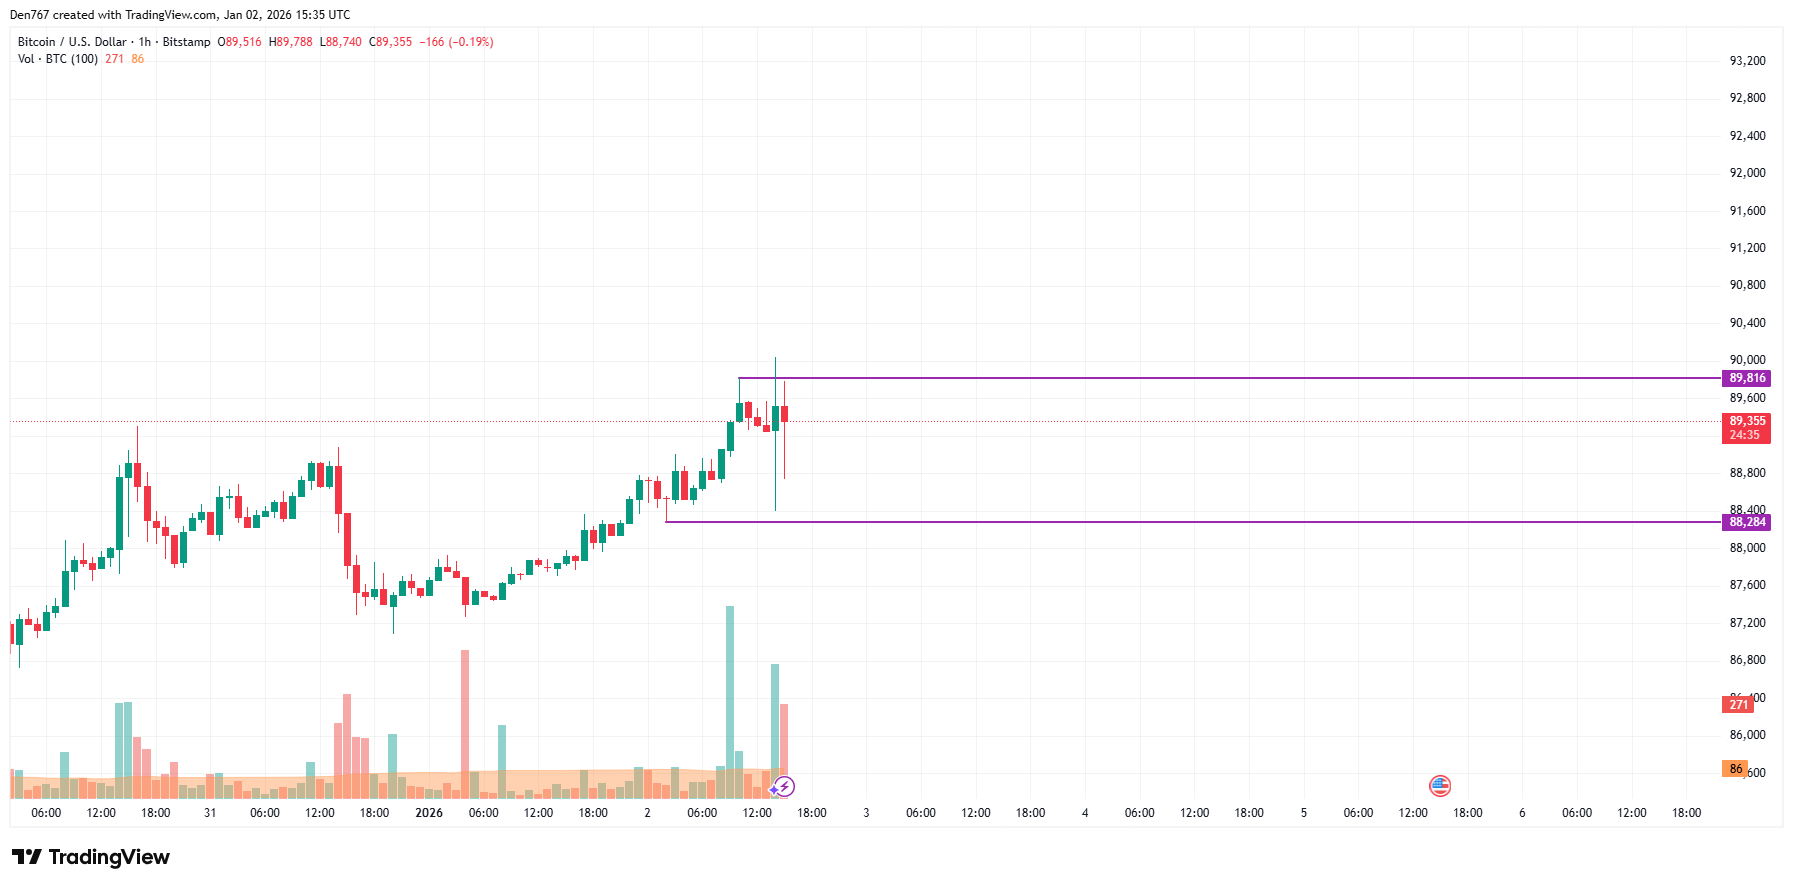
On the hourly chart, the price of BTC has made a false breakout of the formed resistance at $89,816. As most of the daily ATR has been passed, there are low chances to see sharp moves by tomorrow.
However, if the candle closes near the aforementioned mark, the growth may lead to a test of the $90,000-$91,000 zone.
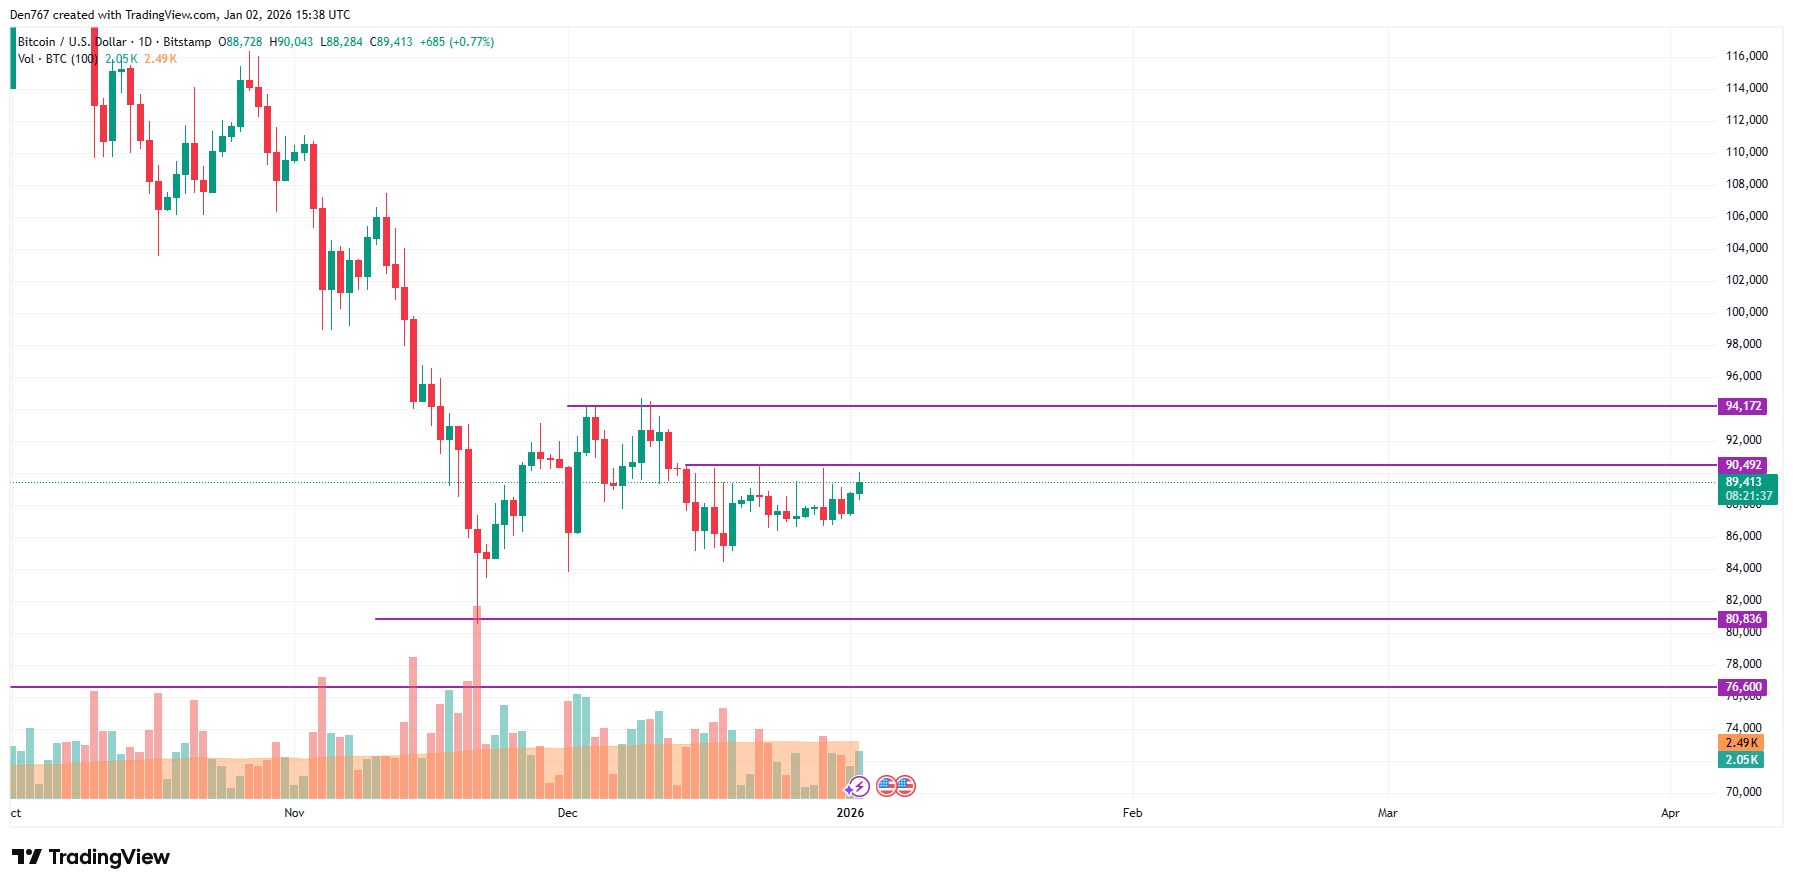
On the bigger time frame, one should pay attention to the nearest level at $90,492. If a breakout happens, the accumulated energy might be enough for a further upward move to the $94,000 area. Such a scenario is relevant until the end of the month.
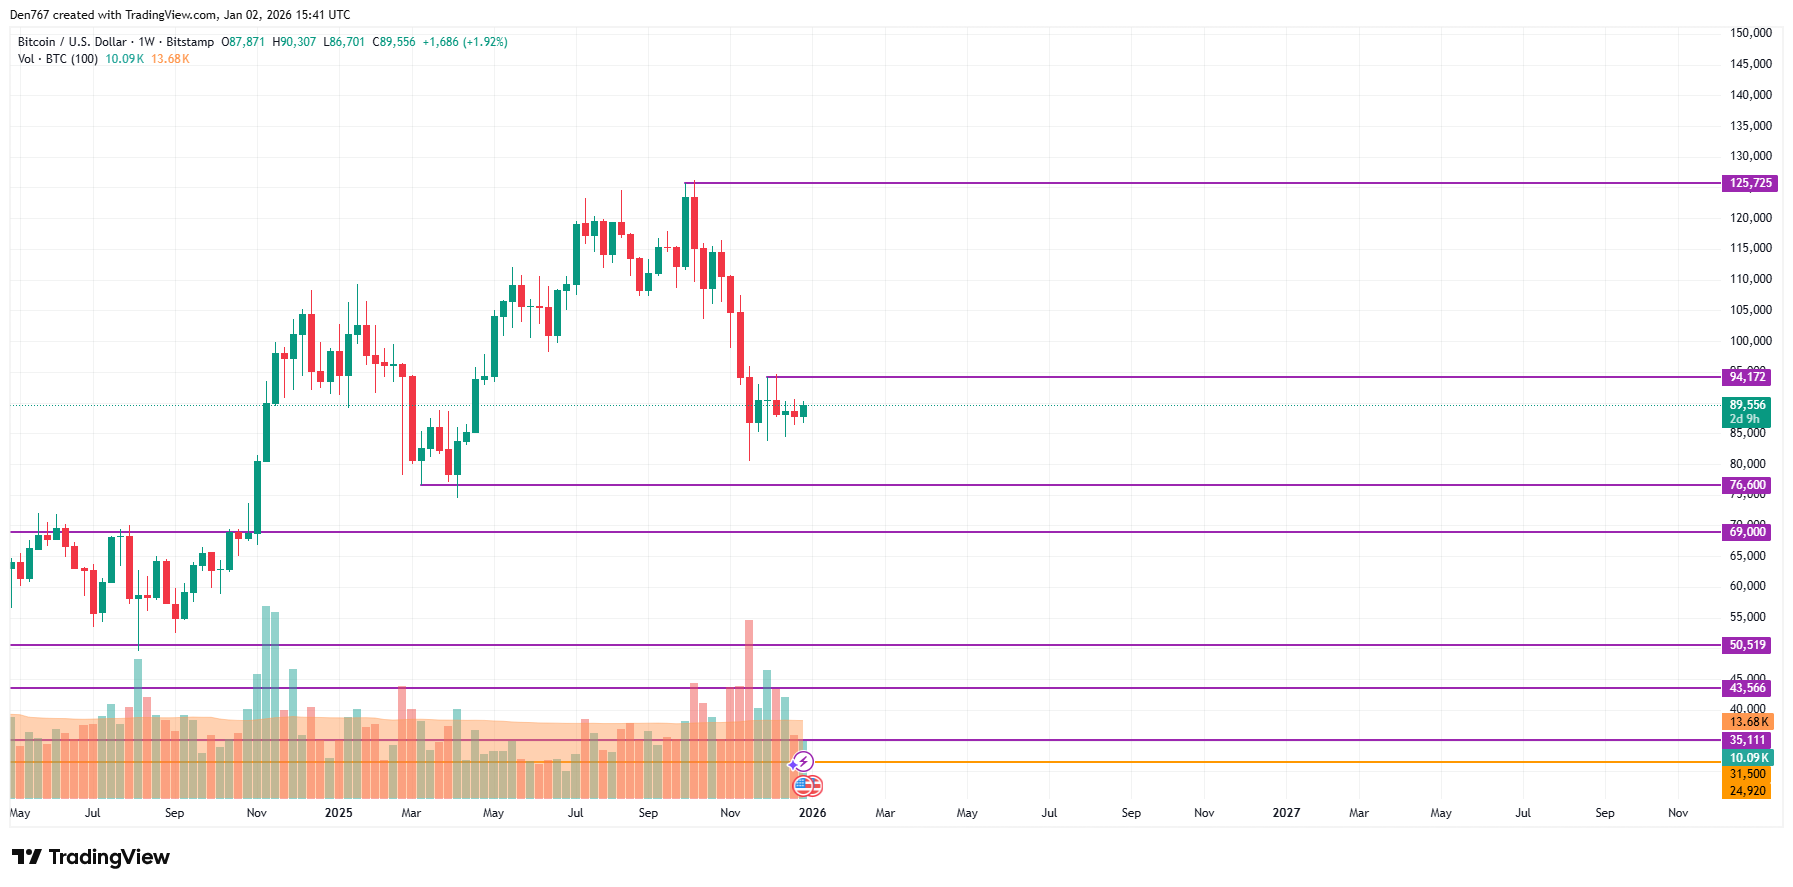
From the midterm point of view, neither side is dominating as the rate of the main crypto is far from the key levels. The volume is also low, which means sideways trading around the current prices is the more likely option for BTC.
Bitcoin is trading at $89,616 at press time.


