

Most of the cryptocurrencies are going up at the end of the weekend, according to CoinStats.
BTC/USD
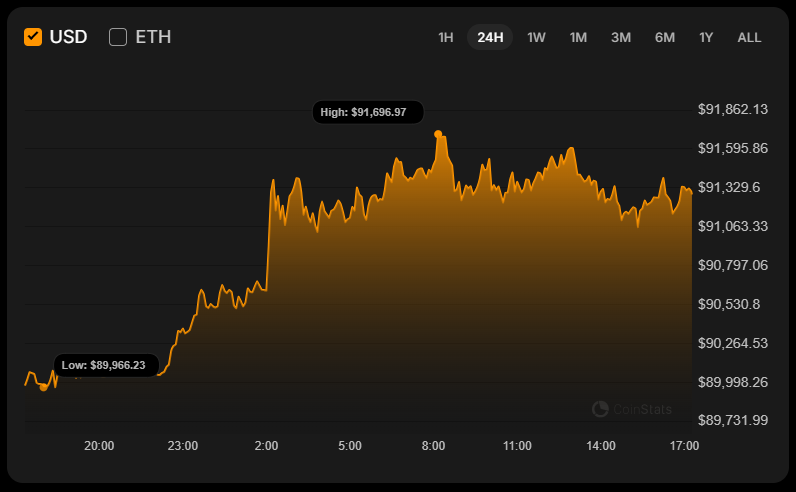
The rate of Bitcoin (BTC) has gone up by 1.45% since yesterday.
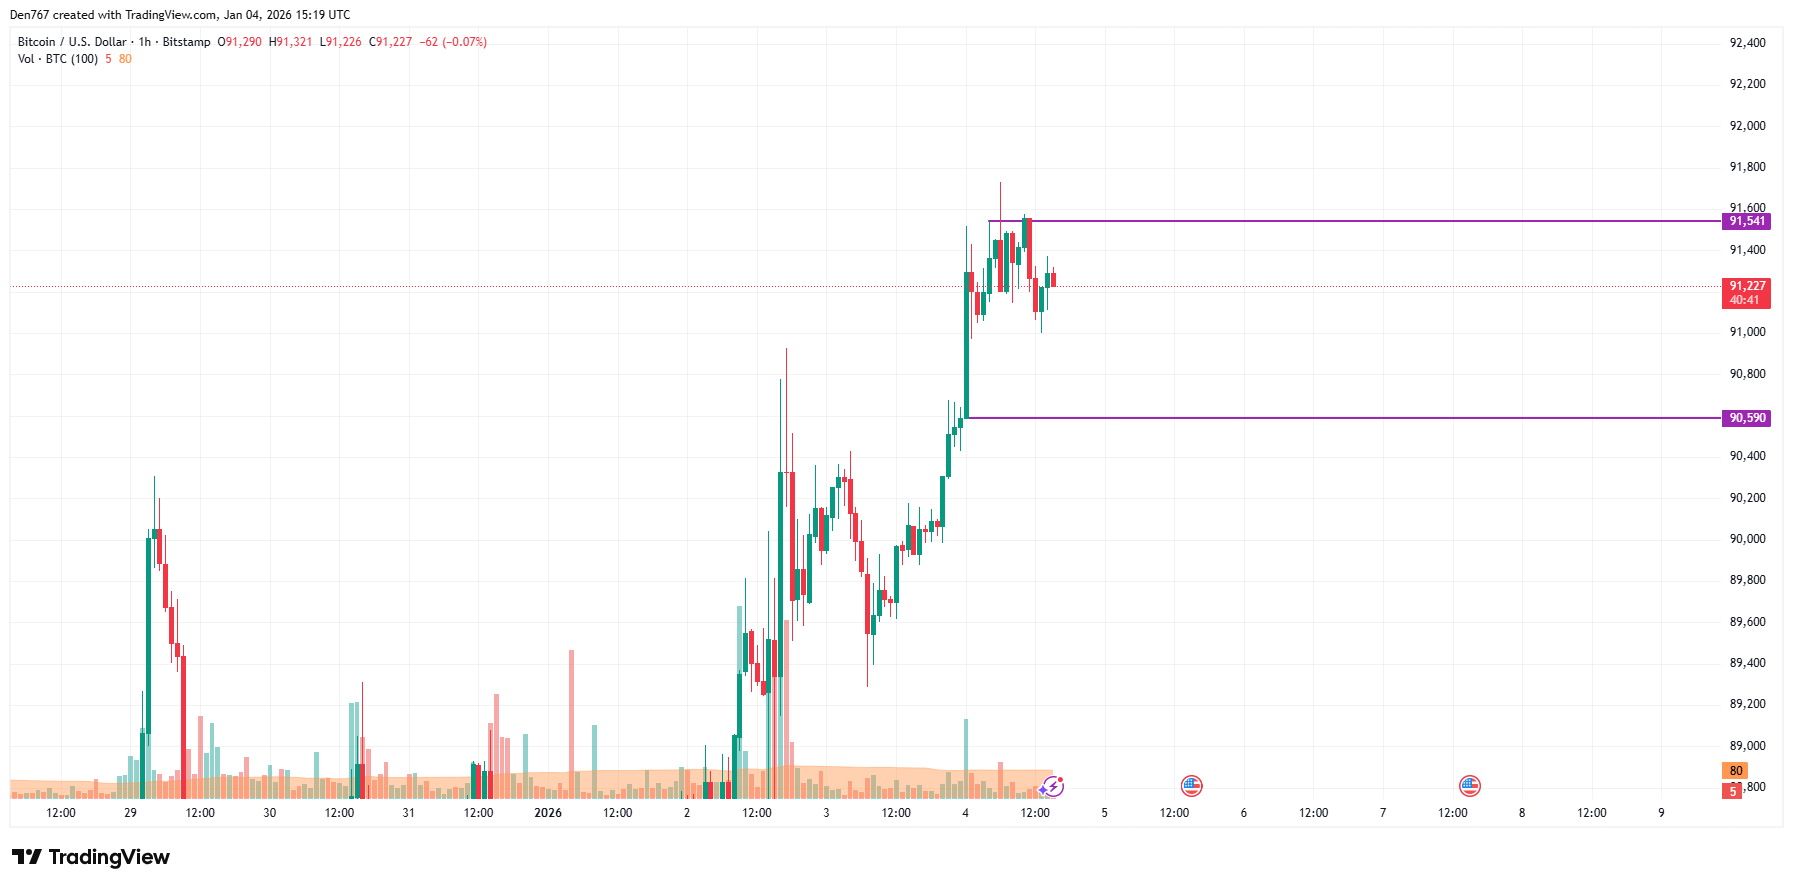
On the hourly chart, the price of BTC has made a false breakout of the local resistance at $91,541. However, if a correction does not happen and bulls can hold the initiative, traders may see a test of the $92,000 zone soon.
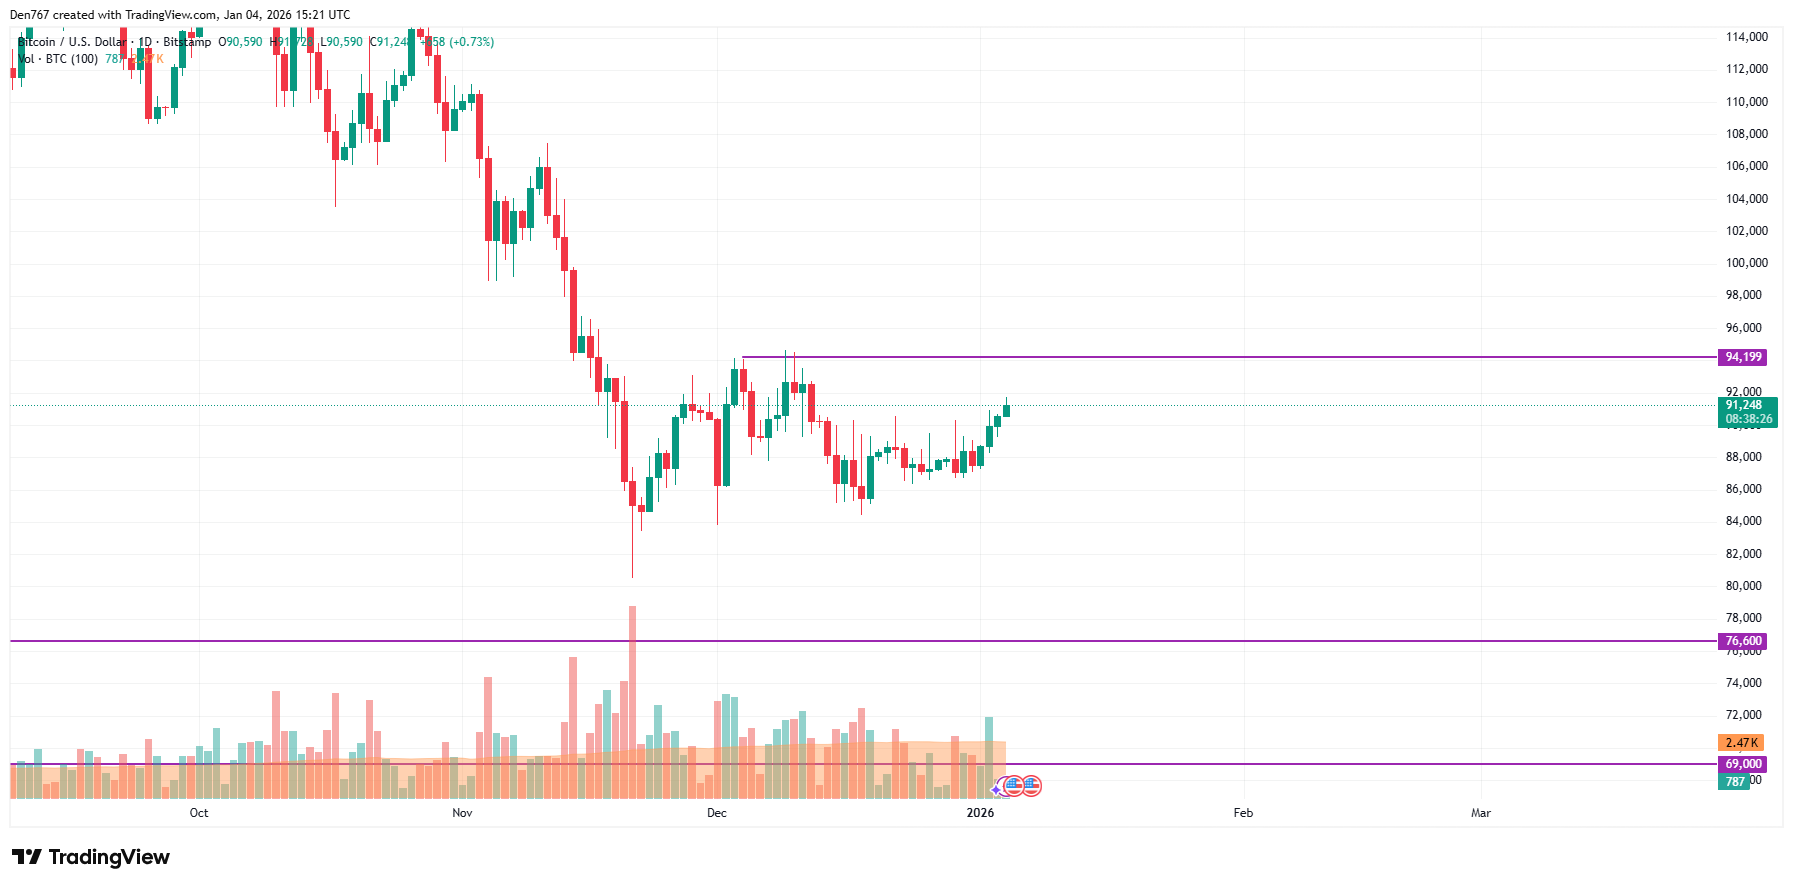
On the bigger time frame, there are no reversal signals so far. If the daily candle closes around the interim level of $92,000, the accumulated energy might be enough for ongoing growth to the nearest resistance at $94,199.
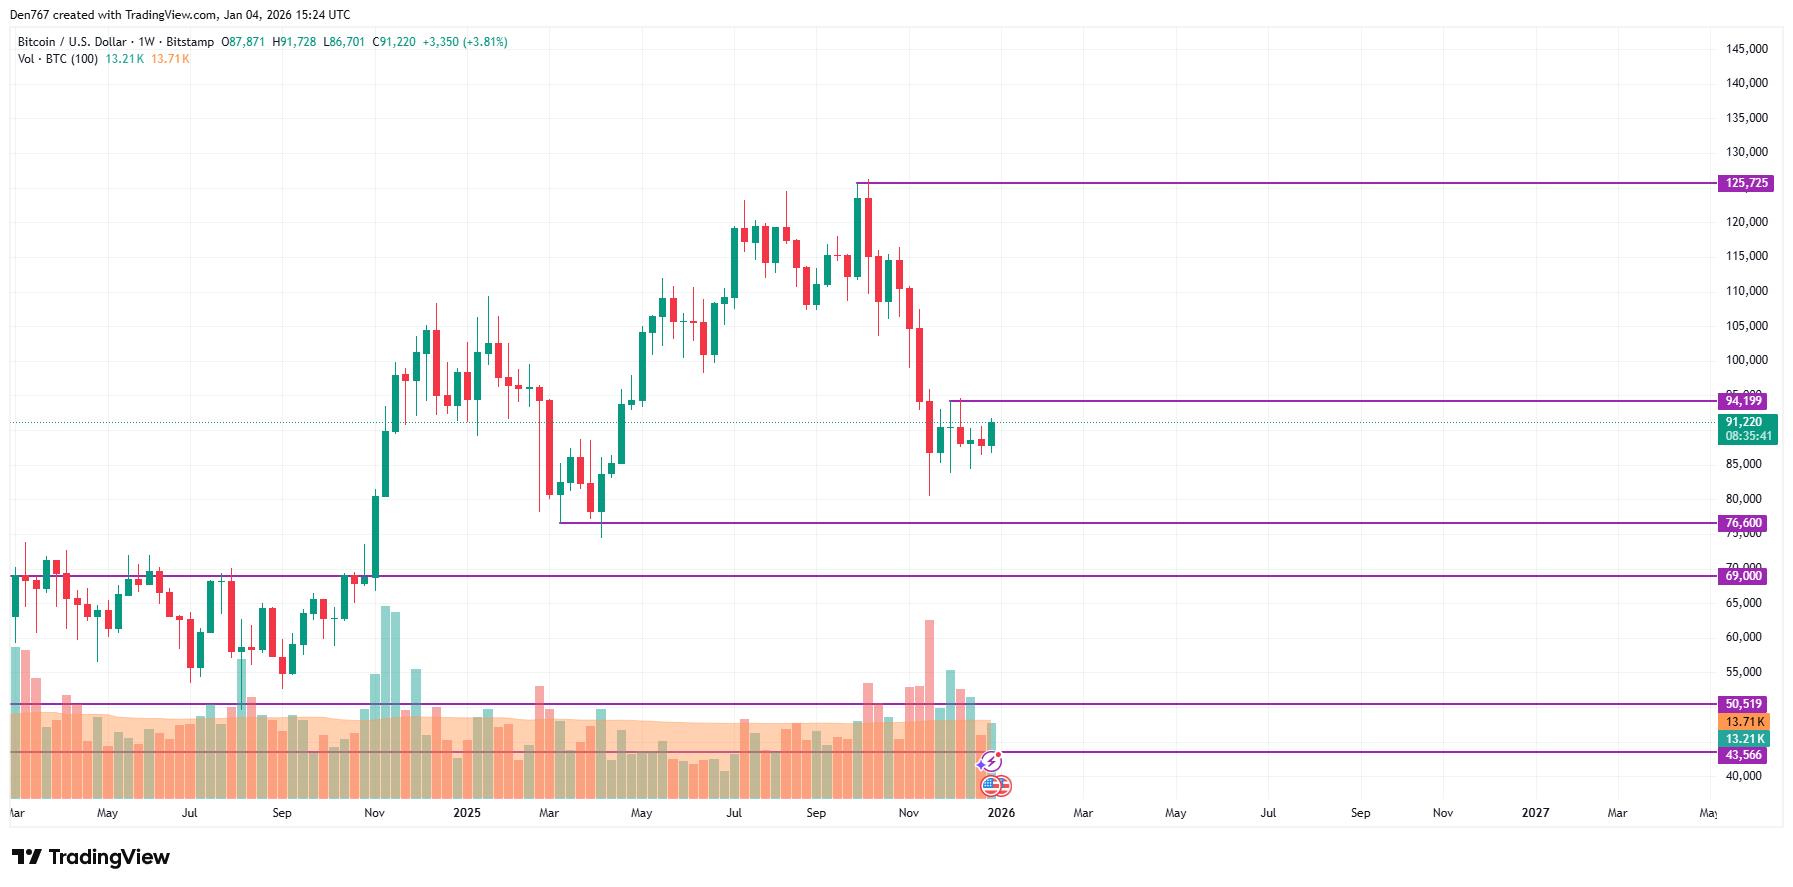
From the midterm point of view, the situation remains neutral. The volume is low, which means neither bulls nor bears are ready to seize the initiative yet.
All in all, sideways trading in the range of $90,000-$93,000 is the more likely scenario.
Bitcoin is trading at $91,190 at press time.


