

RENDER's price has surged nearly 85% in the past seven days, making it one of the strongest-performing AI coins recently. The AI-related coin group as a whole has also increased by approximately 18% during the same period, with RENDER playing a central Vai in this rally.
On the surface, RENDER's upward momentum seems quite convincing. Prices are rising rapidly, growth momentum is returning, and Capital flows have improved significantly. However, a closer XEM at the underlying data reveals a more complex situation.
Render prices are rising, but the downtrend remains.
Despite a strong surge, RENDER's price is still trading within the descending price channel formed since the beginning of October 2023. A descending price channel is created when the price continuously makes progressively lower highs, indicating that sellers are still in control of the overall trend.
The recent rally pushed RENDER close to the upper boundary of the descending channel, but the price failed to break through. Notably, this resistance line has only been clearly touched twice, meaning it's not yet a strong resistance level, yet sellers are still aggressively defending this price zone.
This rejection is clearly evident in the candlesticks. Recent daily candlesticks all have very long upper wicks, signaling selling pressure. Buyers pushed the price higher, but sellers immediately appeared when the price reached the resistance zone, pulling it down. This phenomenon often occurs when an uptrend encounters pressure from a larger downtrend structure.
The Capital flow also confirms that this was not a weak rebound. The Chaikin Money Flow (CMF) indicator – which tracks the flow of money into and out of an asset – consistently rose while the RENDER price declined from October to early January 2024. This suggests that accumulation occurred during the price decline.
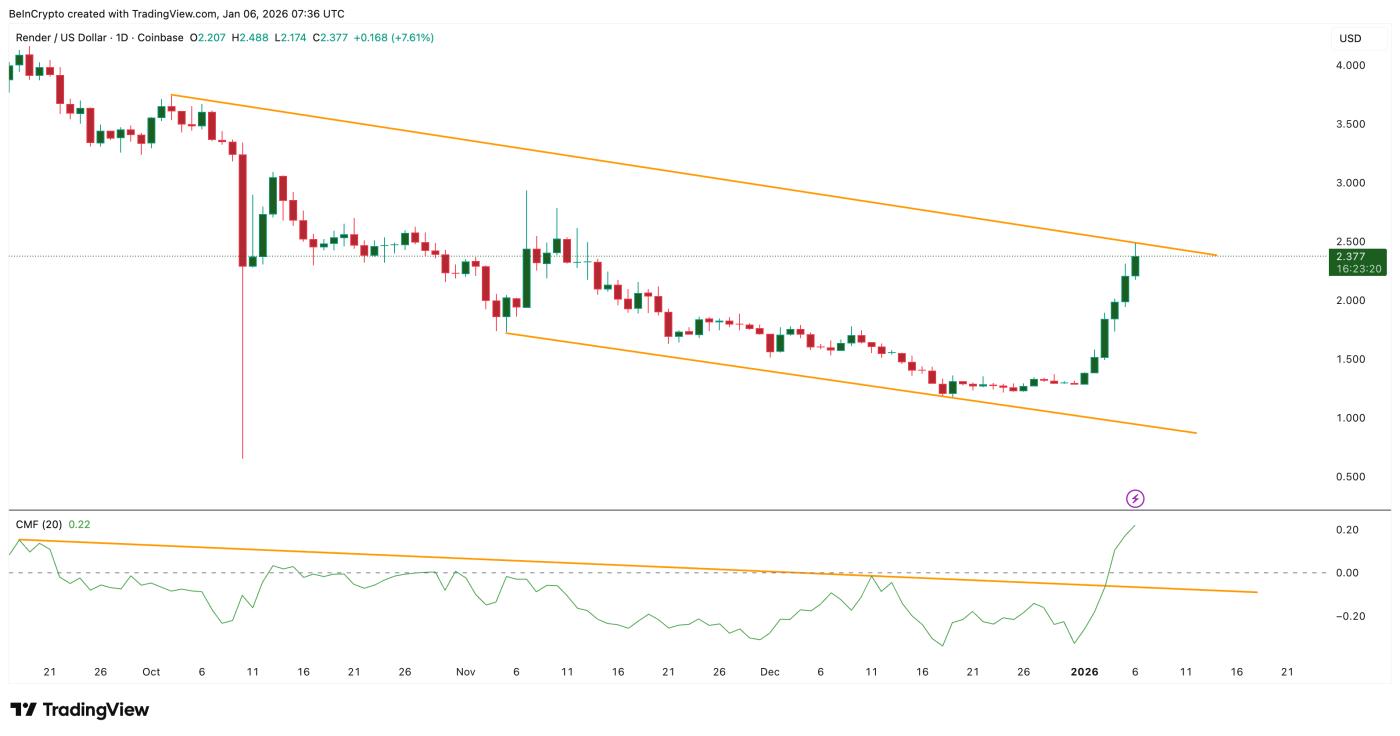 Rendering is still in a downtrend: TradingView
Want to read more Token analyses like this? Sign up for the daily Crypto newsletter from editor Harsh Notariya here .
When the price broke above, the CMF indicator also broke its own downtrend line and rose back above 0. This confirms that the uptrend has real money flow support. However, the buying pressure is still not strong enough to push the price out of the downtrend channel.
In summary, RENDER has rebounded with real money inflows, but it's still not strong enough to reverse the larger downtrend.
Buying pressure is decreasing as warning signs about momentum emerge.
Another risk, not clearly visible on the price chart but explaining why the price forms long upper wicks, is a change in the outflow of Token from exchanges.
Exchange Flow Balance is an indicator that tracks the number of Token withdrawn from exchanges. Strong outflows are often a sign to buy and hold long-term. Conversely, if outflows decrease, it means demand is weakening or people are starting to take profits.
Over the past 24 hours, the amount of RENDER Token withdrawn from exchanges has sharply decreased from approximately 203,000 Token to around 49,000 Token. This represents a drop of 76%, indicating a rapid weakening of buying power just as the price reached a resistance level.
 Buying pressure is decreasing: Santiment
At the same time, momentum indicators also issue warning signals.
The Relative Strength Index (RSI) – which measures momentum – is forming higher highs, while the RENDER price is at risk of forming lower highs. This is a bearish divergence pattern, often appearing when momentum weakens even though the price remains high.
This divergence is Unconfirmed . To confirm it, a daily candle needs to close below $2.48, thereby clearly establishing a lower high structure. If this happens, it is highly likely that the current uptrend is weakening rather than strengthening.
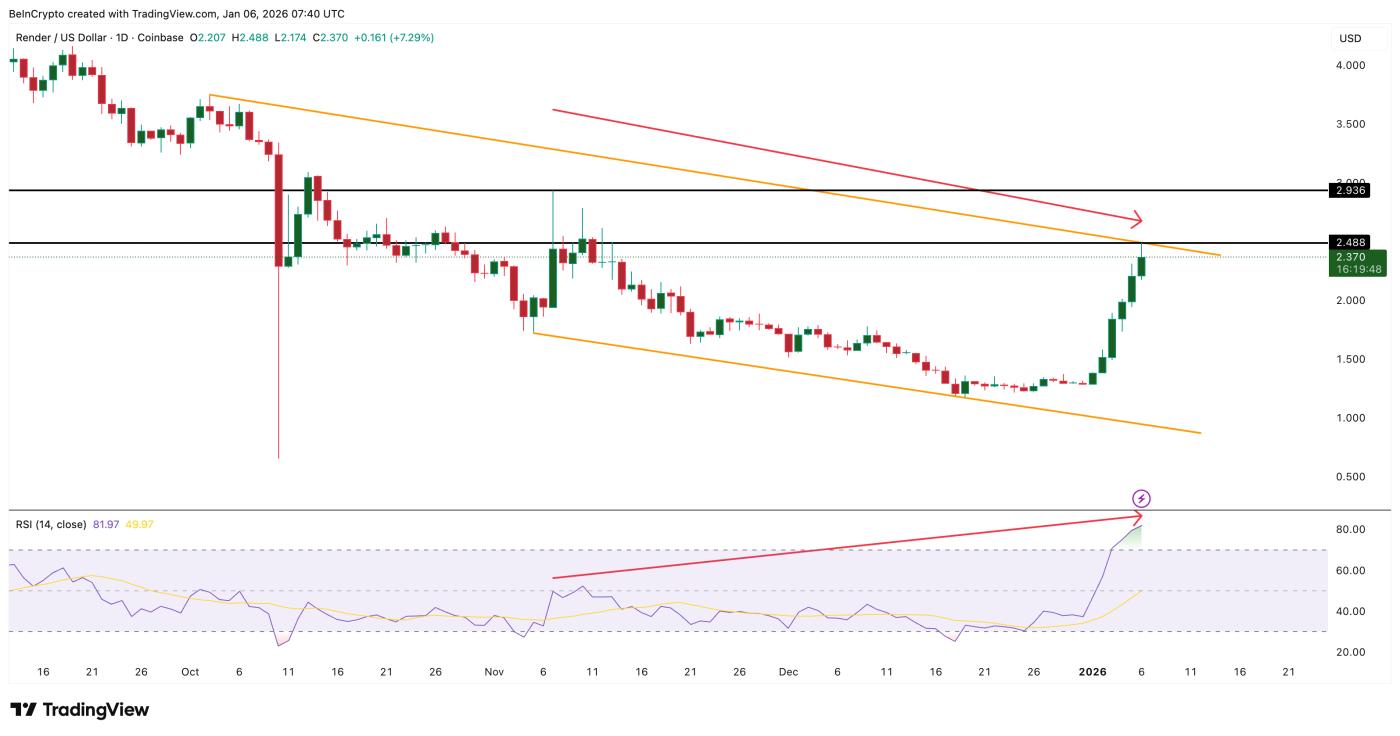 RSI divergence is forming: TradingView
As a result, weakening buying pressure and reduced momentum partly explain why RENDER is struggling at the resistance level despite having just recorded a strong upward trend.
The current RENDER price will determine the next trend.
When trend lines and momentum signals appear together, the current price levels of the renderer become even more important than conventional technical indicators.
For the buyers to regain control, RENDER needs to close the day above $2.56. At that point, the price will break through the descending channel resistance and open up the opportunity to reach the $2.93 region. Only after surpassing this level will the overall trend begin to turn positive again.
If bearish signals continue to appear, the risk of further price declines will increase rapidly. The first support zone is around $2.05, meaning there is a possibility of a further price correction of about 14%. If the decline is deeper, the price could fall to the $1.80 region, or even $1.59 if the strong corrective trend continues.
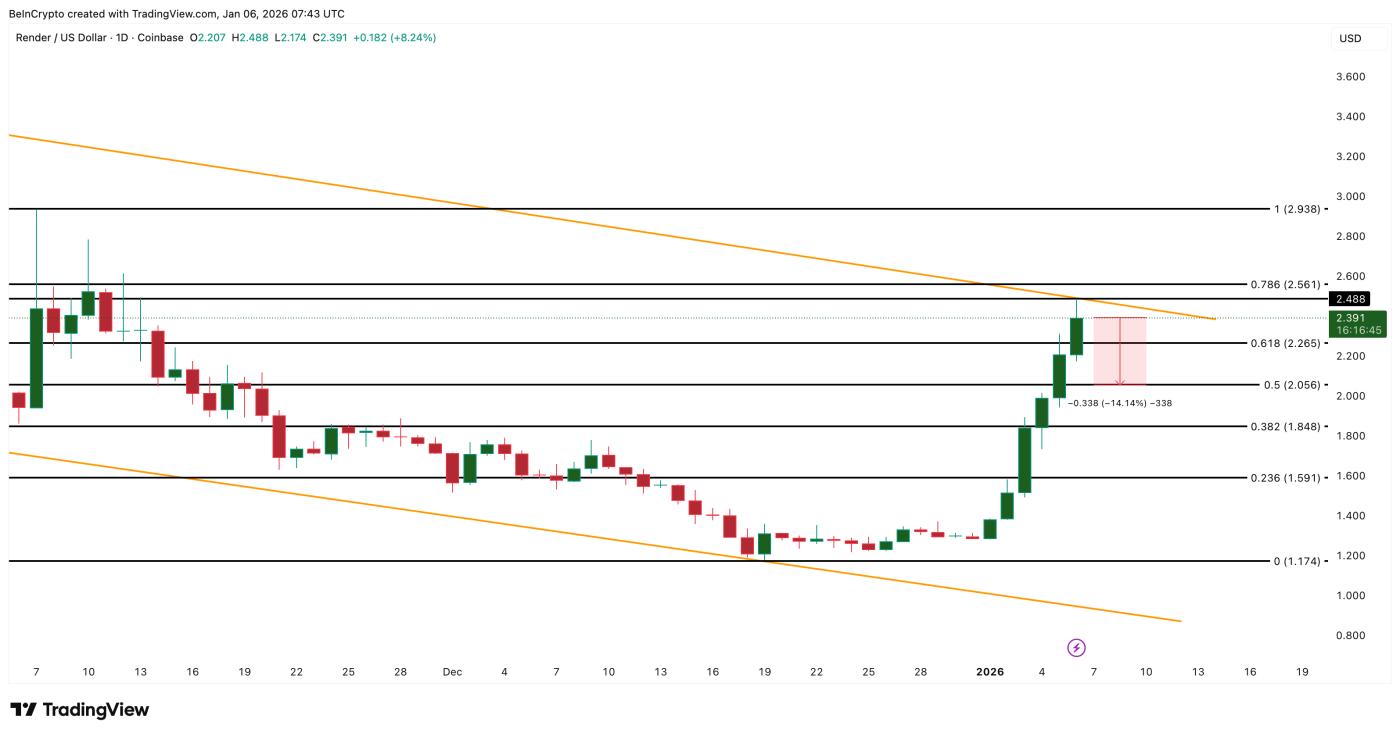 RENDER price analysis: TradingView
RENDER may be supporting the AI price surge , but charts show the Token is being tested at a crucial threshold. Capital inflows helped initiate this uptrend. However, momentum and demand need to continue to sustain the strength.
Whether RENDER can continue to rise doesn't depend on how fast it rises, but rather on whether the Token can break free from the trend that has held it back for months.


