

The market is gradually shifting from a defensive selling-driven model to a phase of selectively increasing risk exposure and rebuilding participation.
Written by: Glassnode
Compiled by: AididiaoJP, Foresight News
After a significant year-end correction, Bitcoin is entering 2026 with a clearer market structure. Profit-taking pressure has eased somewhat, and market risk appetite is recovering moderately. However, to establish a sustained upward trend, the key remains to firmly establish and reclaim important cost benchmarks.
summary
After a deep correction and months of consolidation, Bitcoin has officially entered 2026. On-chain data shows that profit-taking pressure has eased significantly, and the market structure is showing initial signs of stabilization at the lower end of the trading range.
Despite easing selling pressure, a large number of previously trapped positions remain above the price, mainly concentrated in the upper half of the current range. This will continue to suppress the price's upward potential, highlighting the importance of breaking through key resistance levels for resuming the upward trend.
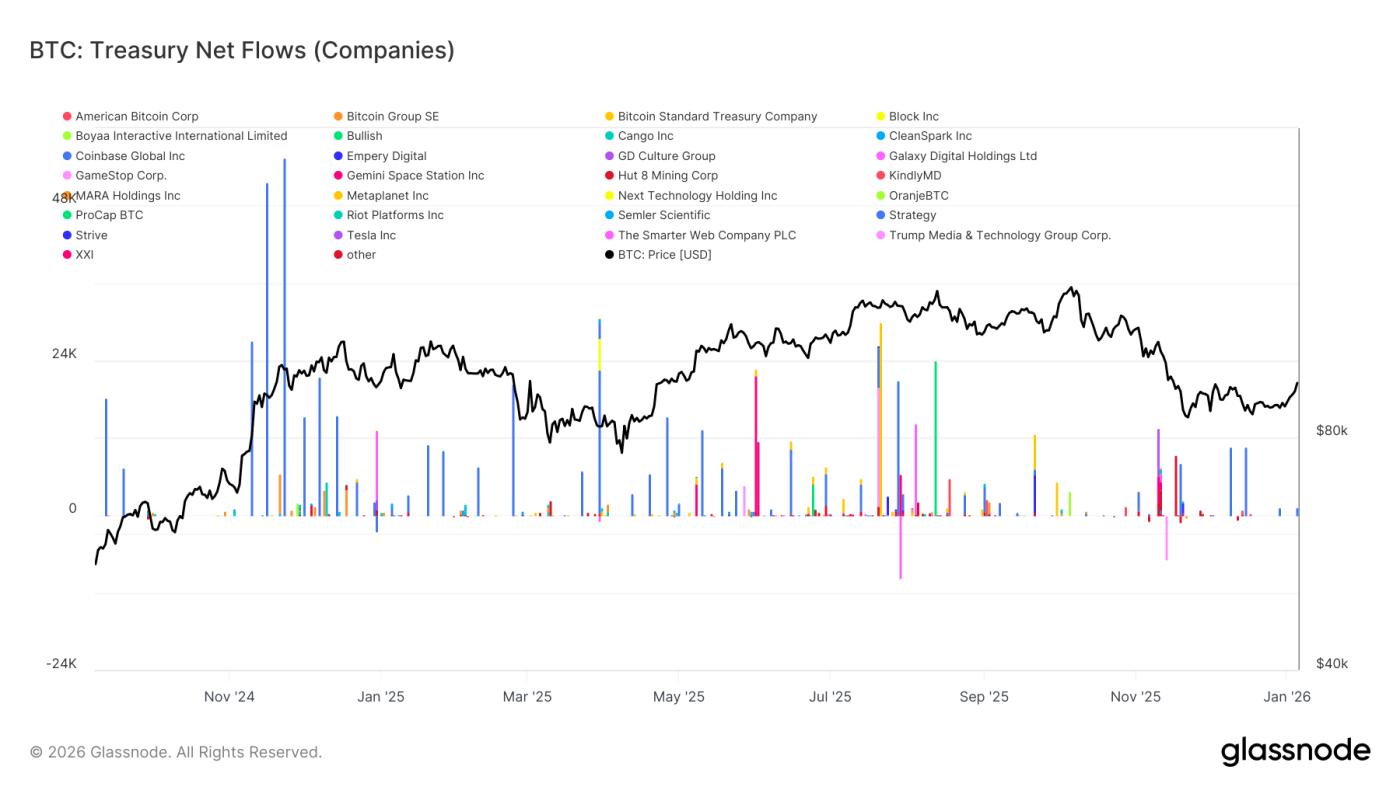
Demand for Bitcoin from cryptocurrency treasury companies continues to provide underlying support for prices, but this demand is characterized by its pulsatile nature and lacks sustainability and structure.
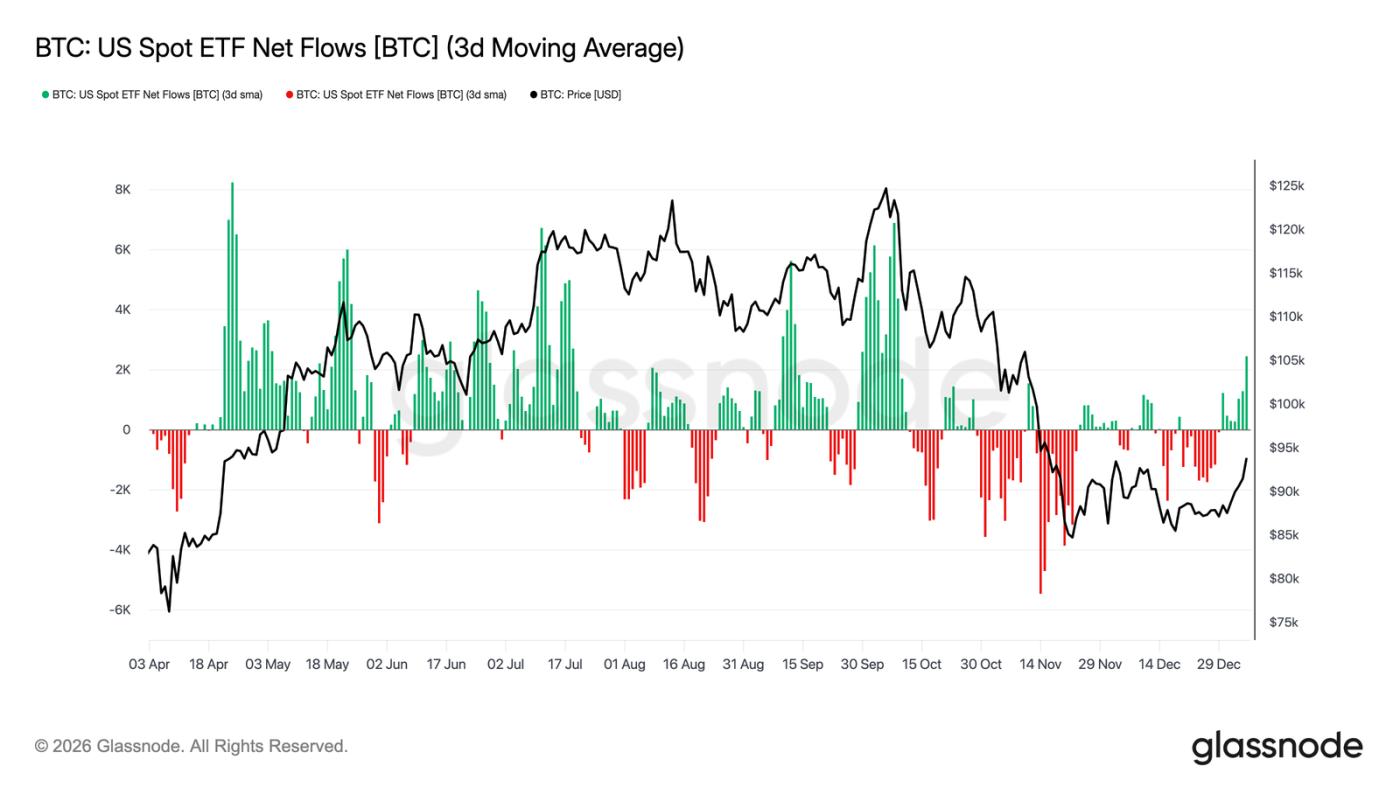
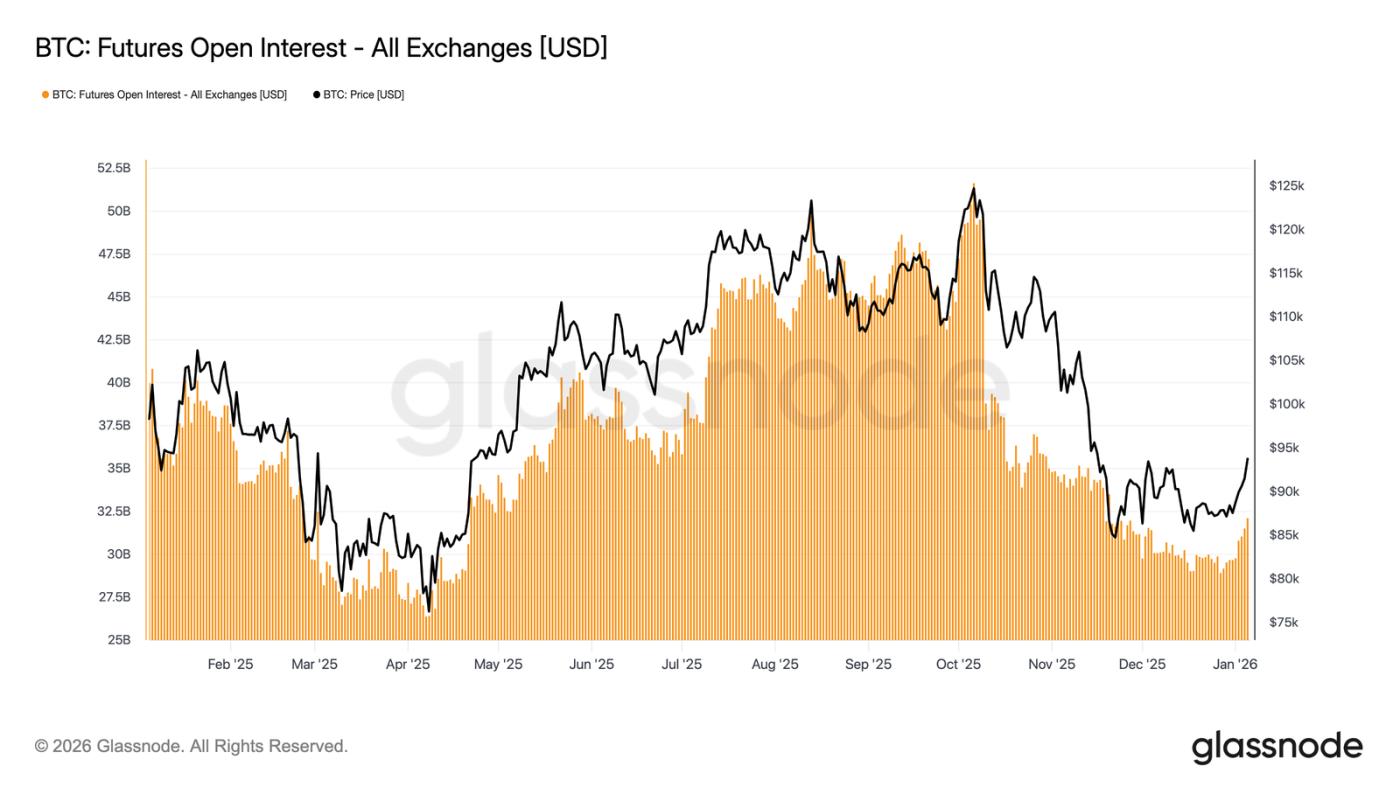
After experiencing net outflows at the end of 2025, US spot Bitcoin ETFs have recently shown signs of net inflows again. Meanwhile, open interest in the futures market has stopped declining and begun to rise, indicating that institutional investors are re-entering the market and derivatives activity is being rebuilt.
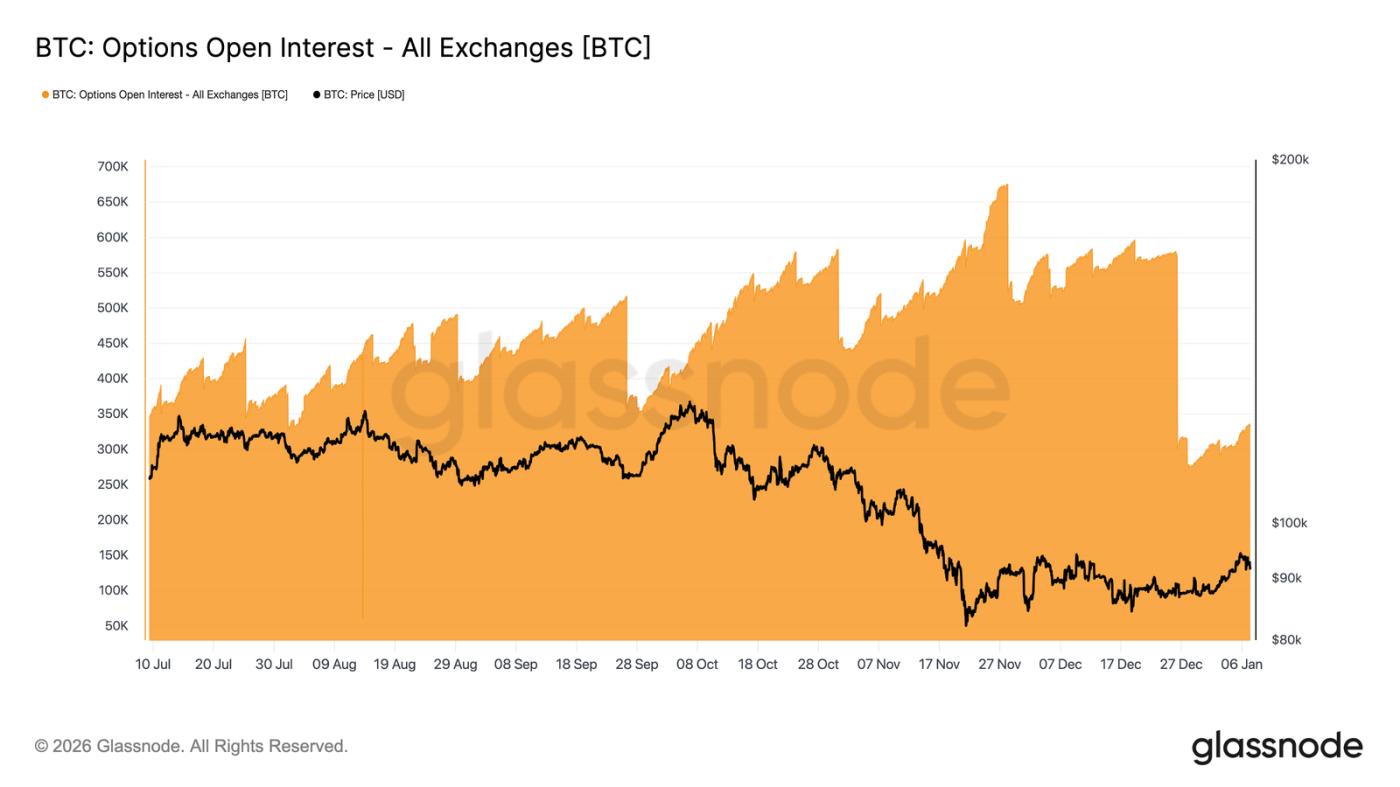
A record number of options positions expired at the end of the year, with more than 45% of open interest being liquidated. This removed structural hedging constraints in the market, allowing true risk appetite to be more clearly reflected in prices.
Implied volatility has most likely reached a bottom, and while buyer demand at the beginning of the year is moderately pushing up the volatility curve, it is still at a relatively low level within the three-month range.
As put option premiums narrow and the proportion of call option trading increases, market skewness continues to return to normal. Since the beginning of the year, options trading has clearly tilted towards the bullish direction, indicating that investors are shifting from defensive hedging to actively positioning for upside opportunities.
In the $95,000 to $104,000 range, market makers have turned net short, meaning their hedging activities will passively fuel the price increase when it rises into this range. Furthermore, the premium of call options around the $95,000 strike price also indicates that long position holders are inclined to hold rather than rush to take profits.
Overall, the market is gradually shifting from a defensive deleveraging phase to selective risk-taking, entering 2026 with a clearer structure and greater resilience.
On-chain insights
Profit-taking pressure has eased significantly.
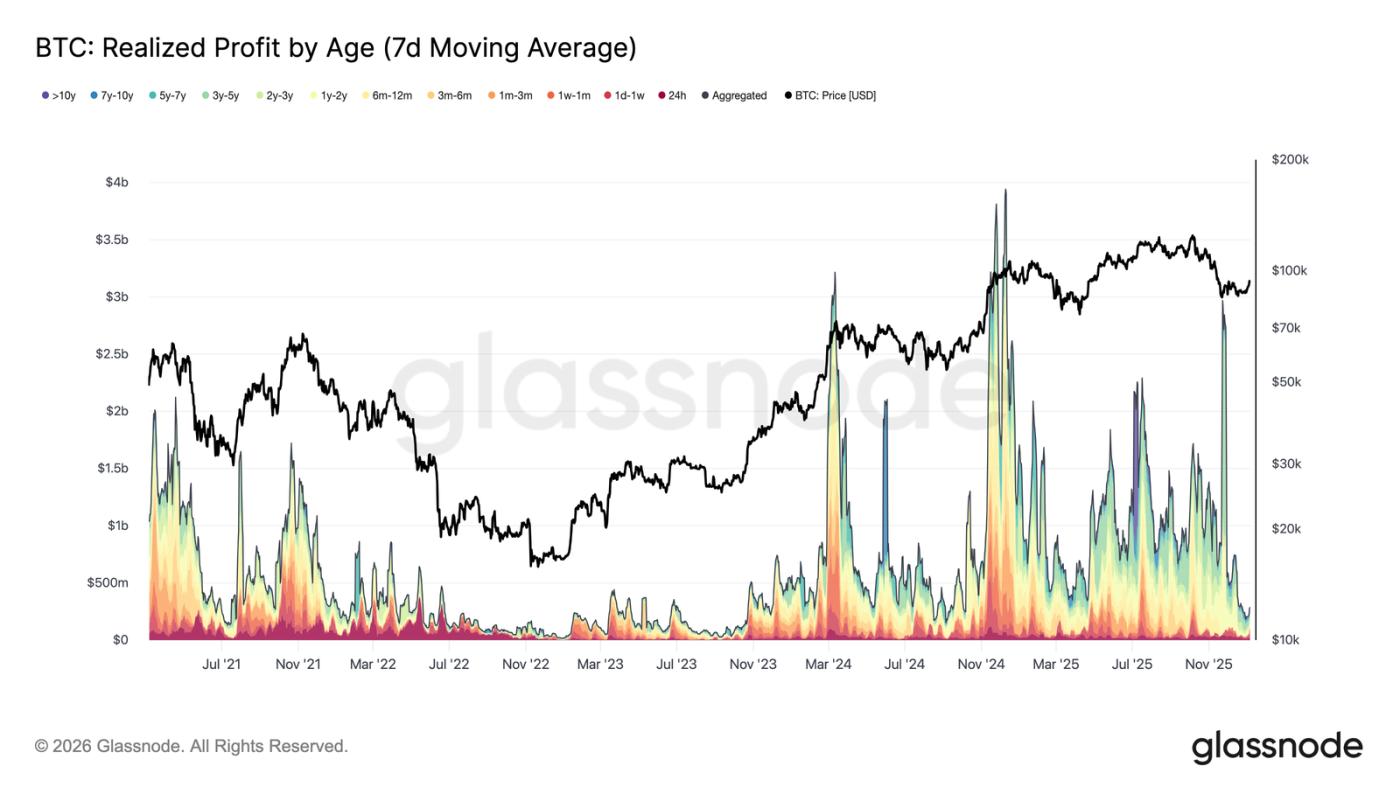
In the first week of 2026, Bitcoin broke out of its multi-week consolidation range around $87,000, rising approximately 8.5% to a high of $94,400. This rise was based on a significant easing of overall profit-taking pressure in the market. By late December 2025, the 7-day average realized profit had fallen sharply to $183.8 million, down from a high of over $1 billion per day for most of the fourth quarter.
The decline in realized profits, particularly the reduced selling pressure from long-term holders, indicates that the main selling pressure that had previously suppressed price increases has been released in stages. As selling pressure weakens, the market stabilizes and restores confidence, thus driving a new round of price increases. Therefore, the breakout at the beginning of the year signifies that the market has effectively absorbed profit-taking pressure, opening up room for price increases.
Facing resistance from the trapped investors above
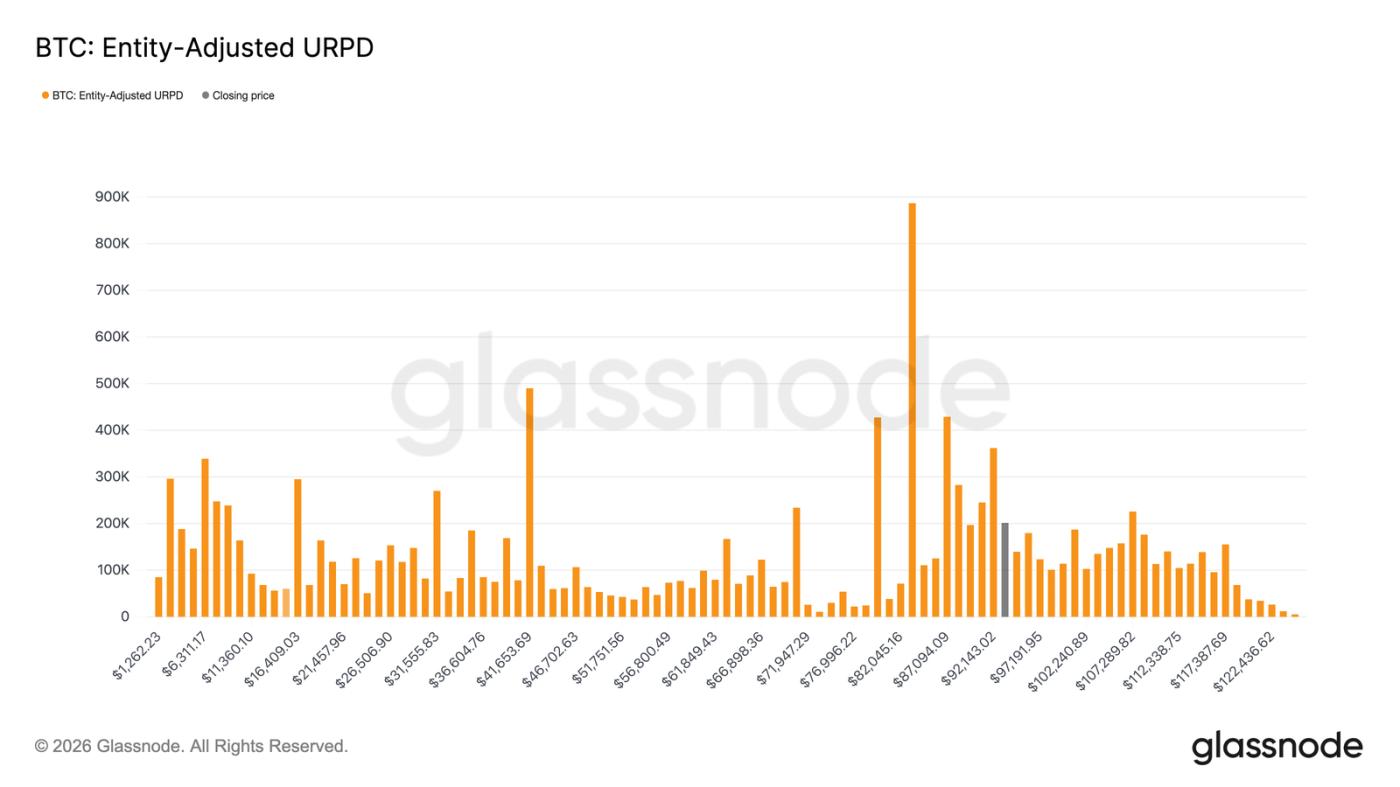
As profit-taking pressure eased, prices were able to rise further, but the current rebound is entering a supply zone comprised of varying holding costs. The market has now entered a range primarily controlled by "recent top buyers," whose holding costs are densely distributed between $92,100 and $117,400. These investors bought heavily near previous highs and held their positions throughout the pullback from the all-time high to around $80,000, until the current rebound phase.
Therefore, as prices recover to their cost basis, these investors will have the opportunity to break even or exit with a small profit, thus creating natural upward resistance. For a true bull market to resume, the market needs time and resilience to absorb this upward supply and push prices to break through this area effectively.
Key recovery level
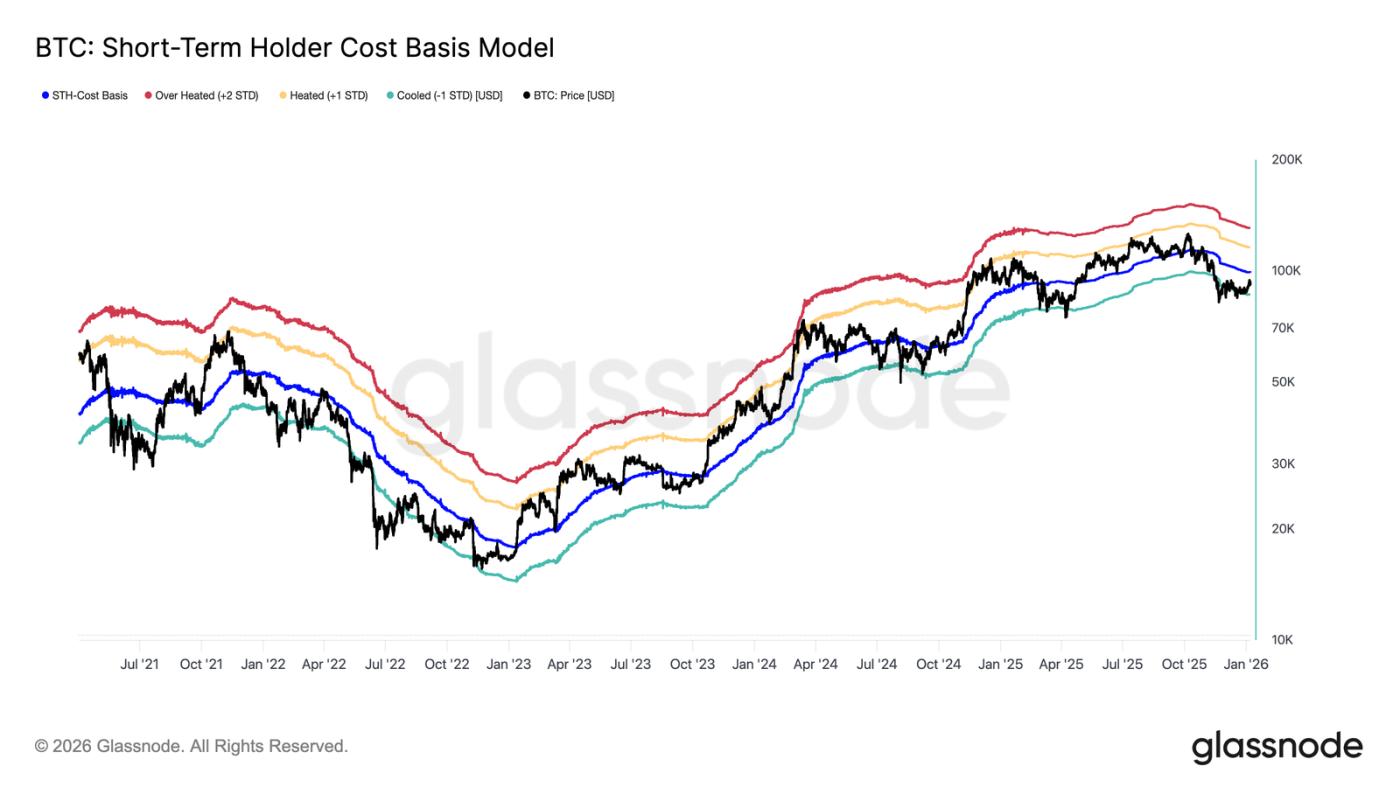
Faced with selling pressure from trapped investors above, determining whether the recent rebound can truly reverse the previous downtrend and enter a phase driven by sustained demand requires a reliable price analysis framework. A cost-based model for short-term holders is particularly important during this transition period.
It's worth noting that the weak market equilibrium in December of last year formed precisely near the lower bound of the model, reflecting fragile market sentiment and insufficient buyer confidence at the time. The subsequent rebound pushed prices back up to near the model's mean, specifically the $99,100 level where short-term holders' cost base lies.
Therefore, the first key confirmation signal of market recovery will be that prices can continue to stand above the cost basis of short-term holders, which means that the confidence of new investors has rebounded and the trend is expected to turn positive.
Crossroads of profit and loss
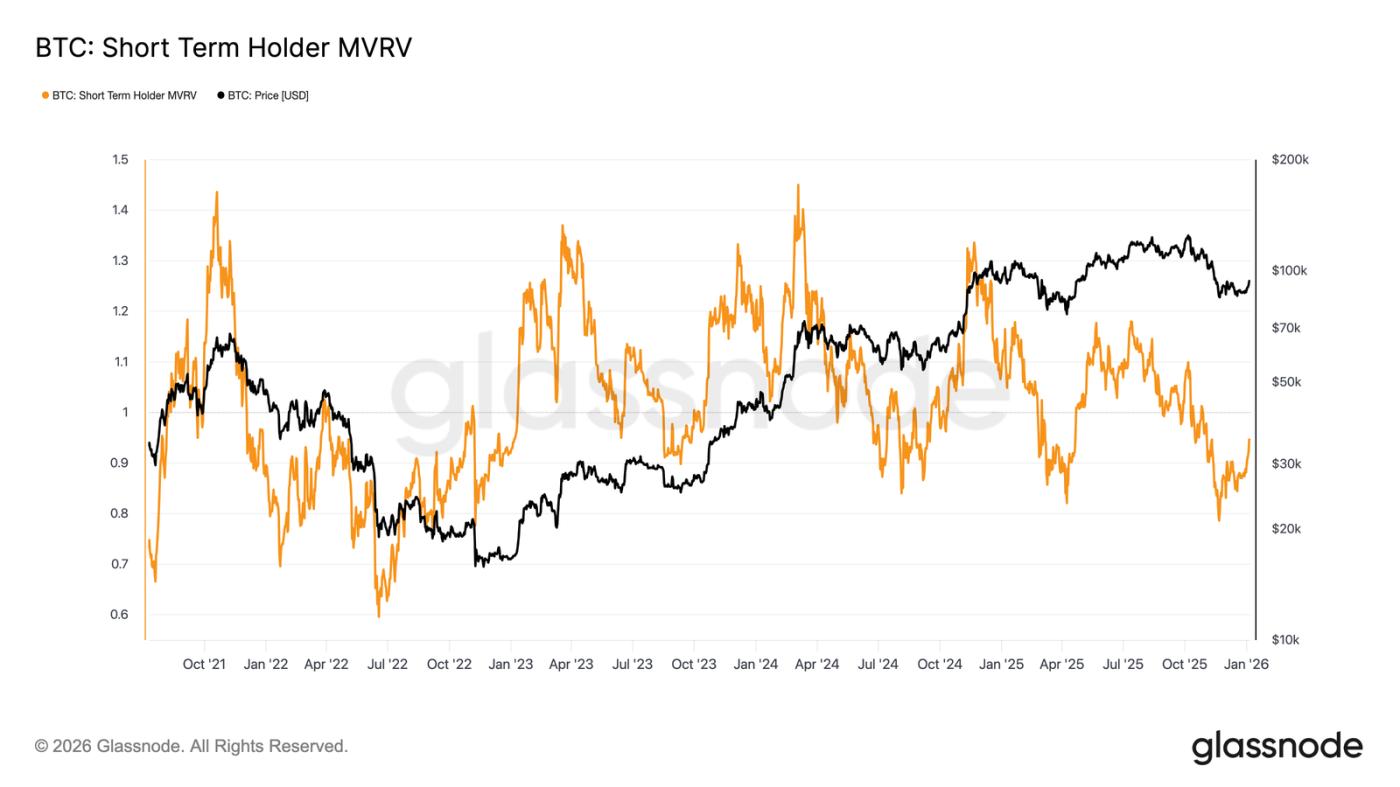
With market focus shifting to the ability to effectively recover the cost base for short-term holders, the current market structure bears a striking resemblance to the failed rally in the first quarter of 2022. If prices continue to fail to rise above this level, a deeper downside risk could be imminent. If confidence remains shaky, demand will shrink further.
This dynamic is also clearly reflected in the short-term holders' MVRV indicator. This indicator reflects the profit and loss status of recent buyers' positions by comparing the spot price with the average cost of recent buyers. Historically, when this indicator has been consistently below 1 (i.e., the price is below the average cost), the market has often been dominated by short sellers. Currently, the indicator has rebounded from a low of 0.79 to 0.95, meaning that recent buyers are still on average in a loss of about 5%. If it cannot return to profitability (MVRV > 1) soon, the market will still face downward pressure, making this indicator a key point to watch in the coming weeks.
Off-chain insights
Demand for digital asset treasury cools down
Corporate treasuries continue to provide significant marginal demand support for Bitcoin, but their buying activity remains intermittent and event-driven. While treasury entities have repeatedly seen net inflows of thousands of Bitcoins in a single week, these purchases have not formed a sustained and stable accumulation pattern.
Large-scale capital inflows often occur during periods of localized price pullbacks or consolidation, indicating that corporate buying behavior remains price-driven and represents opportunistic allocation rather than long-term structural accumulation. Although the range of participating institutions has expanded, the overall capital inflow exhibits a "pulsating" characteristic, interspersed with relatively long quiet periods.
Without sustained buying support from a pool of funds, corporate demand will act more as a price stabilizer than a driver of upward trends. Market direction will depend more on changes in derivatives positions and short-term liquidity conditions.
ETF fund flows return to net inflows
Recent fund flows in the US spot Bitcoin ETF have shown early signs of institutional funds re-entering the market. After a period of sustained net outflows and thin trading in late 2025, fund flows have clearly shifted to net inflows in recent weeks, coinciding with the price stabilizing and rebounding in the $80,000 range.
Although current net inflows have not yet recovered to the peak levels of the mid-cycle, a definite shift in fund flows has occurred. The increase in the number of days with net inflows indicates that ETF investors are transitioning from net sellers to marginal buyers.
This shift means that institutional spot demand is once again becoming a positive supporting force in the market, rather than a source of liquidity pressure, providing structural buying support for the market that stabilized at the beginning of the year.
Futures market participation rebounds
Following the sharp deleveraging triggered by the price decline at the end of 2025, total open interest in the futures market has recently begun to rebound. After falling from a cyclical high of over $50 billion, open interest has now stabilized and is showing moderate growth, indicating that derivatives traders are rebuilding risk positions.
This position rebuilding coincided with the price stabilization process above $80,000 to $90,000, indicating that traders were gradually increasing their risk exposure rather than rushing to buy at higher prices. The pace of renewed position building is currently relatively moderate, and the size of open interest remains far below previous cycle highs, reducing the risk of large-scale liquidations in the short term.
The modest rebound in open interest indicates an improvement in localized risk appetite and a gradual return of derivatives buying, which will help prices begin a new round of pricing at the beginning of the year as liquidity tends to normalize.
Options market positions undergo a major reshuffle.
In late 2025, the Bitcoin options market experienced its largest position reset in history. The number of open contracts plummeted from 579,258 on December 25 to 316,472 after expiry on December 26, a drop of more than 45%.
A large number of open positions concentrated at certain key strike prices can indirectly affect short-term price movements through hedging operations by market makers. By the end of last year, this concentration of positions reached a high level, leading to "price stickiness" in the market and limiting volatility.
This pattern has now been broken. With the concentrated clearing of positions maturing at the end of the year, the market has broken free from the structural constraints of previous hedging mechanisms.
The market environment after expiration provides a clearer window into true sentiment, as new positions reflect investors’ current risk appetite rather than the impact of legacy positions. This makes options trading in the first few weeks of the year more directly reflect market expectations for future trends.
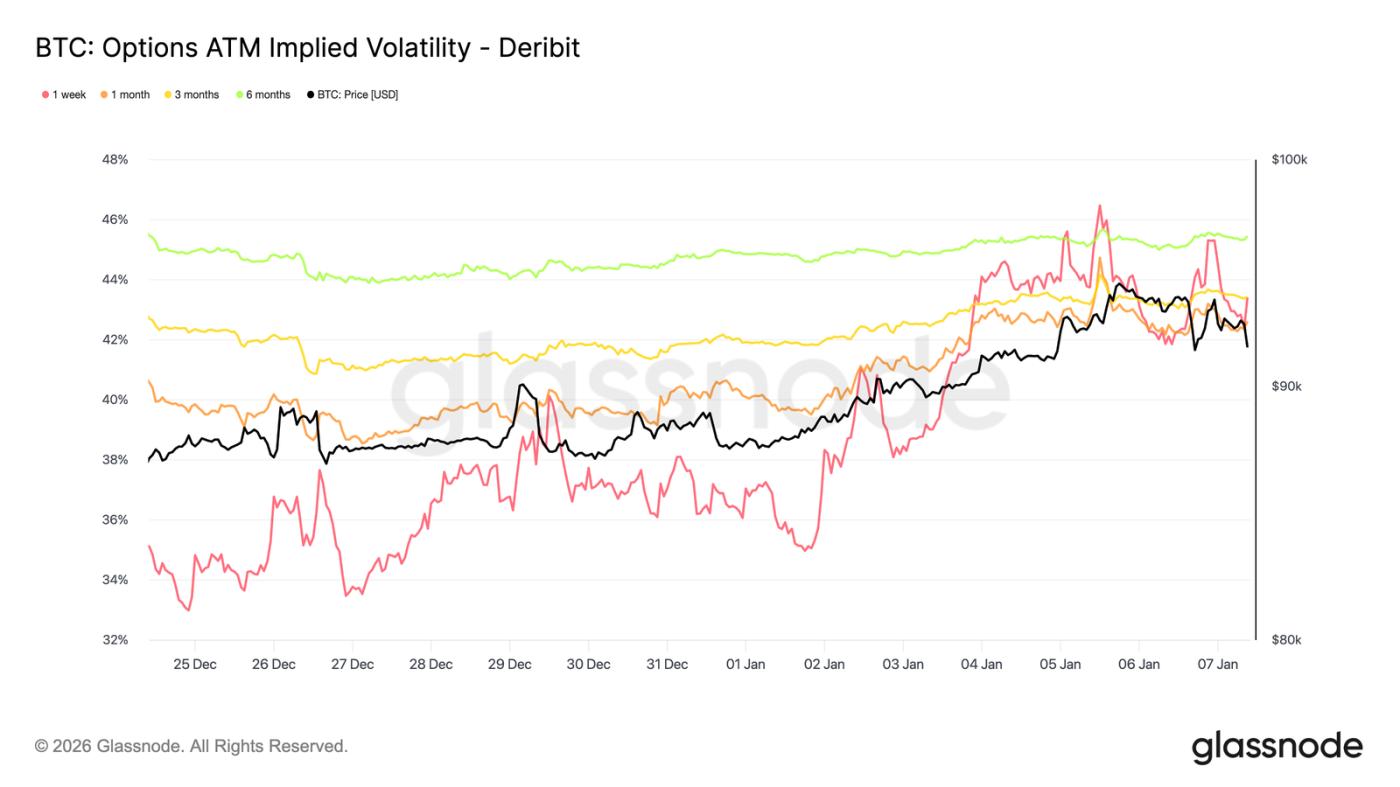
Implied volatility may have bottomed out.
Implied volatility hit a short-term low during the Christmas period following a large-scale reallocation of options positions. Trading was light during the holiday, with one-week implied volatility falling to its lowest level since late September last year.
Subsequently, buyer interest began to return, and investors gradually built up long volatility positions (especially bullish ones) at the start of the new year, pushing volatility curves across all maturities up moderately.
Despite some recovery, implied volatility remains compressed. Volatility across maturities from one week to six months is concentrated between 42.6% and 45.4%, with a relatively flat curve.
Volatility remains at the low end of its three-month range, and the recent rebound reflects more of a recovery in market participation than a full repricing of risk.
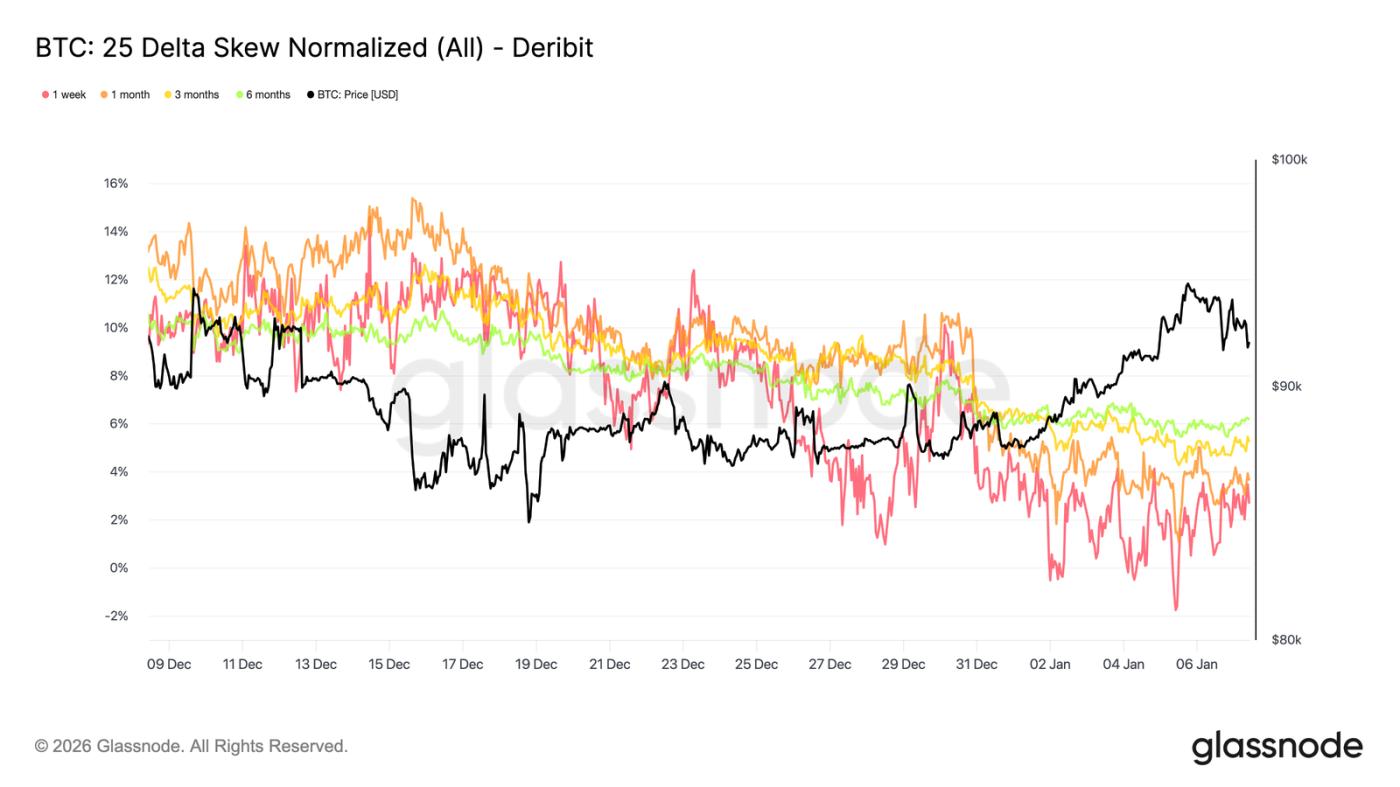
The market is trending towards equilibrium.
With implied volatility stabilizing, skewness provides a clearer perspective on traders' directional preferences. Over the past month, the premium of put options relative to call options across all maturities has continued to narrow, and the 25-Delta skewness curve has gradually reverted to the zero axis.
This reflects a gradual shift in market sentiment towards a bullish positioning. Investor demand is moving from simply protecting against downside risks to increasing exposure to upside opportunities, consistent with their year-end position clearing and reallocation behavior.
At the same time, defensive positions decreased. Some downside protection positions were unwound, reducing the premium paid for "black swan" insurance.
Overall, skewness indicates that market risk expression is becoming more balanced, and investors' expectations for price increases or increased volatility are rising.
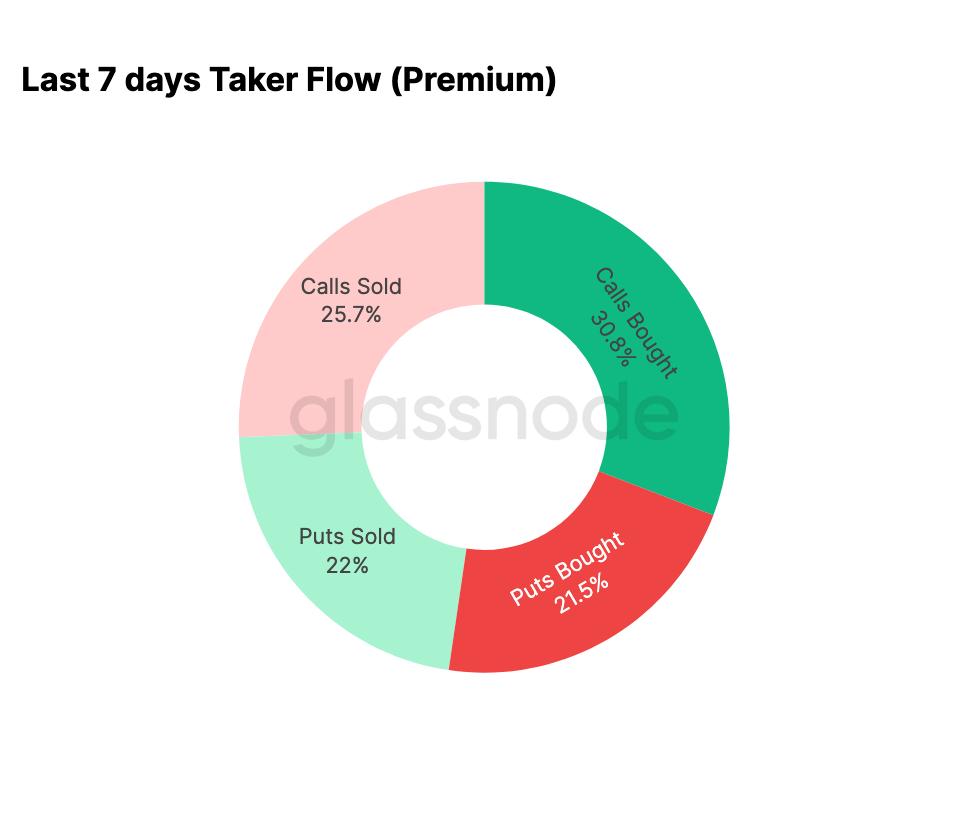
New Year options trading preference is bullish.
Fund flow data confirms the trend reflected by skewness. Since the beginning of the year, options market activity has shifted from systematically selling call options (betting on decreased volatility) to actively buying call options (betting on increased volatility).
Over the past seven days, call option buying accounted for 30.8% of total options activity. The increased demand for call options also attracted volatility sellers, who sold call options (accounting for 25.7% of total activity) to obtain higher premiums.
Bearish trades accounted for 43.5% of total volume, a relatively modest proportion given the recent price increases. This aligns with the skew becoming more balanced, reflecting a reduced demand for immediate downside protection in the market.
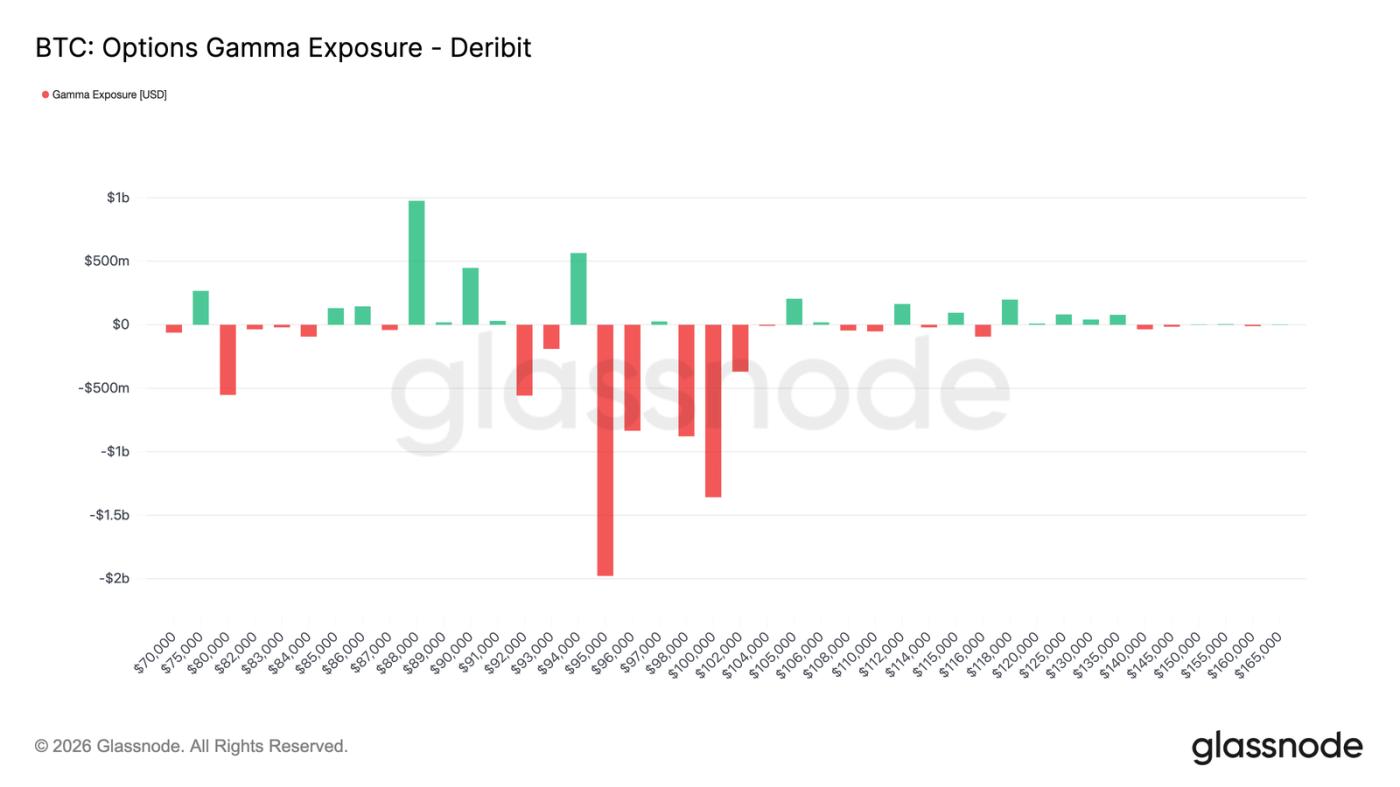
Market makers turn negative in key range
With increased trading in call options since the start of the new year, market makers have adjusted their positions accordingly. Currently, market makers hold a net short position overall, ranging from $95,000 to $104,000.
Within this range, when prices rise, market makers need to buy spot or perpetual contracts to hedge risks. This passive operation will have a boosting effect when the market strengthens, which is quite different from the positive environment that suppressed volatility at the end of last year.
The concentration of call option purchases by traders in the $95,000 to $100,000 range among first-quarter expiring contracts further confirms the shift in how market risk is expressed. The current market maker position structure suggests that their hedging activities within this range no longer suppress price volatility and may even amplify upward movement.
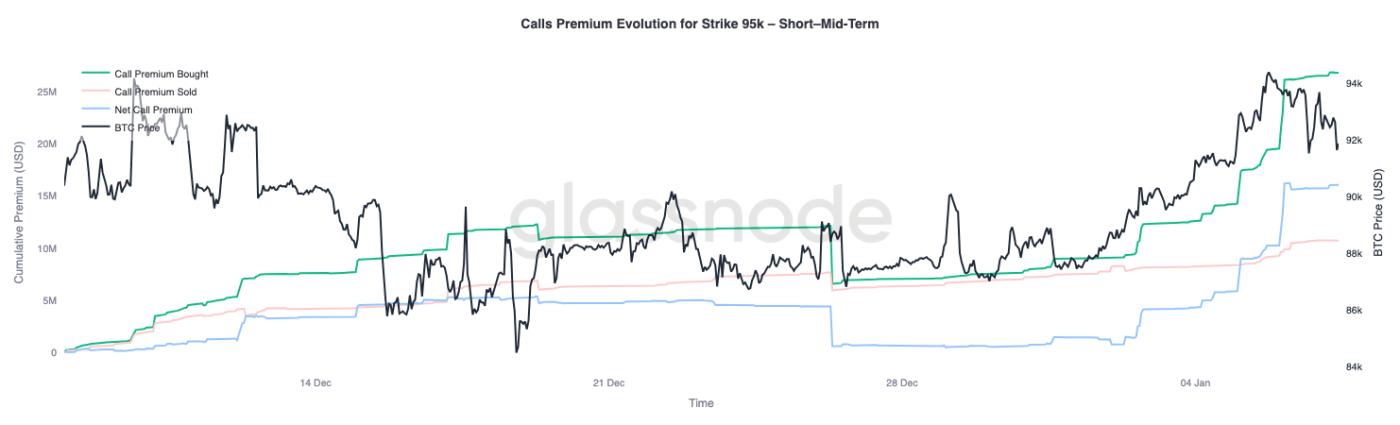
A $95,000 call option premium shows patience.
The premium of call options with a strike price of $95,000 can serve as an effective indicator of changes in market sentiment. On January 1, when the spot price was still around $87,000, the buying of call options with a premium at that strike price began to accelerate and continued to increase as the price climbed toward the recent high of $94,400.
Subsequently, while the premium buying leveled off, it did not show a significant decline. More importantly, this process was not accompanied by a substantial increase in premium selling of call options.
This indicates limited profit-taking. Since the recent high, call option selling volume has only increased modestly, suggesting that most call position holders are choosing to hold rather than rush to lock in profits.
Overall, the option premium around the $95,000 strike price reflects the patience and confidence of bullish participants in holding their positions.
Summarize
As Bitcoin enters the new year, it has significantly cleared historical positions across the spot, futures, and options markets. The deleveraging at the end of 2025 and the year-end options expiration events have effectively removed the structural constraints previously faced by the market, leaving a cleaner and clearer environment.
Currently, early signs of renewed market participation are emerging: ETF inflows are stabilizing and rebounding, futures market activity is rebuilding, and the options market is clearly shifting towards a bullish stance—skewness is returning to normal, volatility is bottoming out, and market makers are turning negative in the key upper range.
These dynamics collectively indicate that the market is gradually shifting from a defensive selling-driven model to a phase of selectively increasing risk exposure and rebuilding participation. Although structural buying power still needs to be strengthened, the release of historical position pressure and the resurgence of bullish sentiment mean that Bitcoin is starting 2026 with a lighter pace, and the improved internal market structure provides more possibilities for further market expansion.


