

Solana shows an increase in price amid anticipated external market influences, with key technical indicators signaling potential trend formation.
The Solana (SOL) price chart illustrates a healthy price movement, showing a 2.5% increase over the last 24 hours, as it rises to $139.66. The 24-hour price range has fluctuated between $133.38 and $140.70, with a notable climb towards the higher end.
Amid this surge, several factors can influence the market and Solana’s price dynamics. For instance, macroeconomic indicators like the U.S. unemployment data, which will be released today at 8:30 AM ET, could impact market liquidity and risk appetite, influencing altcoin price movements like Solana.
Further, geopolitical events, such as the U.S. Supreme Court’s ruling on President Trump’s tariffs today at 10:00 AM ET, may further create volatility in broader markets, including cryptos.
As these external factors unfold, market participants will be keeping a close eye on how Solana responds to the shifting tides.
Solana Price Analysis
A TradingView chart for Solana shows a weekly timeframe, revealing key technical indicators such as the Williams Alligator indicator and RSI. Based on the Alligator indicator, the Solana chart shows a phase where the Alligator is waking up. The three lines, Jaw, Teeth, and Lips, have started to spread apart, signaling the formation of a potential trend.
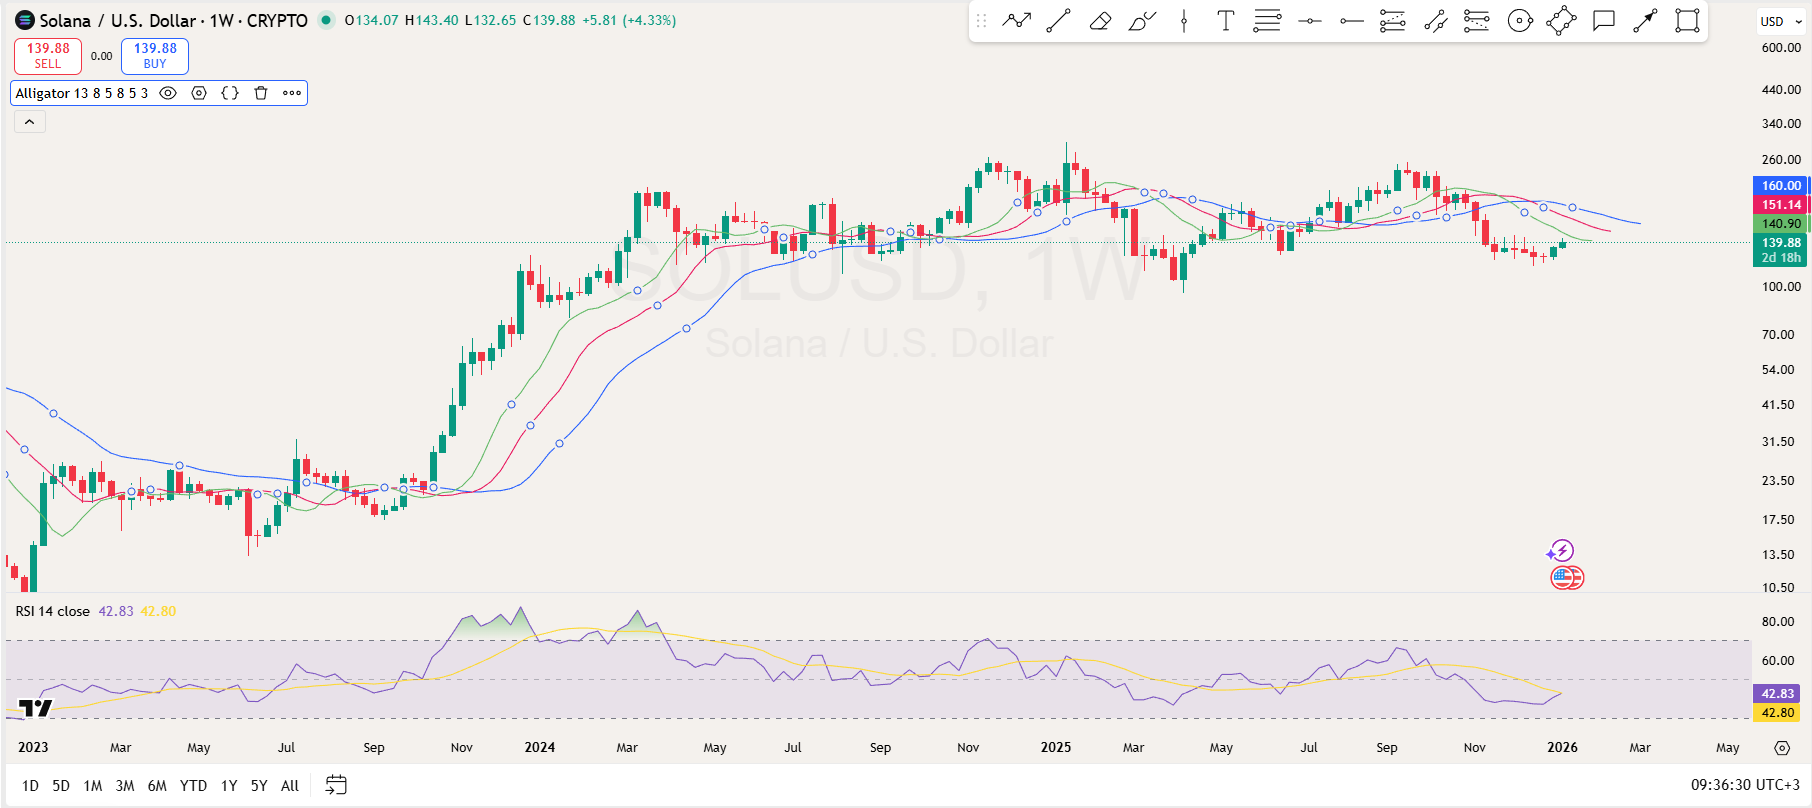
However, unless the Lips cross above the Teeth and the Jaw and maintain a parallel formation, the bullish trend won’t be fully confirmed. If the Lips cross above and stay above the Teeth and Jaw, it will signal that the market has entered a strong uptrend, and the Alligator is actively “eating.”
Meanwhile, the RSI, currently at 42.83, is just below the neutral 50 level, showing that the market is moving further from the oversold region. This could suggest that there is still room for further upward movement if momentum picks up, but traders should be cautious of potential price corrections if the RSI starts to dip again.
Potential Inverse Head and Shoulder?
Elsewhere, analyst Batman on X provides a detailed analysis of Solana’s current price action, including specific levels to watch. He notes that Solana has faced rejection along a strong resistance level around $144, which marked a local top.
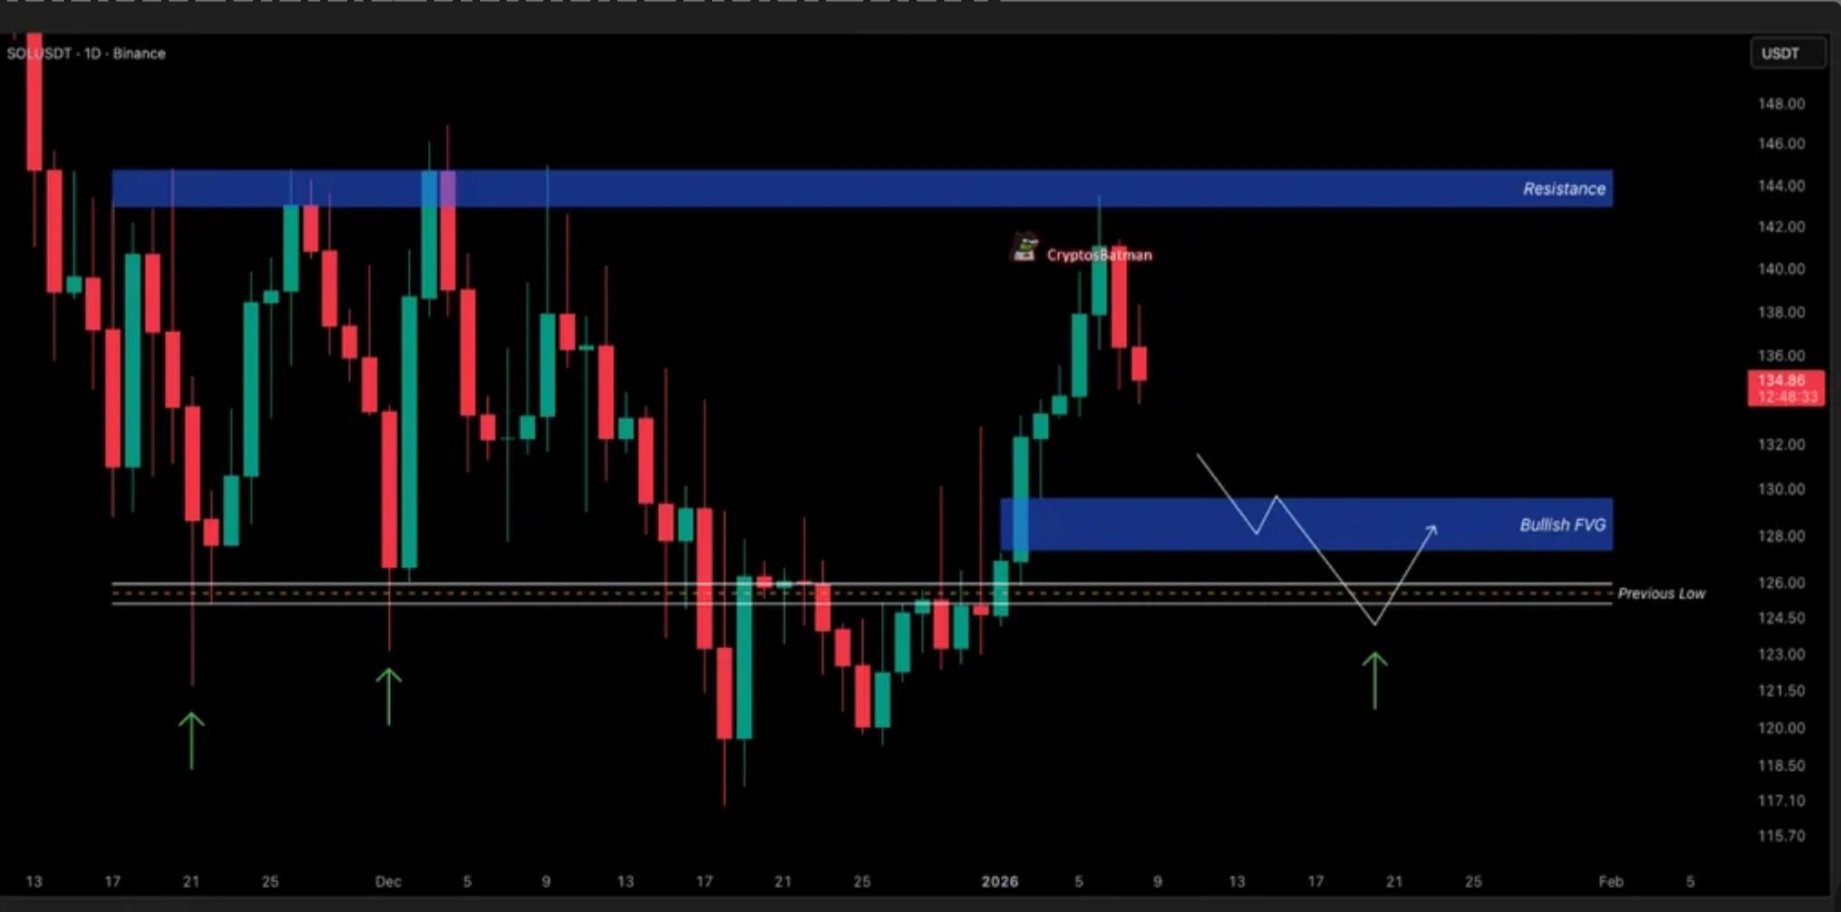
Also, the next significant support zone sits near the unfilled bullish Fair Value Gap (FVG), currently above $128, coinciding with previous lows. This area forms a potentially strong entry zone for buyers. Batman highlights that these levels, coupled with the potential formation of an inverse head and shoulders pattern, could provide a solid opportunity.


