

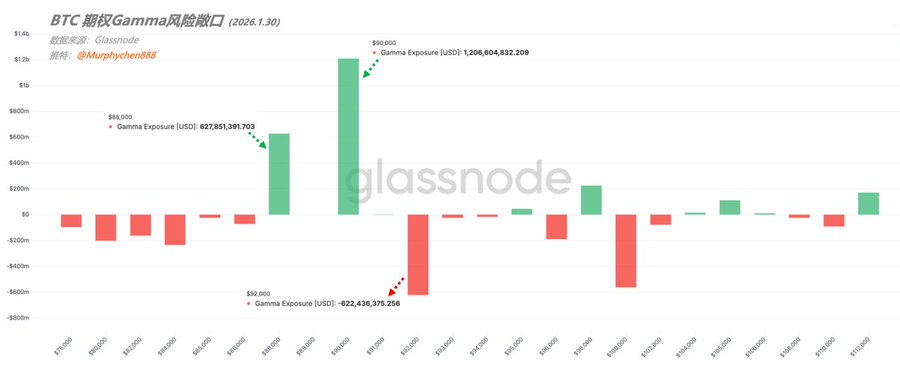
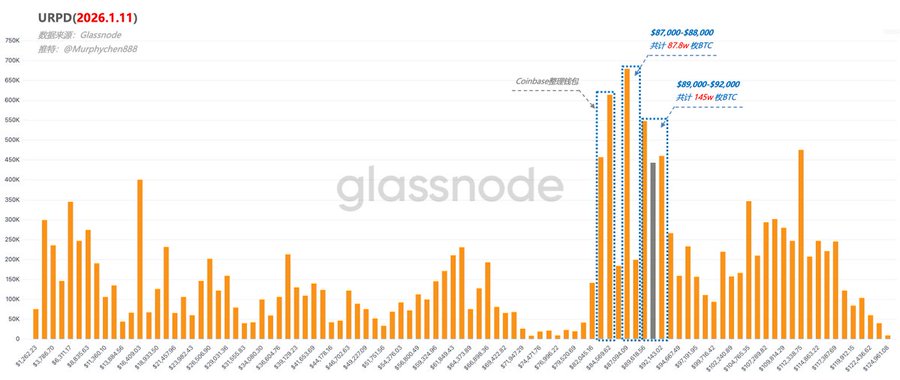
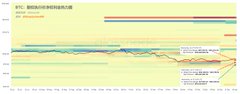
Capital Structure → Position Structure → Market Direction Options Gamma Exposure (GEX) essentially tells us: when BTC price swings, are options market makers “stabilizing the price” or are they “forced to chase the move”? Market makers (MMs) typically don’t take directional bets—they just profit from the spread. When they sell/buy options, they’re exposed to changes in Delta and Gamma. As price moves, Delta shifts (that’s Gamma in action). To stay risk-neutral, MMs must instantly buy or sell BTC spot (or futures) to hedge. In a Long Gamma setup, when price drops, MMs buy BTC; when price rises, they sell to hedge—creating a “Gamma gravity.” On the flip side, in a Short Gamma scenario, if price dips, MMs are forced to sell BTC; if it pumps, they’re forced to buy BTC—acting as a “volatility amplifier.” (Figure 1) From Figure 1, on the Jan 30 expiry, there are three key Gamma exposures. Both $90,000 and $88,000 are in Long Gamma territory (green bars), with GEX at $1.2B and $628M respectively. This means a ton of options are stacked here, and the hedging power of MMs is strongest—any short-term volatility gets sucked back in. You can think of this as a “super Gamma magnet,” a zone that’s tough to break down through in the short term. In contrast, $92,000 is a major Short Gamma zone (red bar), with GEX at -$622M. Totally opposite dynamics! Once price enters this area, the MM’s hedging logic flips—they’re no longer stabilizing but instead driving price. If price holds above, it can easily accelerate and break out; if the breakout fails, it’s likely to get pulled back quickly into the lower Long Gamma “magnet zone.” (Figure 2) Looking at the densest position stacks in the current structure—aside from the $83k-$84k affected by Coinbase wallet shuffling—the $87,000-$88,000 and $89,000-$92,000 levels match perfectly with the Gamma exposure zones. Linking this with URPD’s BTC position structure, it’s clear: “Capital flows shape position structure, which creates support/resistance, ultimately steering market direction.” That’s why, when analyzing URPD data, we often see short-term positions flipping rapidly—not just high-frequency trading by retail or internal wallet shuffling by institutions, but necessary moves forced by the market’s trading mechanics. Bottom line: whether you look at capital flows or position structure, downside is limited short-term, and upside resistance is lighter. The only question is how long this chop lasts without an external catalyst. ---------------------------------------------- Bitget VIP: lower fees, wilder perks
This article is machine translated
Show original

Murphy
@Murphychen888
01-08
对近期各数据的梳理以及当前行情的思考
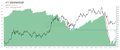
正如我们之前所预想的,当LTH已实现盈亏比降到一定程度时,他们的派发行为就会减缓甚至停止。目前LTH已实现盈亏比已降至本轮周期最低点(如图1),距离盈亏平衡线仅一步之遥(红色线)。如果再低,意味着就连长期筹码都要亏损卖出,这显然是LTH不愿接受的事情。 x.com/Murphychen888/…
Sector:
From Twitter
Disclaimer: The content above is only the author's opinion which does not represent any position of Followin, and is not intended as, and shall not be understood or construed as, investment advice from Followin.
Like
Add to Favorites
Comments
Share
Relevant content


