Let’s talk about my perspective on macro, cycles, and pricing.
Some friends reminded me not to analyze only micro factors without considering the macro environment. I totally agree! In this cycle, unless you’re a complete newbie, everyone should understand the tight correlation between crypto and macro trends.
What I do isn’t just looking at on-chain data while ignoring macro—rather, I use on-chain signals to identify structural shifts, and then verify them with macro sentiment. To expand, it goes like this:
We all know the market trades on expectations, not events. So there’s a transmission path:
Macro shapes expectations → Expectations affect sentiment → Sentiment drives behavior → Behavior changes supply and demand → Supply and demand determine price (and these factors can also feedback on each other).
We analyze macroeconomics and monetary policy hoping to spot expectations early, but the market’s interpretation is always complex and multi-threaded. It’s tough for regular investors to predict or trade macro ahead of time with precision.
That’s why we study and try to use on-chain data to observe shifts in participants’ sentiment and behavior, then reverse-verify the expectations created by macro events—improving our probability-based trading decisions.
Since we’re talking about macro guidance for trading, let’s recap the potential risks and impact on risk assets during the second half of the last bear market:
September 2022–March 2023:
1. The Fed aggressively raised rates by 75bps per meeting, hiking a total of 175bps in six months, draining liquidity from risk assets.
2. Consequences of rate hikes hit hard: first FTX blew up, then crypto-friendly banks like SVB, Signature, and Silvergate collapsed.
3. Core CPI was still above 5.5% at the start of 2023, leaving the Fed zero room to cut rates.
4. Russia-Ukraine war shocked energy and food supply chains, Europe faced a natural gas crisis.
If you could time travel back to that period and look at it purely from a macro angle, would you call it a bear bottom? No way! Most retail thought new lows were coming, with BTC headed for $8k.
But looking back, that was exactly the “coming out of deep bear” phase, switching to a new “bear-to-bull transition.”
Now, May 2026 risk environment:
1. Geopolitical conflicts are spiking oil prices, flipping inflation—which had cooled to 2.4%—back up.
2. Inflation is resurging across housing and food; the breadth of inflation is trickier than a pure energy shock.
3. The Fed is stuck: in April, they held rates flat, but for the first time, four FOMC members dissented; the market is pricing a nonlinear “cut then hike” path.
4. Yen rate hike pressure is rising, US equities are at highs, and the AI bubble risks a correction.
Each of these could be a deep-dive article. These are the macro uncertainties everyone sees and worries about.
That’s exactly why we’re still in a bear market, not a bull. Every bear has its own historical context and impact—there’s always a reason.
But flip it around: If inflation, geopolitics, fiscal and monetary issues were all resolved and crystal clear, would BTC still be at this price?
September 2022–March 2023: The bear bottom was right under our noses given the macro backdrop. So how can we be 100% sure that’s not the case now?
You can be bearish, but tell me—is your bearish outlook for 2 weeks, 2 months, or 2 years?
If it’s 2 years, you should be buying US Treasuries—crypto isn’t for you. Your risk appetite is ultra-low, so you should stick to capital-preserving, yield-focused products.
As for me, I’m bullish on “long-term positioning.” I don’t believe BTC will be lower than today two years from now.
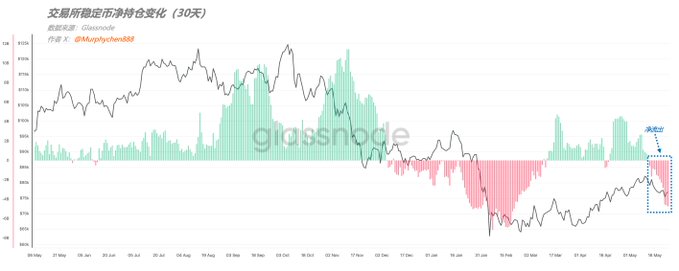
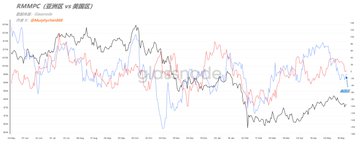
So it’s not contradictory, just a matter of timeframe (my short-term bearish view has already been covered via RMMPC, exchange CVD, USDC rates, and Coinbase premium index).
Despite all the bearish expectations, we can’t ignore the bullish side, right?
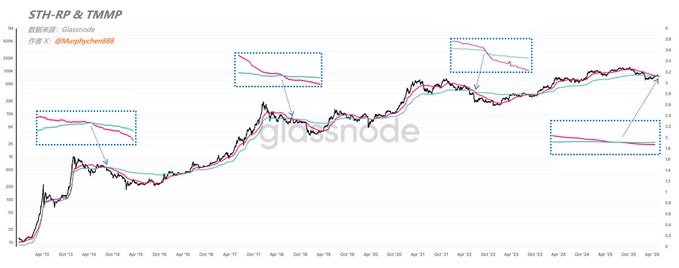
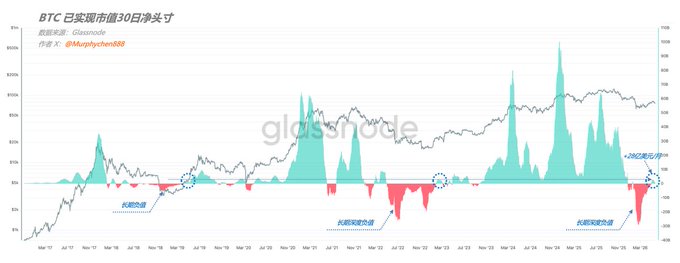
For example: April-May saw massive ETF net inflows, MSTR keeps accumulating, institutions are positioning in options (selling puts below), long-term holders’ net positions are at all-time highs...
Are the funds entering around $70k blind to macro risks? Is their structural research weaker than retail?
I doubt it. Institutions fundamentally differ from retail in terms of capital, risk management, information access, and tools, so their considerations and angles are just not the same.