

Author: Michel Athayde
Warning: This is a sobering "report".
Have you ever had this misconception:
"Four hours is too slow. I want to do short-term trading in five minutes, with a 1% compound interest rate per day. In a year, I'll be the richest person in the world."
"Making money through spot trading is too slow. I use 3x or 5x leverage. As long as the direction is right, I can earn several times more money than others."
To verify these "get-rich-quick fantasies," we not only backtested for 4 hours, but also pulled out 15 minutes (15m), 30 minutes (30m), and 1 hour (1H) to "whip the corpse";
We not only looked at the spot market, but also simulated the real-world outcomes of 200% (2x), 300% (3x), and 500% (5x) leverage positions under extreme market conditions.
The conclusion is extremely harsh: without leverage, after all our haphazard efforts over the past 5 years, 90% of people couldn't even outperform those who simply "buy and hold" cryptocurrencies.
Benchmark data: The "passing grade" you must beat
Before evaluating any strategy, we must first look at how much can be earned by "lying flat". Based on spot data from the past 5 years:
BTC spot trading : +48.86%
ETH spot: +53.00%
(Note: This means that if you bought and uninstalled the app 5 years ago, you would now have a profit of about 50%. This is the "passing grade" that the strategy must beat.)
MACD Strategy Data Summary
I backtested the performance of MACD over the past 5 years across different timeframes and leverage levels for BTC/ETH:
| Chart Label (English) | Meaning (in Chinese) |
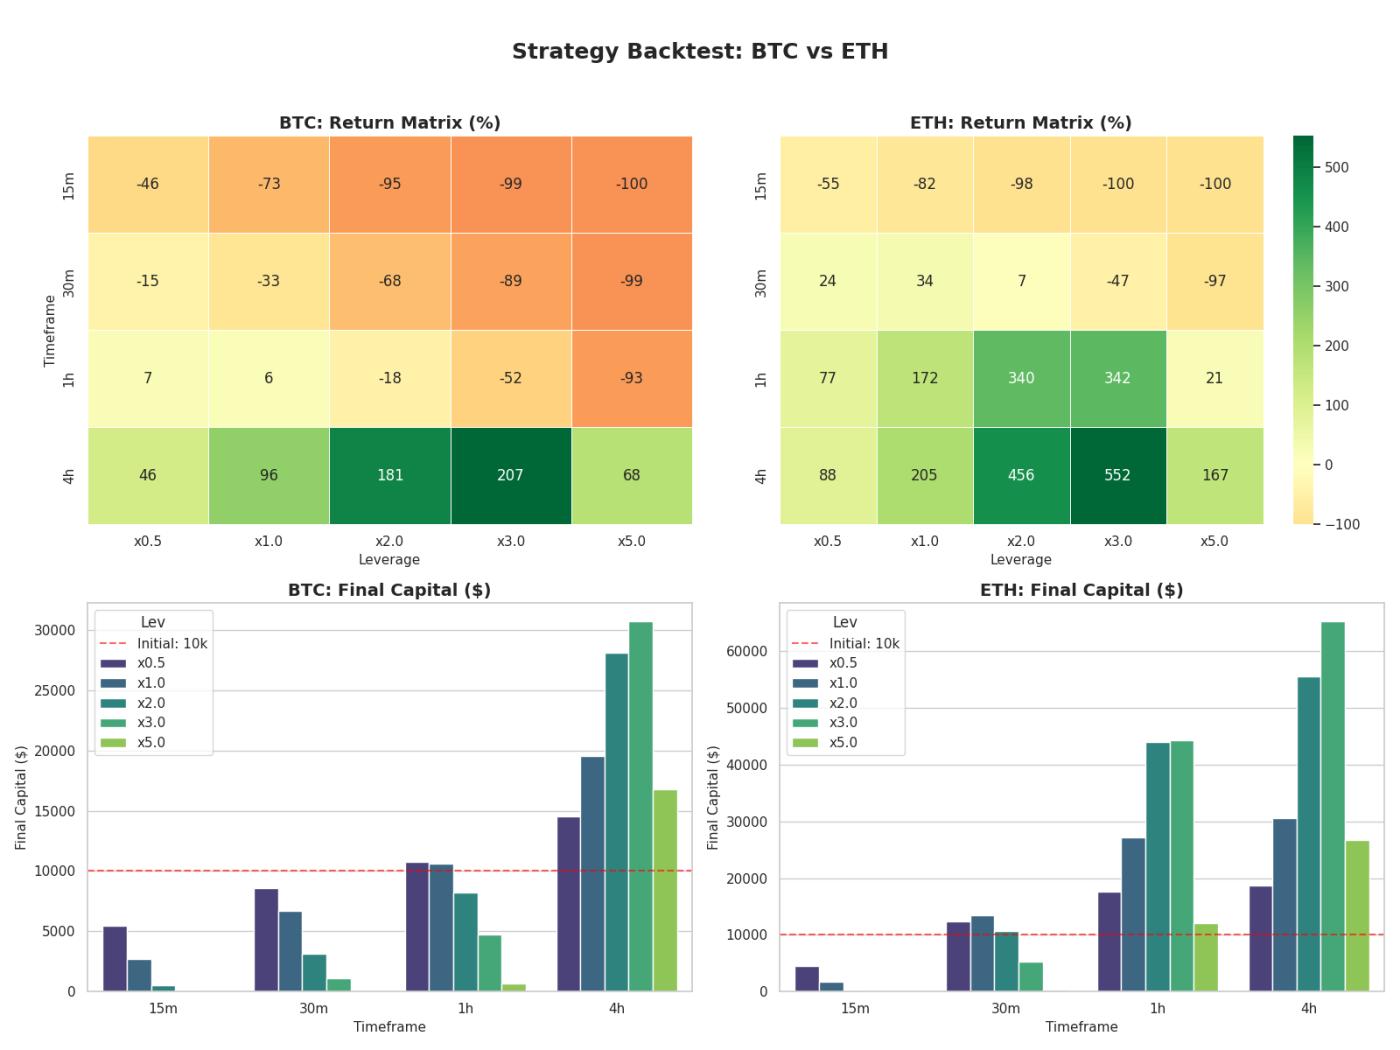
| Strategy Backtest | Strategy backtesting analysis |
| Return Matrix (%) | Return rate heatmap (the redder the color, the greater the loss; the greener the color, the greater the profit). |
| Final Capital ($) | Final funding (principal of 10,000 U) |
| Timeframe (TF) | Time periods (15m, 30m, 1h, 4h) |
| Leverage (Lev) | Leverage ratio (x0.5, x1.0, x2.0, x3.0, x5.0) |
| Initial: 10k | Initial principal (red dashed line benchmark) |
Top left & top right (Heatmap - Yield):
Danger Zone (Red/Dark Orange): Concentrated in short timeframes such as 15m and 30m . Especially with high leverage (x3.0, x5.0), funds can almost be wiped out (-99%, -100%).
The gold zone (dark green): concentrated in the 4-hour timeframe. ETH's performance is particularly outstanding in the 4-hour timeframe, with almost all blocks being green.
Bottom left & bottom right (bar chart - final funds):
Red dashed line (10k): This is the break-even point. A bar below the red line represents a loss, and a bar above the red line represents a profit.
BTC vs ETH: Note the 4-hour chart bar for ETH in the bottom right corner. When you use x2.0 or x3.0 leverage, the capital bar is extremely tall, far exceeding the performance of BTC. This confirms that ETH's volatility brings higher excess returns in trending markets.
I. A painful lesson: 90% of short-term trading is "negative optimization".
The data reveals a harsh reality: on smaller timeframes (15m, 30m, 1h), the MACD strategy not only failed to generate excess returns (Alpha), but also significantly underperformed "foolish coin hoarding" due to excessive trading and wear and tear.
1. BTC's "busy activity" in the 1-hour timeframe
Strategy performance : BTC 1h x1.0 yielded a return of +6% .
Benchmark performance : The return on BTC spot holding is +48.86% .
In-depth analysis:
On a 1-hour timeframe, you might diligently monitor the market for 5 years, trade thousands of times during MACD golden cross and death cross, pay huge transaction fees to the exchange, and ultimately only earn 6%. But if you do nothing, you could earn 49%.
Conclusion: Running a MACD strategy on a 1-hour timeframe is essentially destroying value. Your series of operations may seem aggressive, but the returns will turn from positive to negative (relative opportunity cost).
2. A complete collapse in the short term (15m / 30m)
All strategies : all losses or margin call.
Compared to the benchmark : Compared to the +50% positive return of accumulating coins, the short-term strategy is a -100% devastating blow .
Cause of death analysis :
Noise : Fluctuations at the 15m level are mostly meaningless random walks.
Fee erosion : Frequent opening of positions incurs transaction fees and slippage, which eat away at the principal like termites.
Mental breakdown : Frequent stop-loss orders lead to distorted trading strategies.
II. The only comeback: "Excess returns" in the 4-hour timeframe
Only when the timeframe is extended to 4 hours does the MACD strategy demonstrate its ability to overcome "hoarding" strategies. This is the sole reason for the existence of quantitative trading.
1. BTC 4h: A thrilling victory
MACD x1.0 (Spot) : Return approximately +96% .
Baseline for holding cryptocurrencies : +48.86%.
Winning logic:
The MACD successfully helped BTC avoid the main downward wave of a deep bear market (such as the major drop in 2022) on the 4-hour chart. Although it missed out on some of the early and late stages of the bull market, the advantage of being out of the market and avoiding risk ultimately allowed it to outperform those who held on to their positions.
2. ETH 4h: Absolute crushing victory
MACD x1.0 (Spot) : Return approximately +205% .
Accumulation benchmark : +53.00%.
MACD x3.0 (Optimal Leverage) : Return +552% .
Winning logic:
ETH exhibits extremely strong trend-following behavior. While those who held onto their holdings enjoyed the price increases, they also fully absorbed the -80% drawdown. In contrast, the MACD strategy, by remaining out of the market during the bear market, preserved profits and compounded them in the next bull market. The 4x return compared to simply holding onto the holdings (205% vs. 53%) demonstrates the immense value of market timing in ETH.
III. The true meaning of leverage: Does it amplify the "win rate" or the "gambling instinct"?
By combining benchmark data, we can redefine the role of leverage.
1. x2.0 - x3.0: The Secret of the Golden Range
BTC 4h x3.0 (+207%) vs BTC holding (+48.86%):
With 3x leverage, the strategy amplified returns by 4x. This is a healthy amplification ratio, indicating that the strategy captured the true trend, and the leverage acted as a catalyst.
ETH 4h x3.0 (+552%) vs ETH hoarding (+53.00%):
Returns were amplified 10 times! This is the pinnacle of quantitative trading – achieving leapfrog returns on highly volatile assets with appropriate leverage and the right timeframe.
2. x5.0: The "Inverted" Yield Curve
ETH 4h x5.0 (+167%):
Note! While it outperformed accumulating coins (+53%), it significantly underperformed the low-leverage strategy (+552%).
Warning : When you increase your leverage to 5x, you are essentially working for the exchange (high funding fees) and giving money away to the market (high volatility losses). You bear the risk of being liquidated and losing everything, but only receive mediocre returns.
IV. Your "Death Matrix" Report
To put your mind at ease, we've listed the final outcomes for different configurations.
| target | cycle | Leverage ratio | state | Final rate of return | Ending Evaluation |
| BTC | 15m | x5.0 | Margin call | -100% | You're doomed . It's pure gambling; the transaction fees alone will bankrupt you. |
| BTC | 15m | x1.0 | -73% | Slow suicide. You might as well put your money in the bank. | |
| BTC | 1h | x1.0 | +6% | Busy doing nothing. Underperformed my cryptocurrency holdings (+49%), wasting 5 years of my youth. | |
| BTC | 4h | x1.0 | ✅ | +96% | Excellent . Outperformed cryptocurrency hoarding by 100%, demonstrating a stable mindset. |
| BTC | 4h | x3.0 | ✅ | +207% | Excellent . Maximizes profits while keeping risks under control. |
| --- | --- | --- | --- | --- | --- |
| ETH | 15m | x5.0 | Margin call | -100% | Certain death . A victim of the noise trade. |
| ETH | 1h | x1.0 | ✅ | +172% | It's alright. ETH is very volatile; you can make a little money in the short term, but it's tiring. |
| ETH | 4h | x1.0 | ✅ | +205% | Excellent . Four times the returns of accumulating cryptocurrency, and without the need to stay up all night. |
| ETH | 4h | x3.0 | ✅ | +552% | The King . This is the Holy Grail range for quantitative trading. |
| ETH | 4h | x5.0 | ✅ | +167% | It's a lose-lose situation . The risk has increased dramatically, while the returns have decreased (funding costs + wear and tear). |
V. Final Decision Guidelines: What should you do?
Based on the passing grade of accumulating coins (+50%) , we offer the following final strategy recommendations:
If you don't want the hassle/don't have the time/have a bad attitude :
Strategy : Pure accumulation (Buy & Hold) or MACD 4h x1.0 (spot).
Expected return: ~50% - 100%.
The cost : You have to endure asset drawdowns, but that's a million times better than losing money through reckless trading.
If you want to outperform the market (BTC) :
Strategy : MACD 4h (x1.5 - x2.0).
Expected return: ~150% - 200%.
Key point : Strict stop-loss is essential; only trade on the 4-hour chart; never look at the 15-minute chart.
If you are looking for excess returns (ETH) :
Strategy : MACD 4h (x2.0 - x3.0).
Expected return: ~400% - 550%.
Key point : This is the best sweet spot. Take advantage of ETH's high volatility with moderate leverage. Remember not to exceed 3x .
If you are a gambler/short-term trader :
Strategy : MACD 15m/1h + x5.0 or higher.
Expected : -100% (to zero) .
Warning : Data proves this cannot outperform accumulating cryptocurrency, and is even less effective than donating the money.
Key conclusions
"Since holding cryptocurrency for five years only yields about 50% returns, this actually proves the value of excellent quantitative strategies."
However, this value is limited to the 4-hour level.
In cycles under one hour, all your efforts will only make things worse; you might as well just lie down and relax.
Only by standing at the golden intersection of 4H + 3x can you truly laugh at those who "hold on to the bitter end".
(The data in this article is based on historical backtesting and does not represent future returns. The market is risky; leverage should be used with caution.)


