

Monero price has stabilized after a sharp drop, but the recovery hasn't been easy. After peaking at nearly $800 on January 14, 2024, XMR corrected by approximately 33%, knocking out many new retail investors. Since then, the price has been compressed within a narrow consolidation zone, suggesting the potential for an upward trend continuation pattern.
At first glance, the current structure seems to lean toward an uptrend. However, when combining momentum indicators, money flow, and spot trading action, the overall signal is contradictory. While a breakout is possible, the supporting conditions are not yet fully aligned.
Large amounts of money are flowing in, but buying on dips is still uneven.
On the 12-hour chart, Monero has formed a flag-shaped accumulation pattern after a sharp decline. The price of XMR has now broken above the upper trendline of this pattern, suggesting the possibility of a larger upward trend continuing.
What's noteworthy about this rally is the money flow behavior. The Chaikin Money Flow (CMF) indicator—used to track large Capital inflows and outflows from an asset—avoided a deep dip during the accumulation phase and is showing signs of rising. Currently, the CMF is around 0.05. A breakout above 0.06 would strengthen the breakout signal. If the CMF continues toward the 0.30–0.32 range, as in previous strong rallies, that would be even stronger confirmation of an upward trend.
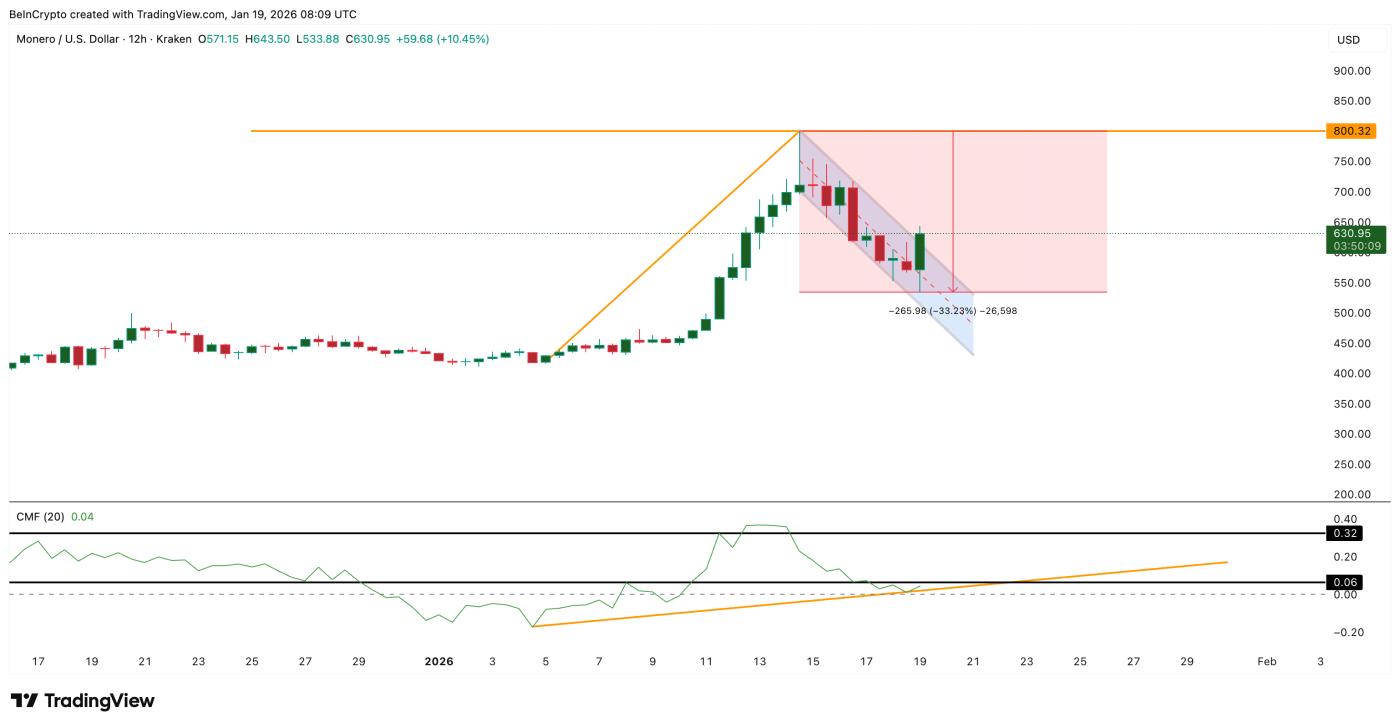 Breakthroughs have occurred, but they are still weak: TradingView
Want more analysis on similar Token ? Sign up for editor Harsh Notariya's daily Crypto newsletter here .
However, buying power during price dips tells a different story. The Money Flow Index (MFI) — which combines price and volume to measure buying pressure — continues to decline. Despite a slight price increase from January 10th to January 19th, 2024, the MFI fell below 61.7 instead of bouncing back up.
This divergence suggests that buying pressure isn't yet strong, even though the price is attempting to break higher.
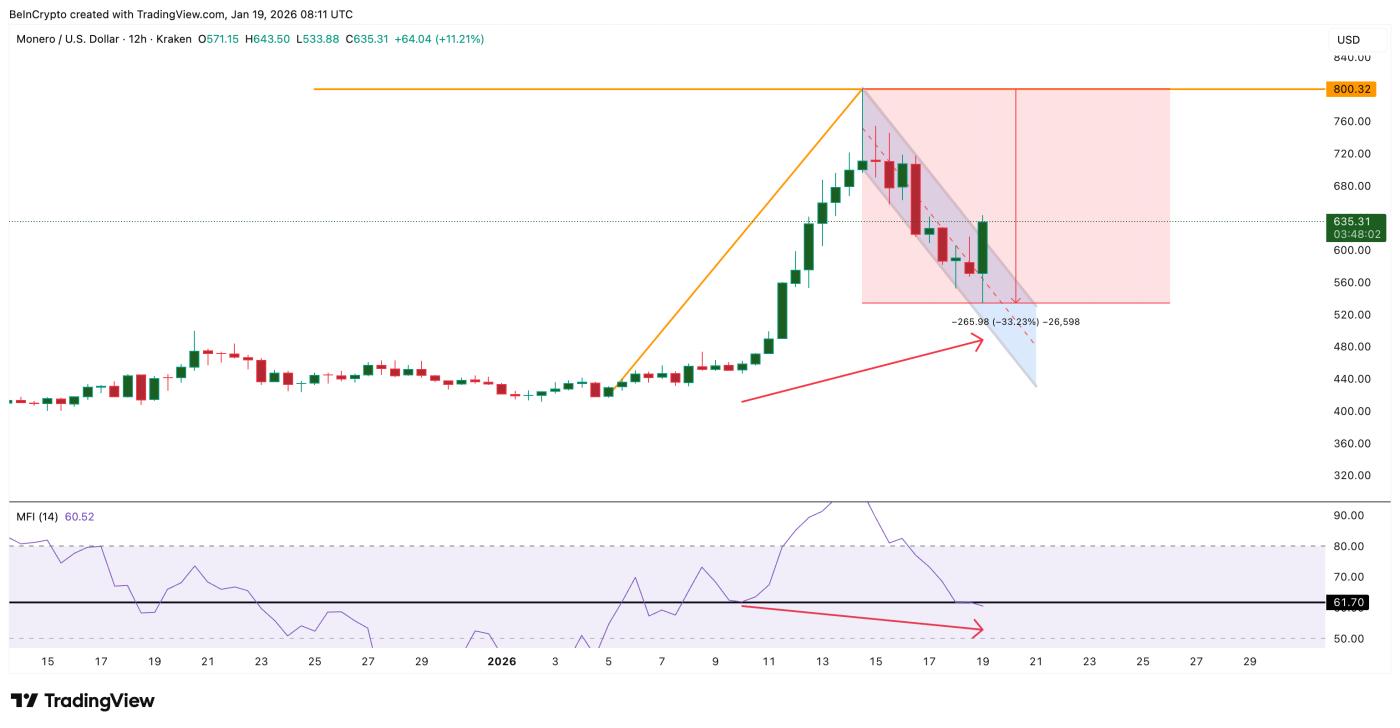 Buying pressure is weakening in the bearish zone: TradingView
In summary, cash flow is improving, but participation remains fragmented and not truly uniform.
Spot money flow reverses during breakout, making retail investors cautious.
Behavior in the spot market also adds to the tension.
On January 18, 2024, Monero recorded a large outflow of approximately $23.95 million worth of coins from the exchange . This indicated hoarding activity, as Token were transferred to individual wallets. However, as soon as a breakout candle appeared, that trend reversed.
On January 19, 2024, the flow of transferred coins shifted to deposits on exchanges, totaling approximately $2.31 million. This development suggests that some individuals took advantage of the breakout to list their coins on exchanges, often a sign of short-term profit-taking.
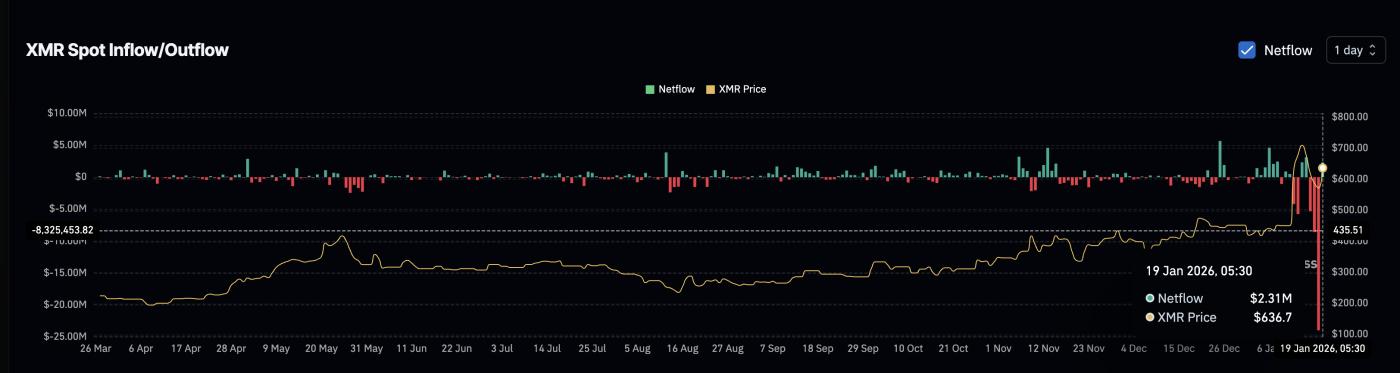 Selling pressure returns: Coinglass
This timing is crucial. Typically, a sustainable breakout requires continued outflow of coins from exchanges to confirm strong buying power. If coins are deposited onto exchanges right at the breakout point, the risk of being rejected from further gains is higher than the likelihood of maintaining the upward momentum.
Therefore, although the XMR price chart is expanding, spot trading behavior shows investor hesitation.
The risk of a Longing squeeze emerges when key price levels for Monero are being watched.
Monero 's breakout attempt shouldn't be judged solely on spot trading or cash flow. Its Derivative position makes the price structure even more fragile, and nearby price levels become even more crucial.
On Binance's XMR/ USDT perpetual market, the 30-day trading position is strongly skewed towards Longing positions. The total accumulated Longing liquidation value is approximately $13.94 million, while Short are only around $5.72 million. The current market is approximately 70% skewed towards Longing positions.
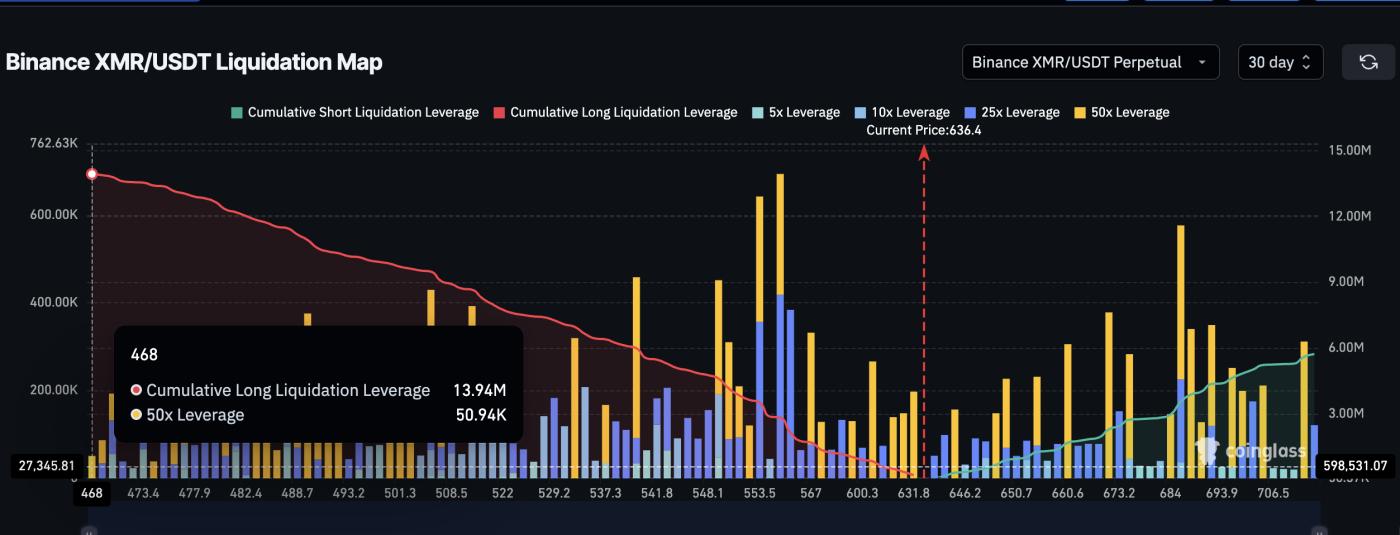 Risk of Longing squeeze with XMR: Coinglass
This difference is crucial because leverage is primarily concentrated below the price, not above it. When the market is heavily Longing, dips tend to be faster and more forceful than rallies, easily leading to a Longing squeeze.
This adds further pressure to the current Monero price structure.
Looking at the chart, Monero has broken above the upper boundary of the flag pattern on the 12-hour timeframe. As long as the price remains above this breakout zone, the uptrend remains technically valid. The upside potential from the previous pillar still points toward the $910–$1,150 area.
However, for this uptrend to become stronger, Monero needs a clear 12-hour closing candle above $800 – the previous peak. If it fails to reclaim this level, the upward momentum risks weakening due to leverage pressure.
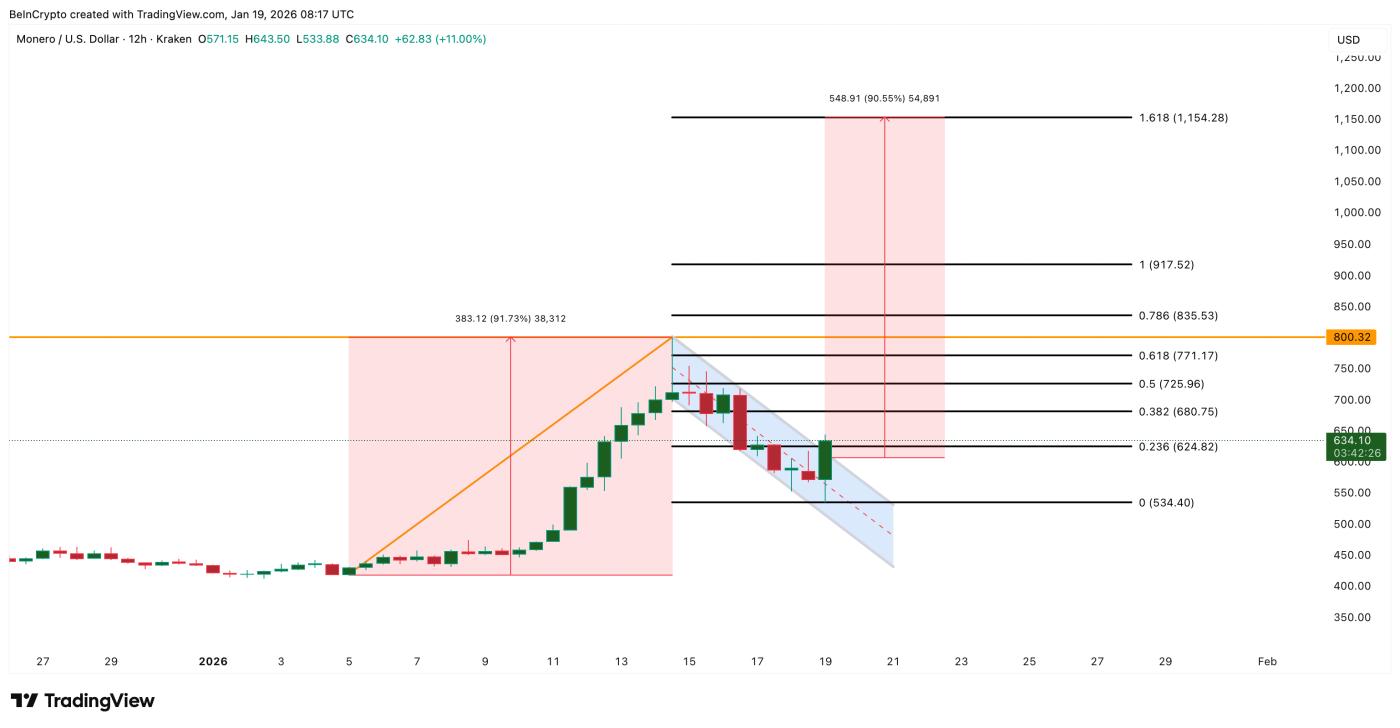 Monero price analysis: TradingView
Conversely, $620 is a dangerous zone to watch. If the price falls sharply and remains below this level, the majority of the leveraged Longing positions worth $13.94 million will be liquidated. If this happens, a forced sell-off could turn the recent breakout into a failure, instead of a strong upward move. If the $530 mark is lost, most Longing positions will be liquidated and the bullish flag pattern will no longer be valid.
In summary, Monero is currently in a rather sensitive zone. The chart suggests a potential rise to $1,150, but the Derivative system with too many Longing positions increases the risk. Until the price breaks above $800, a breakout remains quite difficult.


