
Recent market trends have exhibited a clear characteristic: after a one-sided trend ends, it often enters a period of consolidation . As long as the trend structure remains fundamentally unchanged, rebounds during a downtrend are often brief but valuable opportunities. This is similar to how, during a previous one-sided uptrend, every pullback was a buying opportunity.
The current market situation is completely different from the one-sided rise during the New Year's holiday. Once the price of cryptocurrencies reverses, it's like a former lover who has changed their mind; it's hard to turn back easily. At this time, for traders, patient observation and cautious positioning are the safer choices.
Key Analysis of Current Market Trends
Especially after this sharp drop, with the market fluctuating below 90,000, extra caution is needed. This phase can be interpreted in two ways:
- The downtrend isn't over : there may be a second dip to test the bottom.
- The bottoming process in a bull market : The market needs a process of repeated bottoming.
Therefore, we should not focus solely on one-sided market trends, but rather adopt a range-bound trading strategy to flexibly respond to market changes.
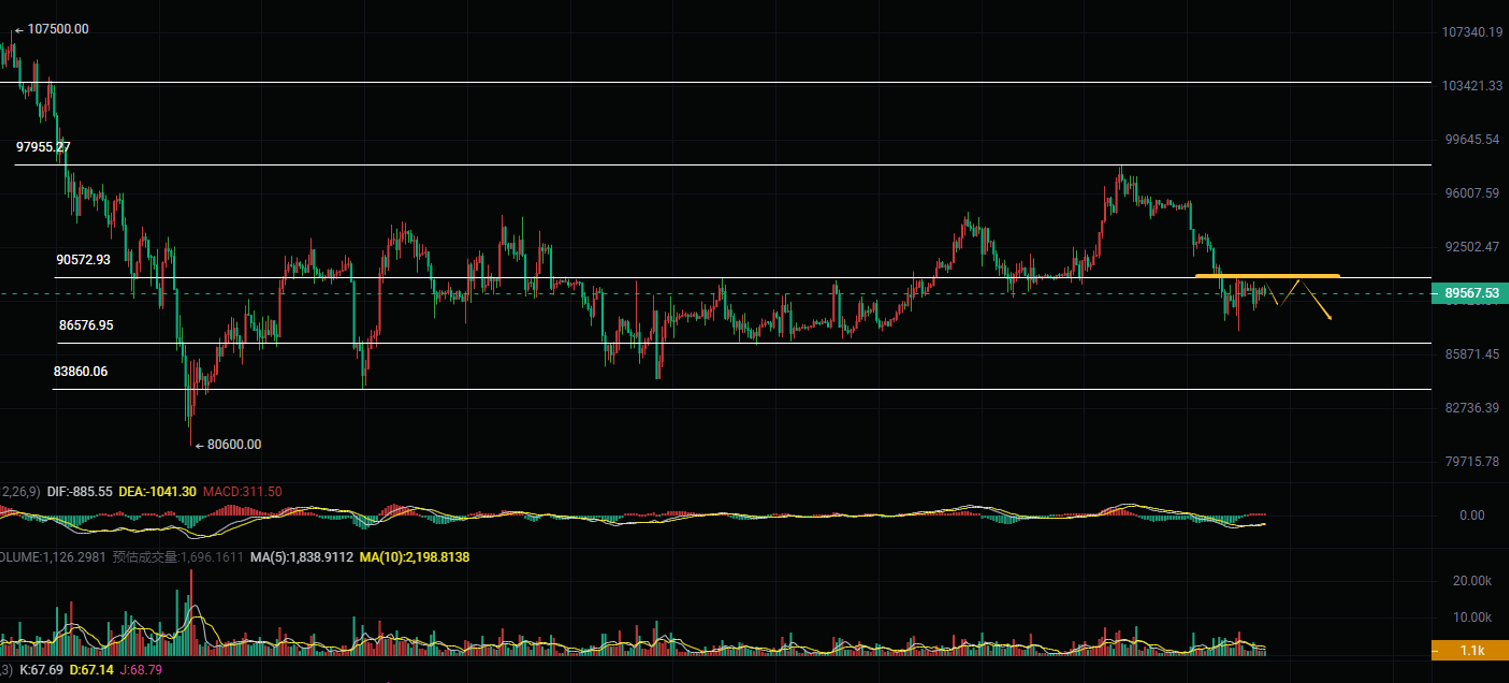
Technical indicator analysis
Bitcoin (BTC) Technical Analysis
Daily chart : After a sharp decline, the market has gradually stabilized and rebounded slightly, but remains in a consolidation phase overall.
Hourly chart : A high-level consolidation pattern has formed, with the current price approaching the previous swing low. It may test support in the short term.
Key Indicator Interpretation
MACD indicator : The hourly MACD histogram has turned from negative to positive, but the momentum is weak. The DIF and DEA are still below the zero line, indicating that the strength of the bulls and bears is not yet clear. The daily MACD is in a recovery phase, with weakening momentum.
RSI indicator : The hourly RSI value is 48.9, which is in the neutral zone with no obvious overbought or oversold signals. The daily RSI remains around 50, indicating a cautious market sentiment.
EMA Moving Average System : On the hourly chart, the 7-period and 30-period EMAs are converging, with prices oscillating around the moving averages. On the daily chart, the 7-period and 30-period EMAs are diverging downwards, with significant resistance above the 120-period EMA.
Operational strategy recommendations
The strategy for the end of the week remains primarily shorting, with short-term entries and exits focused on seizing opportunities . It's important to note that the price levels are increasingly lower, and it's not recommended to hold short positions for the extended periods as in previous days; be mindful of the possibility of a trend reversal later on.
Bitcoin Trading Strategy on January 23
- Short selling strategy : Short in the 90500-89700 range, with a stop loss above 91300, and a target of 88700-87700.
- Long position strategy : Long in the 87500-88300 range, stop loss below 86700, target 89700-90500.
Ethereum Trading Strategy on January 23
- Short selling strategy : Short in the 3000-2970 range, with a stop loss above 3030, and a target of 2900-2870.
- Long position strategy : Long in the 2860-2890 range, stop loss below 2830, target 2950-2990.
Risk Warning : The above analysis and strategies are for reference only. The market is risky, and caution is advised when trading. There may be a delay in the publication of this article; please refer to real-time strategies for specific trading decisions.