

Bitcoin's price has been virtually unchanged over the past 24 hours. BTC is trading sideways around $89,500, despite a nearly 6% weekly decline. On the surface, it appears the market is entering a quiet consolidation phase, but the chart tells a different story.
Numerous technical signals and on-chain data indicate a tug-of-war is currently underway. Buyers are attempting to delay a larger decline, rather than initiating a new rally. Risks are quietly mounting, and an unnoticed "competitor" is beginning to exert influence.
The doji candlestick pattern and the loss of the EMA suggest that BTC investors are only playing defensively, not moving forward.
In the last three trading sessions, Bitcoin has shown doji candlestick patterns with small bodies and long wicks. These candlesticks indicate a state of indecision and a lack of true balance. Sellers are putting downward pressure on the price, while buyers are only stepping in when the price plummets; neither side has a clear advantage.
This development occurred right at the lower boundary of the rising wedge pattern. A rising wedge is a pattern where the price is trending upwards, but the trading range is gradually narrowing; typically, the price will fall sharply when the support area is broken.
If this pattern fails to hold, the price forecast could fall to the $77,300 region, equivalent to a decrease of approximately 13% from the current level.
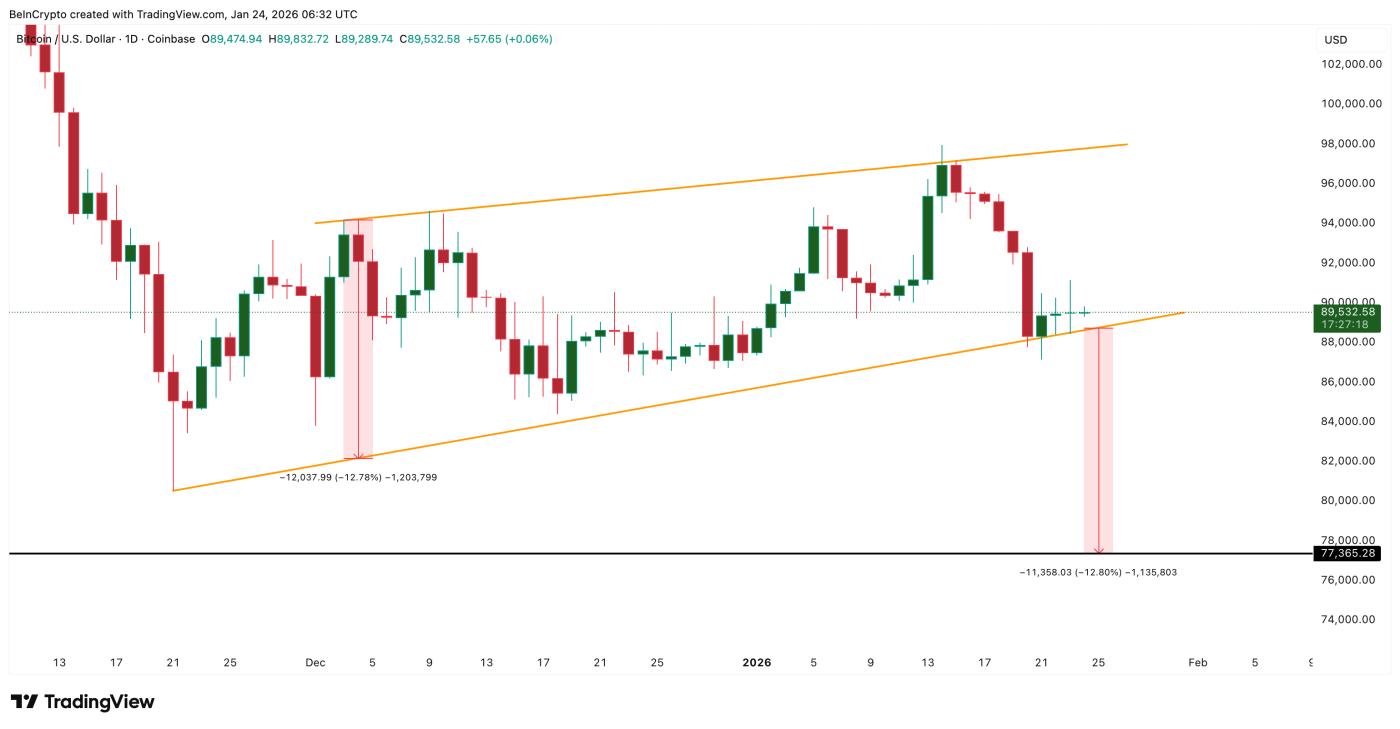 Bitcoin's bearish structure: TradingView
Want to read more analysis of Token like this? Sign up for editor Harsh Notariya's daily Crypto newsletter here .
Technical risk is further increased when considering moving Medium . Bitcoin lost its 20-day exponential moving Medium (EMA) on January 20, 2024. The EMA is a trend indicator that emphasizes recent price movements, helping to quickly reflect short-term changes.
The last time Bitcoin broke below the 20-day EMA was on December 12, 2023, after which the price corrected by about 8%. This time, BTC has fallen by about 5% since breaking support before consolidating sideways. These doji-like candlesticks suggest that buyers are slowing the decline, but haven't yet reversed the market.
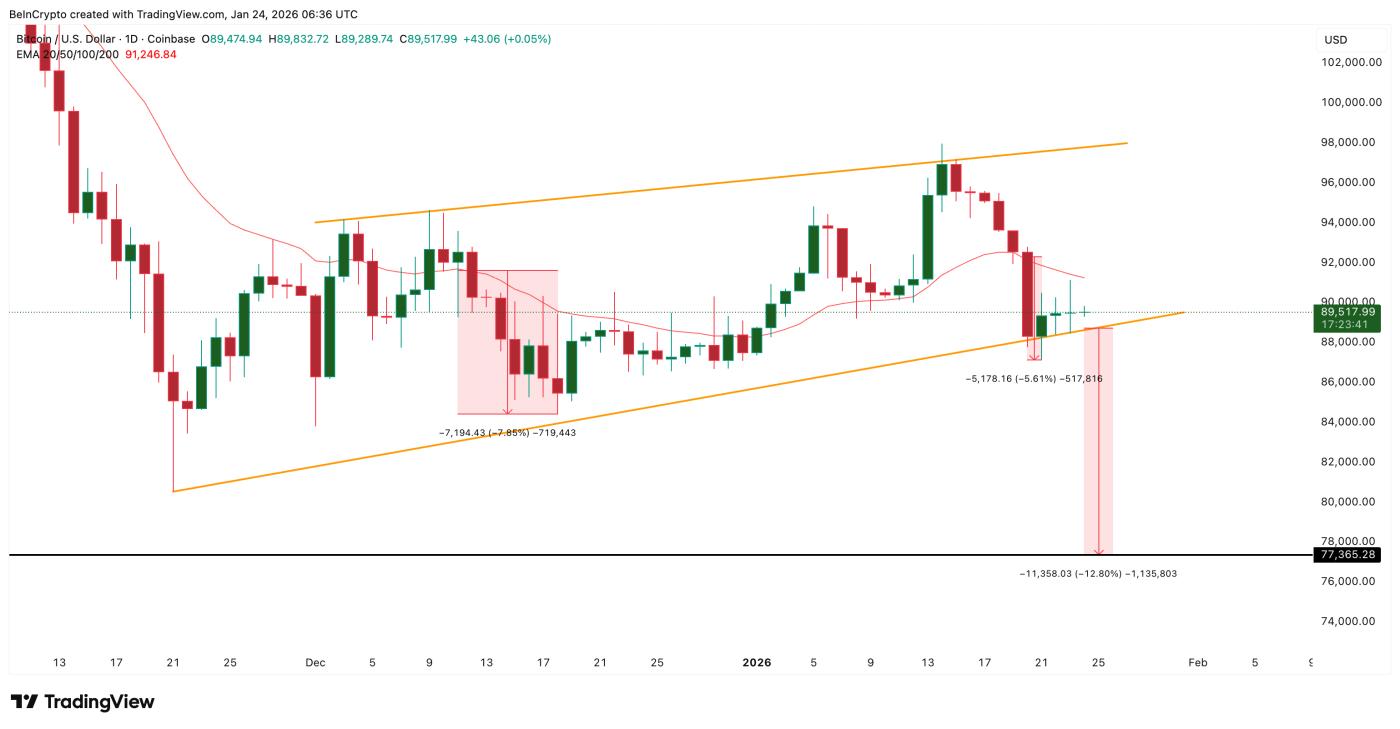 Other technical risks: TradingView
In short, this isn't a typical tug-of-war between bulls and bears. In fact, the buyers are trying to prolong the decline.
So who is still buying, and why is the support gradually weakening?
Long-term investors are still buying, but the pace is slowing down.
on-chain data shows that long-term investors, those holding Bitcoin wallets for 155 days or more, remain net buyers. This group is tracked by the Holder Net Position Change index – which measures the amount of coins long-term investors buy or sell over time.
Over the past two weeks, this indicator has remained positive. This is why Bitcoin hasn't fallen much further yet.
However, this power is gradually weakening.
On January 19, 2024, long-term investors bought approximately 22,618 BTC. By January 23, 2024, this number had decreased to about 17,109 BTC per day. This means that in just four days, buying pressure decreased by approximately 24%.
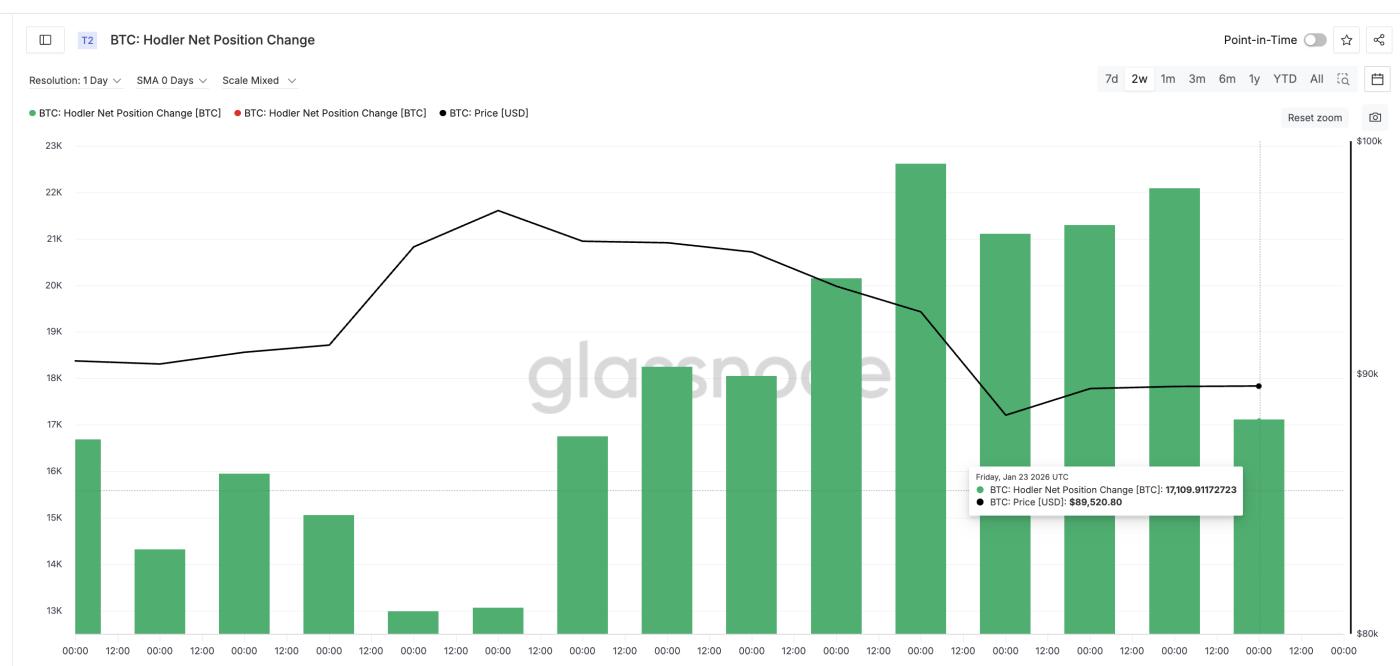 HODLers buying: Glassnode
Thus, long-term investors are still buying, but the buying pressure is clearly weakening. This is consistent with the doji candlesticks appearing on the chart. The support zone remains, but is becoming thinner.
The slowdown in buying power itself isn't necessarily dangerous. The problem is that new selling pressure has emerged at this time.
Miners have emerged as little-known rivals behind the increased risks.
The most overlooked change right now is coming from Bitcoin Miners .
The Miner Net Position Change indicator tracks the change in the amount of Bitcoin held by Miners ' wallets over 30 days. When this indicator drops sharply into negative territory, it means Miners are gradually Dump off their Bitcoin.
On January 9, 2024, Miners reduced their holdings by approximately 335 BTC. However, by January 23, 2024, this number had surged to around 2,826 BTC. This means that selling pressure from Miners increased more than eightfold in just two weeks.
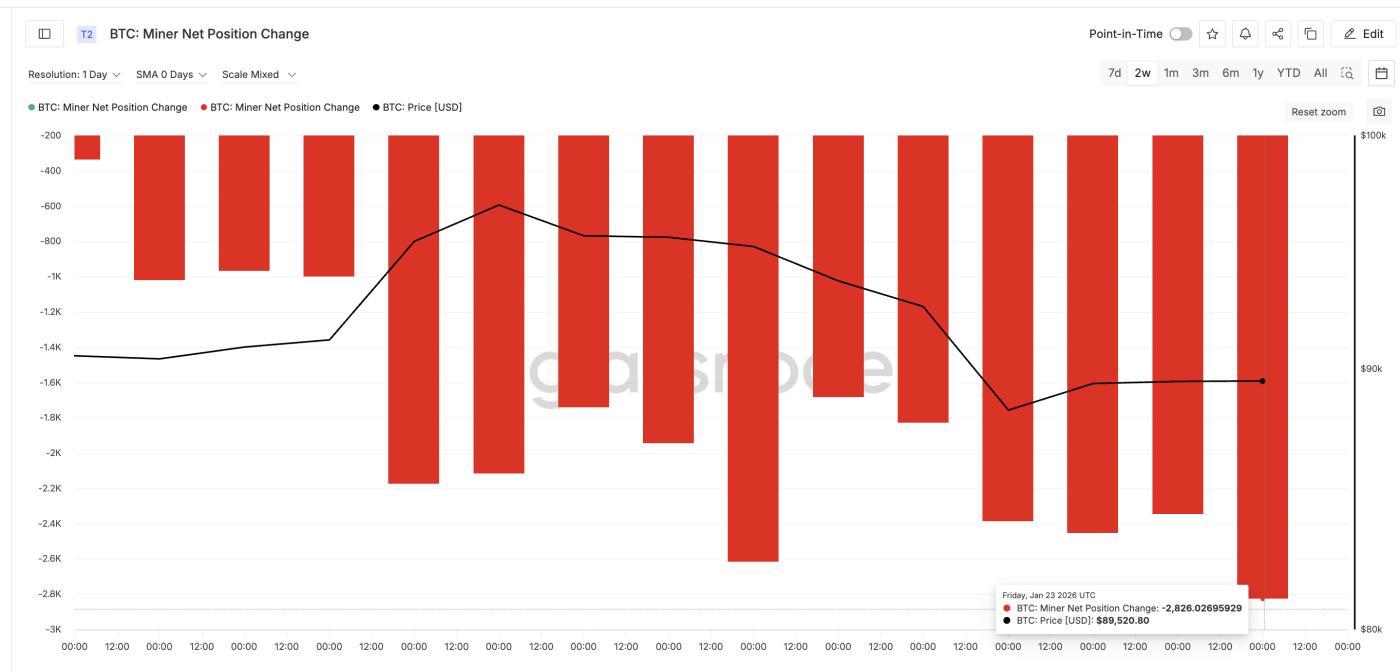 Miners selling: Glassnode
The reason becomes clearer when considering network fees.
According to experts at BeInCrypto, monthly transaction fees on the Bitcoin network have dropped sharply. In May 2025, Miners earned approximately 194 BTC from fees each month. By January 2026, this figure had gradually decreased to around 59 BTC. Thus, income from fees has decreased by approximately 70%.
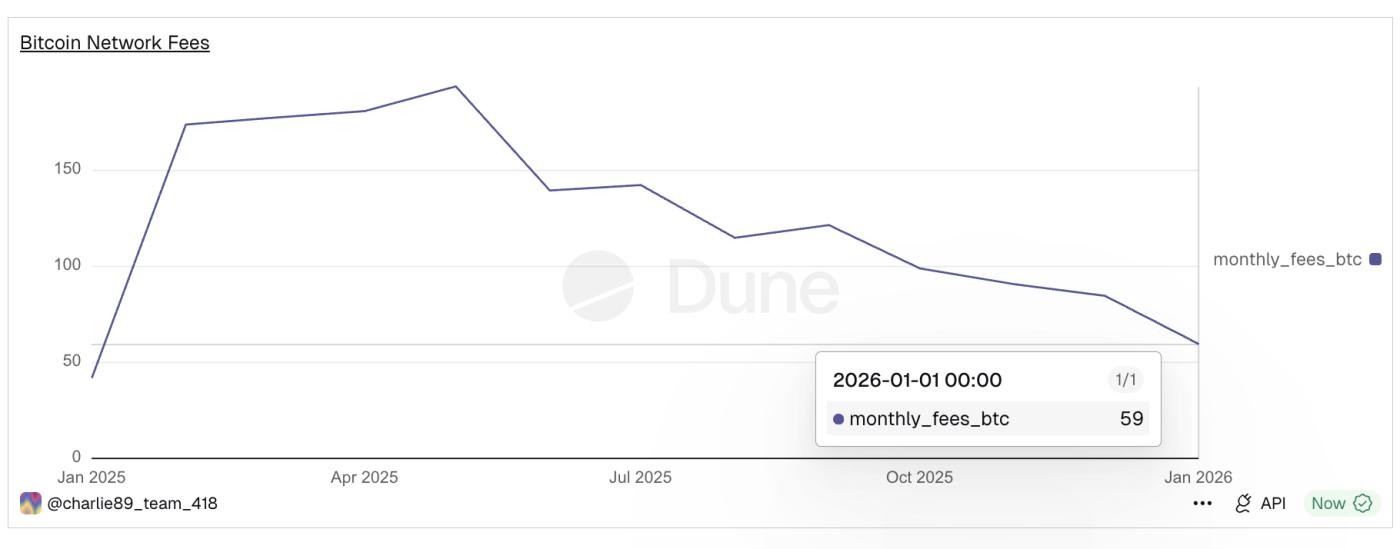 Network fee reduction: Dune
Low transaction fees are narrowing the profit margins of Miners. As revenue decreases, Miners tend to sell Bitcoin to cover operating costs, and this appears to be happening. However, the amount of Bitcoin Miners are selling is not yet very large.
At the same time, the actions of the sharks also showed signs of slowing down. The number of shark addresses increased continuously from January 9th to January 22nd, then started to level off and slightly decrease. This indicates a slight distribution rather than a strong sell-off; however, it further increases the pressure on the Miners .
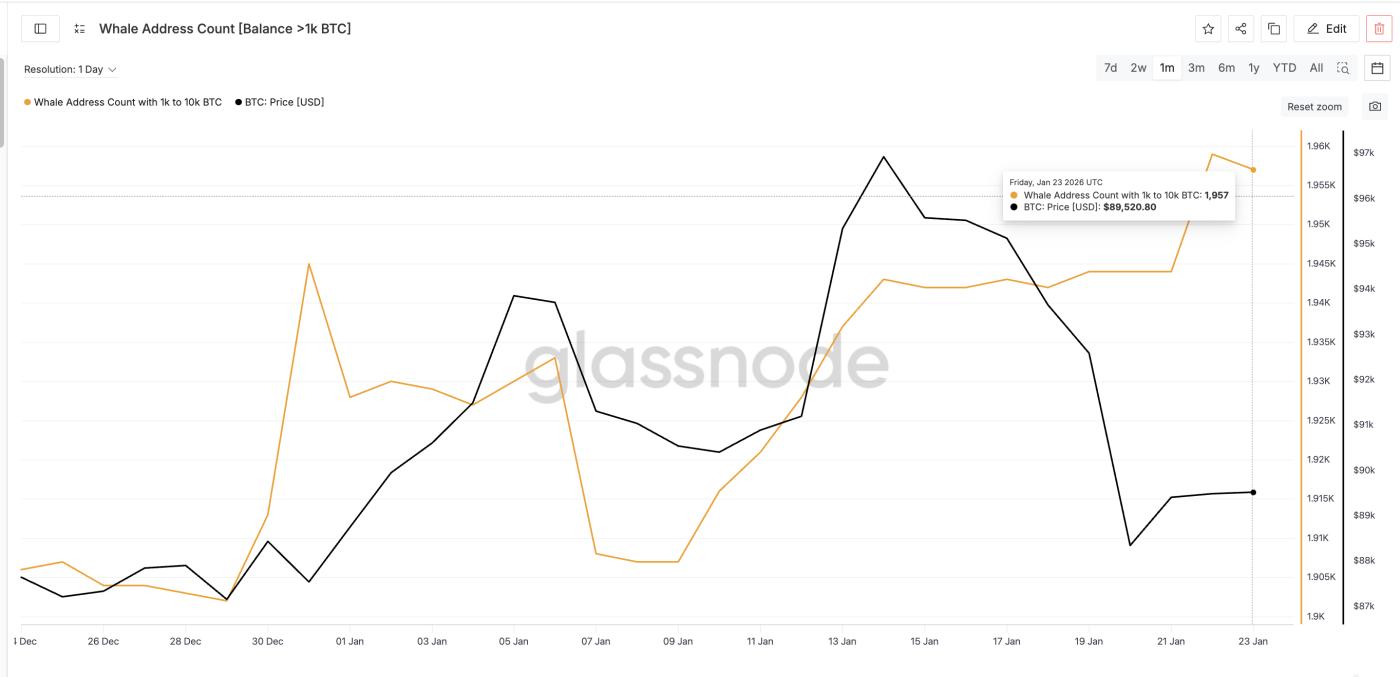 BTC shark address: Glassnode
The current market is heavily dependent on key price levels.
Bitcoin's price levels will determine whether the stalemate is broken or not.
At the current price of nearly $89,500, Bitcoin needs to close the day above $91,000 (an increase of approximately 1.79%) to reclaim the 20-day EMA. If this is achieved, short-term downward pressure will ease and indicate that buyers are regaining the upper hand.
The risk is once again very close.
If Bitcoin closes the day below $88,500 (a drop of approximately 1%), the coin will fall back below the ascending wedge support zone. When this happens, the support zones below will be quickly retested.
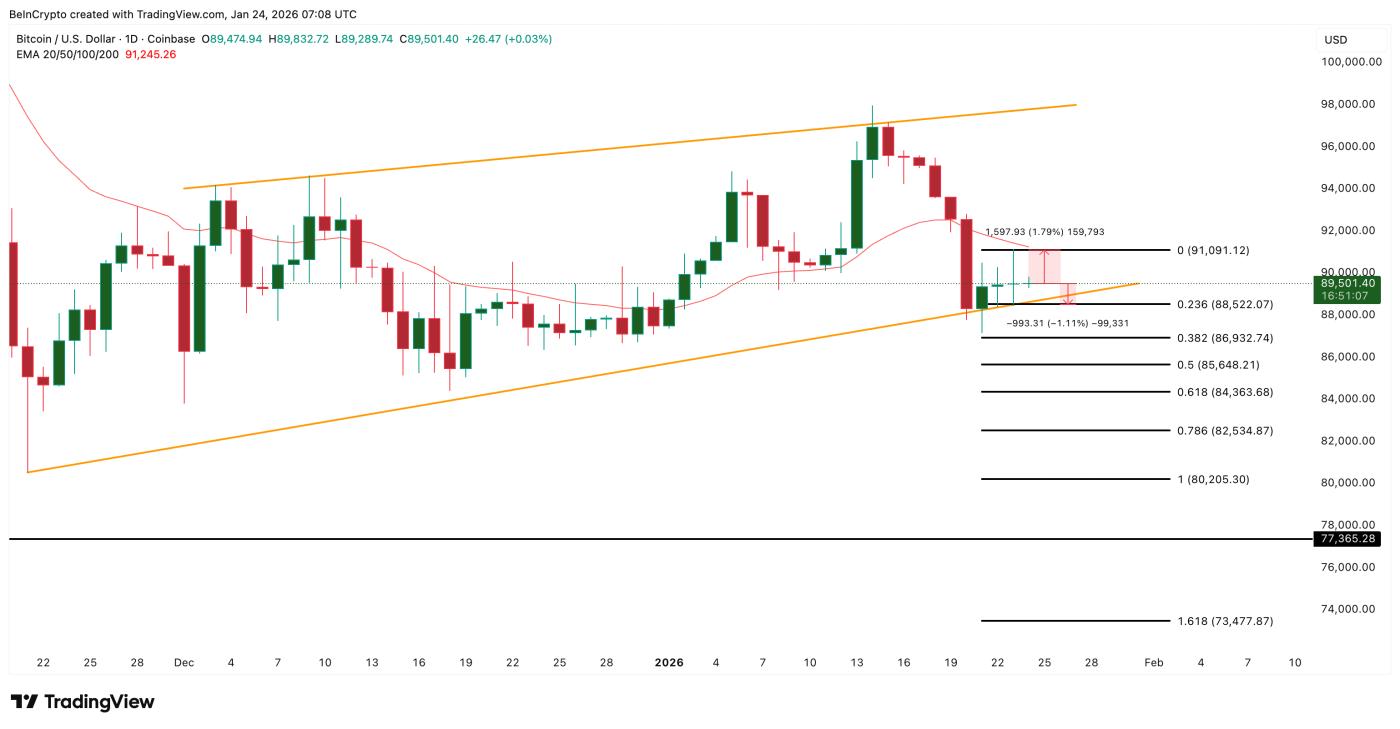 Bitcoin Price Analysis: TradingView
Some key Bitcoin price levels to watch are first $84,300, followed by a wedge target around $77,300. If buying from long-term holder continues to slow and Miners continue to sell, these price zones become even more noteworthy.


