Zcash prices have just made a significant move after weeks of stagnation. Since January 19, 2024, the price of ZEC has increased by nearly 15%, bouncing from a Dip of around $336 to approximately $362. This recovery occurred just days after a bearish pattern was broken, a situation that often easily traps hasty short sellers.
On the surface, the Zcash price structure remains quite risky. However, internally, the market is showing a quiet but increasing accumulation of momentum. Currently, all attention is focused on a crucial point: Zcash is approximately 9% below a Fibonacci level, and the key EMA is also in this area. Only when the price breaks above this level will we know whether this recovery is just a rebound or could open up a stronger upward wave.
The recovery has brought the 100-day EMA back into focus.
This recovery phase did not occur by chance.
After the Vai and Vai pattern was broken, the price of Zcash briefly dropped to around $336 before buyers started placing orders, potentially triggering a bearish trap .
Since then, the price has increased by approximately 15%, but has stalled just below the 100-day EMA (exponential moving average). The EMA is a trend indicator that prioritizes weighting of the most recent price levels.
The last time Zcash reclaimed the 100-day EMA was on December 3, 2023, after which the price surged by over 70% in just a few weeks. This doesn't mean history will definitely repeat itself, but it does highlight the current importance of this EMA level.
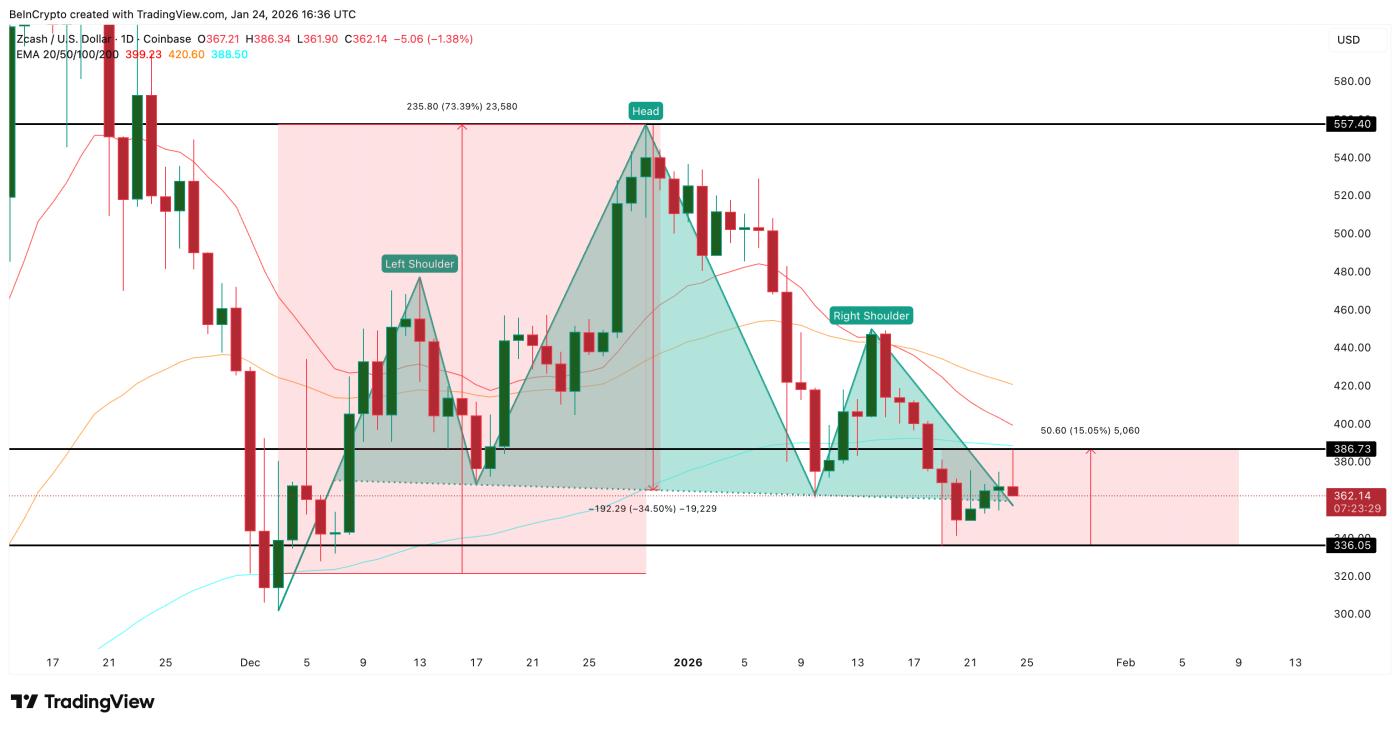 Setting up a Zcash price trap: TradingView
Want to learn more about Token like these? Sign up for editor Harsh Notariya's daily Crypto newsletter here .
Conversely, selling pressure remains strong around the resistance zone. ZEC has yet to break above $386 – the same level where the recent rally stalled, indicating that supply remains abundant. Therefore, the bearish structure is technically still intact. The question is whether the accumulated buying pressure below will be strong enough to push the price to break through further.
To answer that, let's XEM at who bought in after January 19, 2024.
Whales accumulate as bargain- Dip buying increases.
on-chain data shows accumulation in the largest wallets – which have the greatest impact on price.
Over the past 7 days, the "mega whales" (the 100 largest wallet addresses) have increased their ZEC holdings by approximately 9%, bringing their total balance to around 42,623 ZEC. This means that during the recent recovery phase, these whales accumulated nearly 3,500 more ZEC.
Regular whale wallets also joined the fray, with their balances increasing by approximately 5%, now reaching roughly 10,182 ZEC. This represents an increase of about 480 ZEC during the same period.
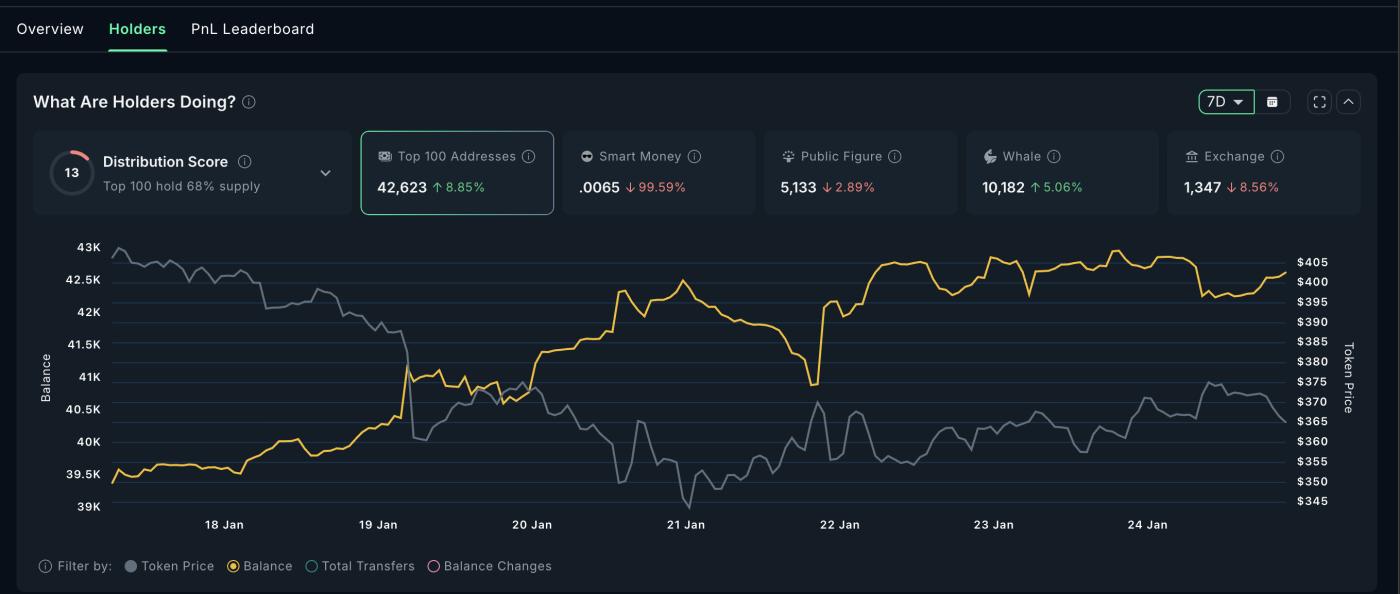 Continue accumulating ZEC: Nansen
In total, since January 19, 2024, whales have accumulated approximately 4,000 ZEC. This wasn't buying at the peak, but rather accumulation after the price confirmed a breakdown, with the expectation of stronger price action. However, "smart money" has completely withdrawn, indicating that expectations for a short-term recovery remain quite low.
Momentum indicators are also supporting this view. From January 14th to January 24th, 2024, the price of ZEC continuously decreased, but the Money Flow Index increased, creating a bullish divergence.
The MFI measures buying and selling pressure through both volume and price, making it a highly sensitive indicator for " Dip-fishing." If the price falls while the MFI increases, it means there is a quiet inflow of buying capital, which often helps limit the risk of further sharp declines.
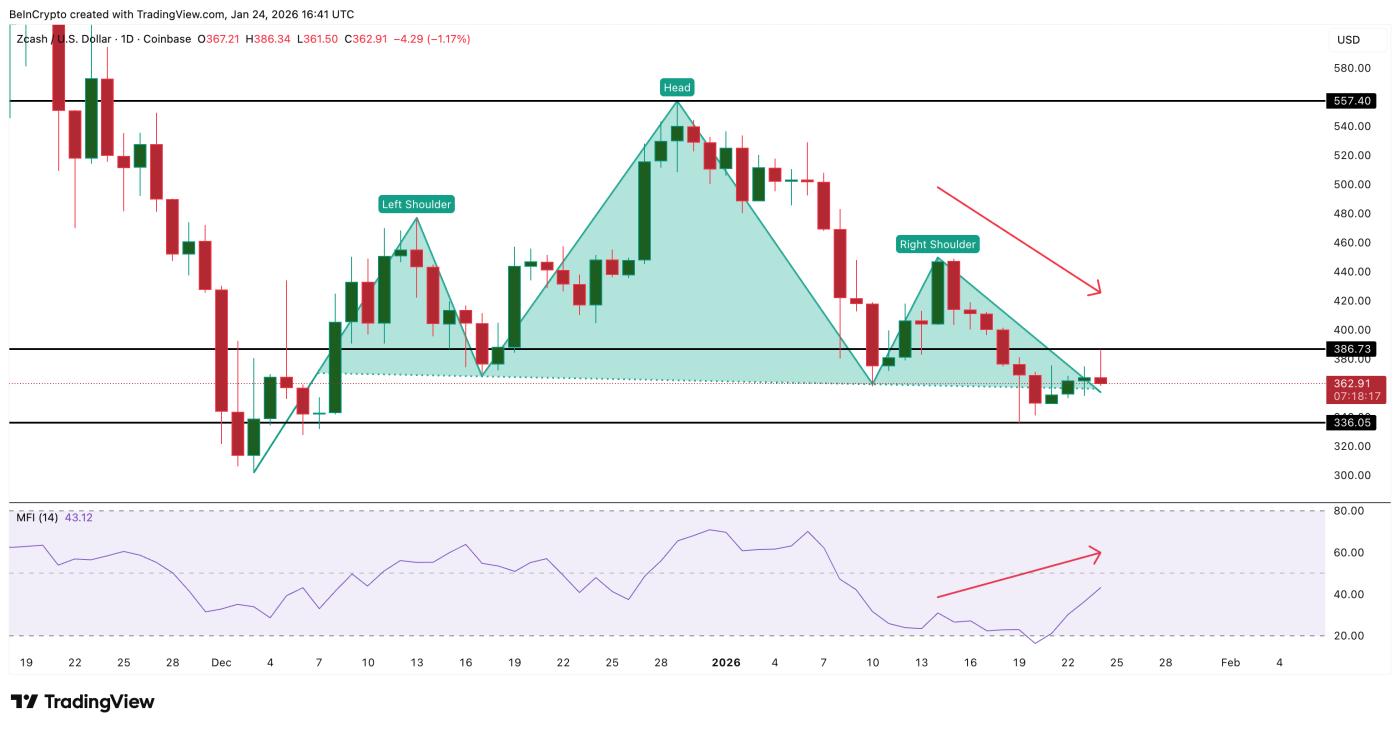 Bottom Dip is working: TradingView
In the Derivative market, the situation shows a more balanced movement. After the recent volatility, leverage usage has adjusted, with buyers and sellers nearly equaling each other. Over the next 30 days on the perpetual ZEC contract at Binance, liquidated Short positions still slightly outnumbered Longing positions, totaling $26.37 million (Short) compared to $22 million (Longing).
This slight deviation means that the ZEC price doesn't necessarily have to reverse completely; even a moderate price push can trigger a series of Short order closures.
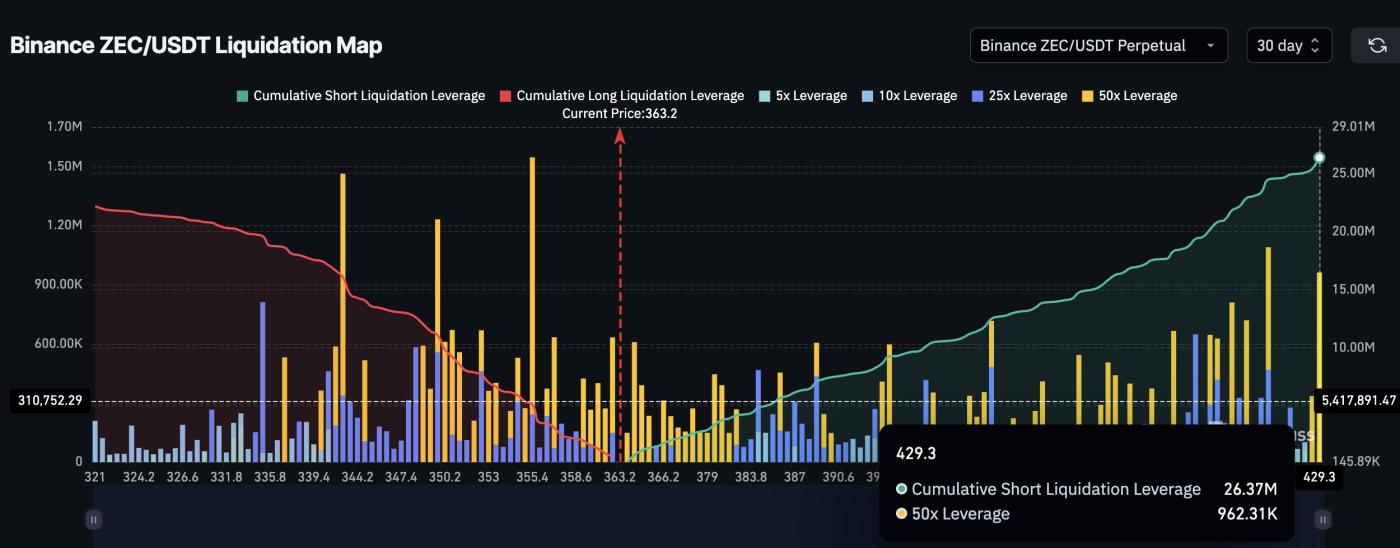 Short still outperform Longing: Coinglass
In summary, all of these signs point to one thing: accumulation is still present in the market.
Zcash price levels confirm or dispel bearish traps.
The current structure is simpler.
On the downside, the signal is not positive if ZEC loses the 335-336 USD mark at the close of the daily candle. If the price falls back below this area, the bearish pattern continues and the risk of a deeper decline opens up.
On the upside, the key test area lies around $386-$395 (coinciding with the 0.236 Fibonacci level), representing a gain of approximately 9% from the current price. This area also coincides with the 100-day EMA. If ZEC closes the daily candle above this zone, this action would resemble the December rally and significantly weaken the previous bearish pattern.
If this resistance is broken, the next area ZEC could target is around $463 – where a significant amount of supply and previous liquidation orders are concentrated. If this area is breached, the bearish Vai and Vai pattern will be completely invalidated. If it breaks above $557, the bearish scenario for the entire market will be broken.
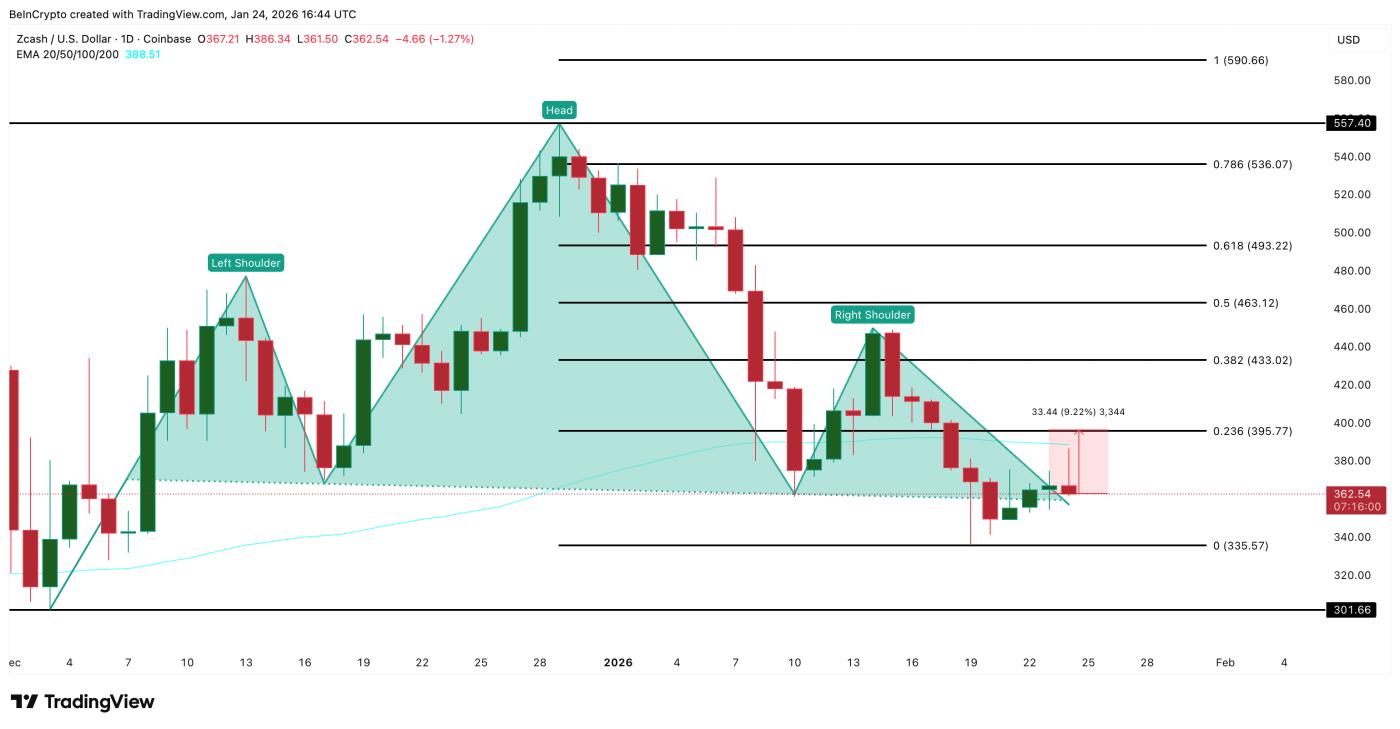 Zcash price analysis: TradingView
Until the price clearly breaks through one of the above zones, the Zcash price is still fluctuating within a fairly narrow decision range.
The conclusion is quite clear: ZEC has recovered 15% from its previous level, whales are quietly accumulating shares while prices are weak, and buying pressure has emerged at lower price levels. Currently, the price is only about 9% away from the zone that previously generated significant price swings.